Introducing the world's only platform architected to analyze petabytes with AI
🤖 Meet OnCall AI, our observability copilot that makes troubleshooting easy. Read announcement.

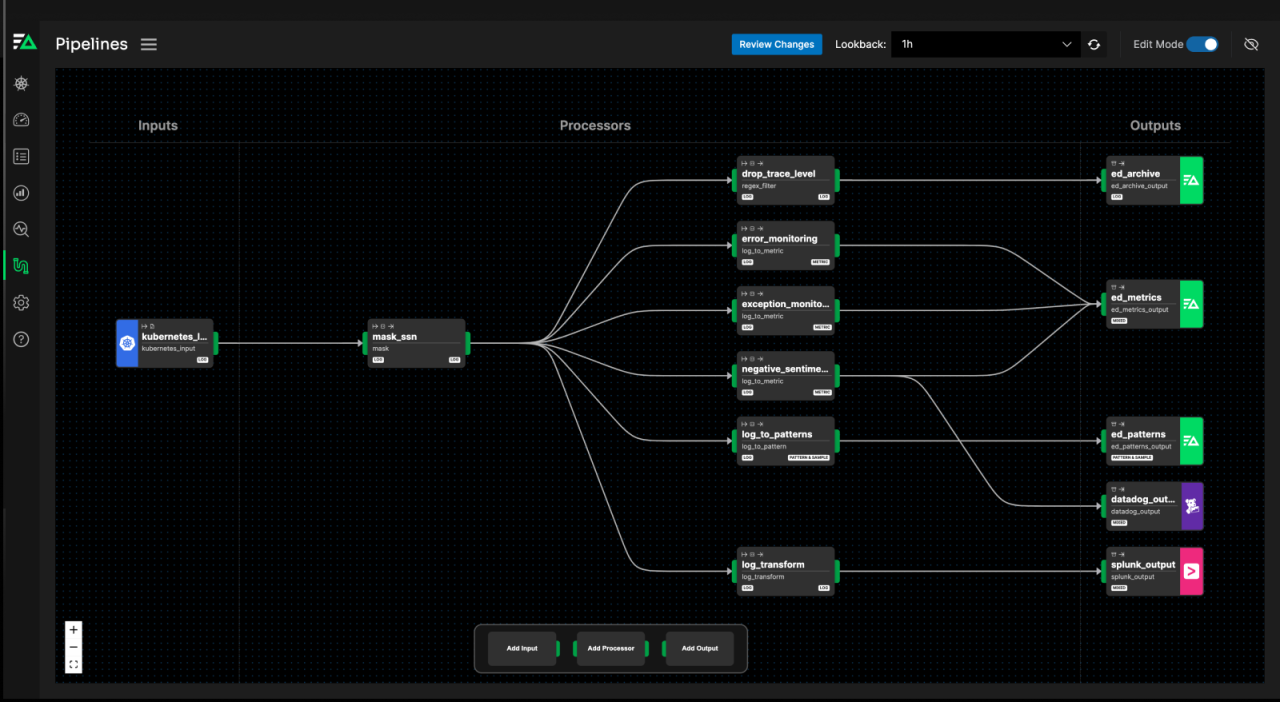
Control Your Data Footprint
Edge Delta provides a control point upstream to help you capture the right data, shape data in-flight, and route it to the optimal destination.
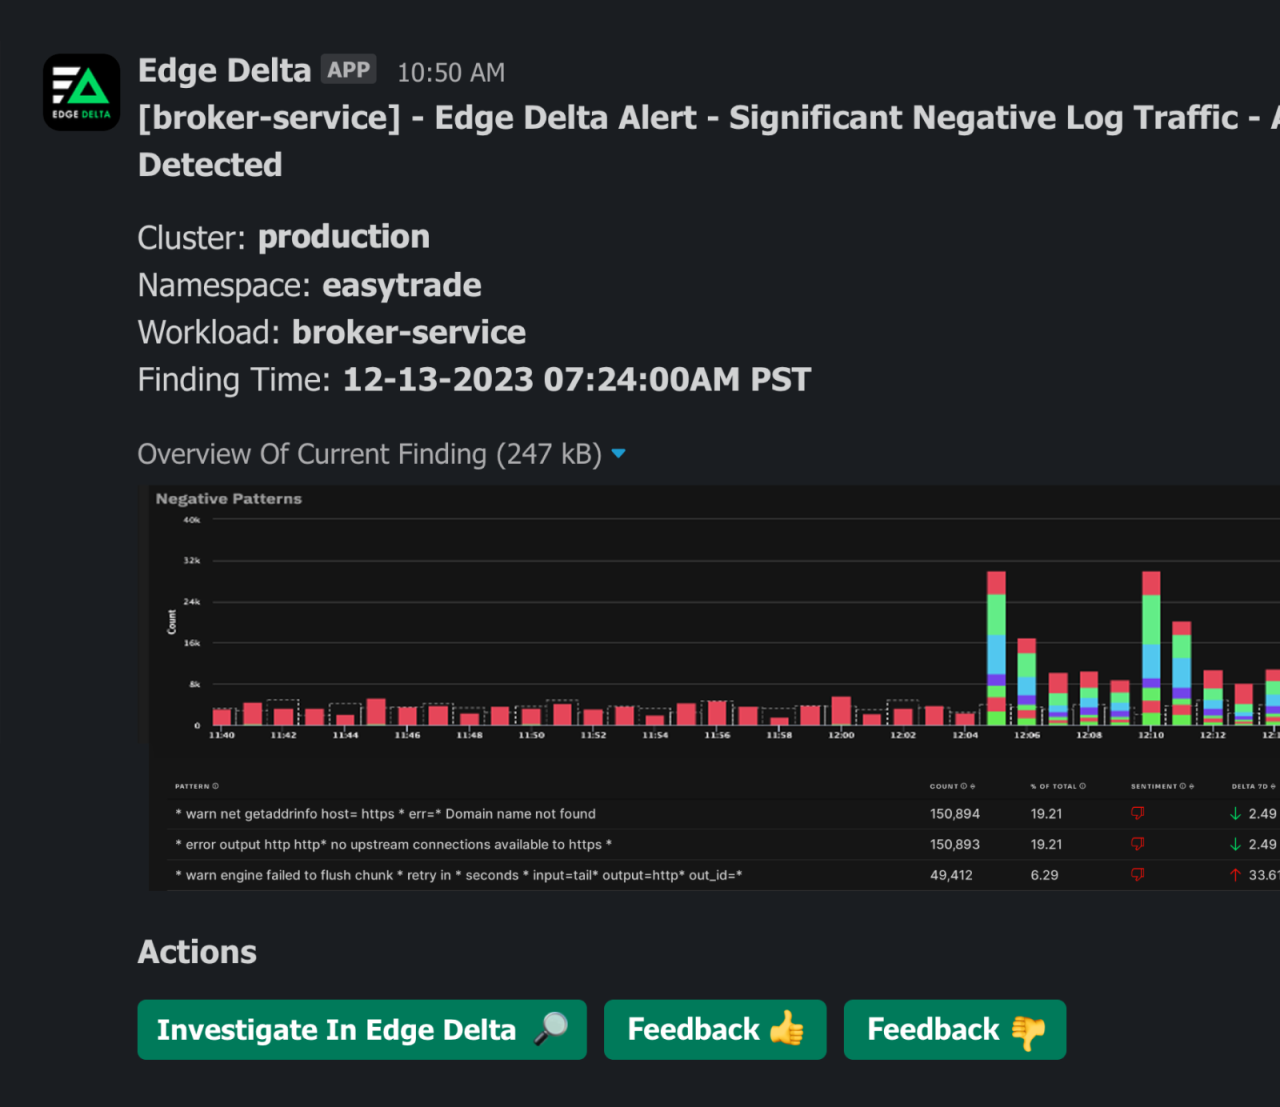
Automate Monitoring
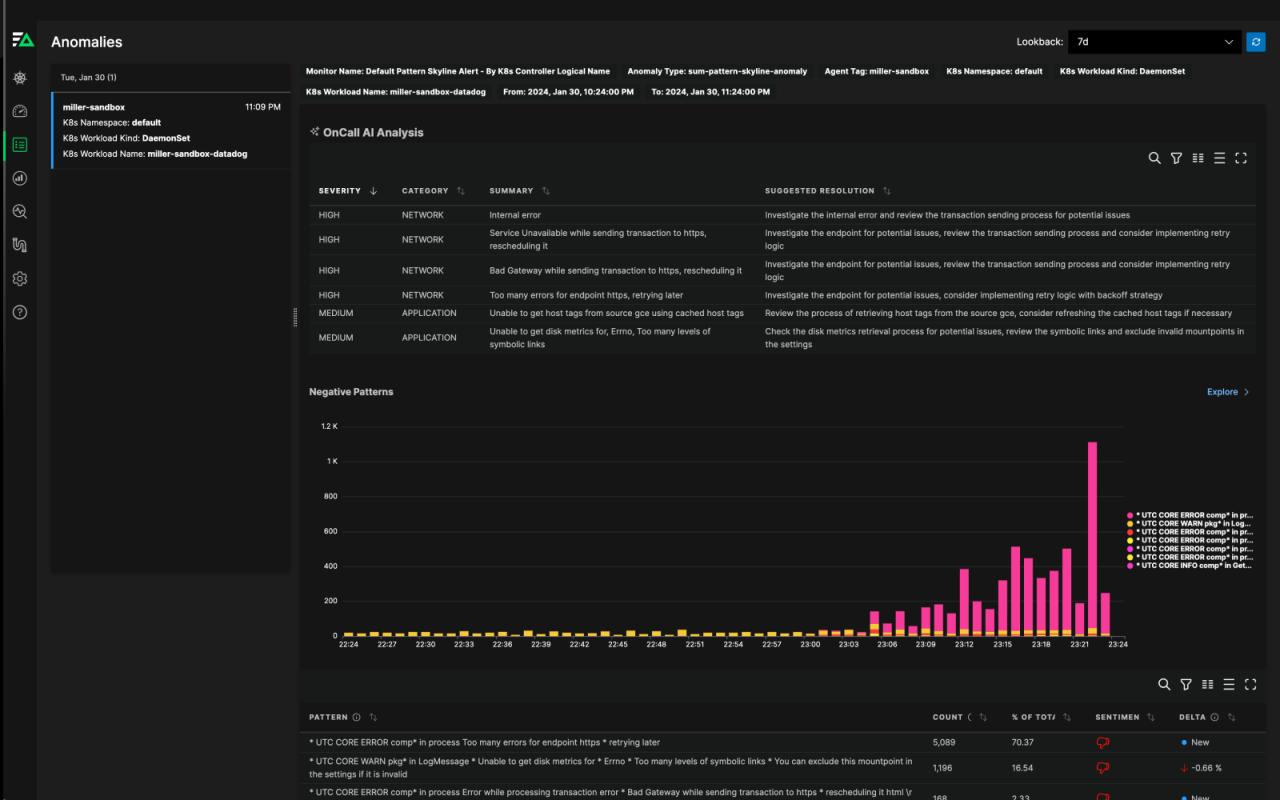
Edge Delta uses AI to automatically detect and alert on anomalies. Now, you don’t have to spend time defining alert thresholds or even predict what conditions to monitor.
Resolve Issues Effortlessly
Edge Delta summarizes your log data, so you don't have to sift through every event. With each alert, you can see exactly what changed and what resources were affected.
Log Everything
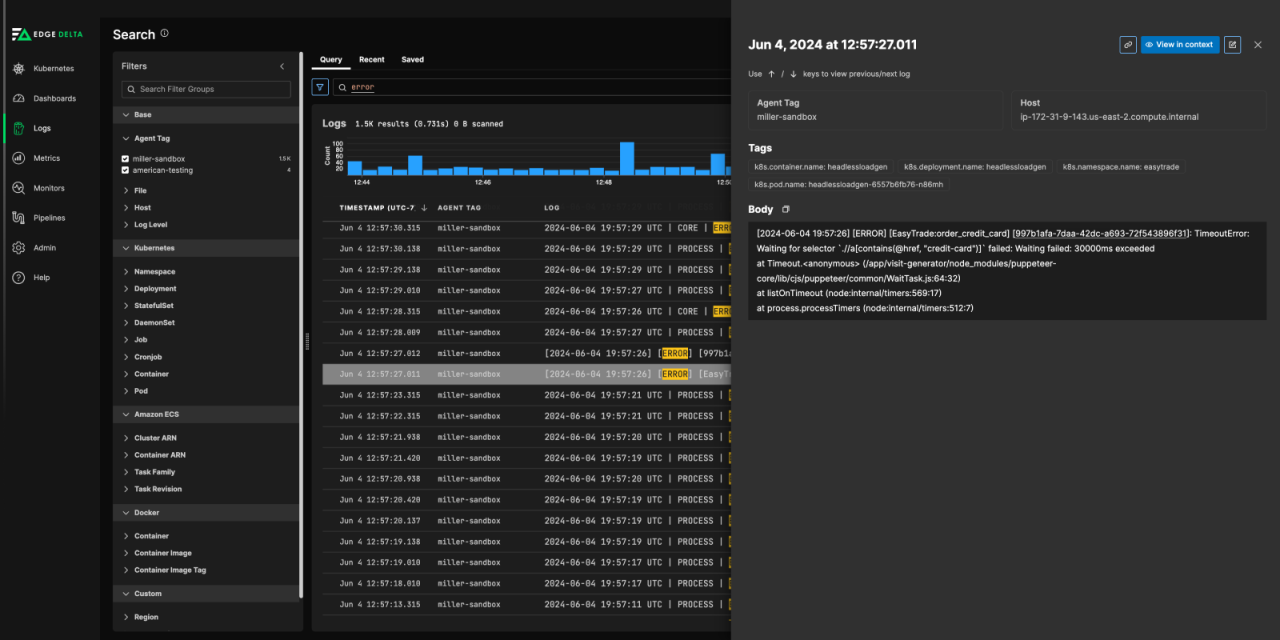
Store and search all your data. Edge Delta's distributed architecture enables cost-effective observability at scale. Now, you can stop sampling and filtering events to contain costs.
Join the World's Best Engineering Teams
See why leading engineering teams trust Edge Delta to automate observability. You'll be up and running in a matter of minutes.
2023 Gartner Cool Vendor
Edge Delta was recognized as a 2023 Gartner® Cool Vendor™ in Monitoring and Observability.

SOC 2 Type 2 Certified
You can trust Edge Delta to support your sensitive, mission-critical information.
Trusted By Teams That Practice Observability at Scale
Get Up and Running in Minutes
With Edge Delta, observability works out of the box. Get set up in minutes, end ongoing toil, and gain pre-built views that make monitoring easy.
