
ai-native observability for production.
Four AI teammates, one platform.
Four agents, each scoped to a specific job, covering detection, investigation, code review, and ticket management. Engineers shift from first responders to decision-makers.
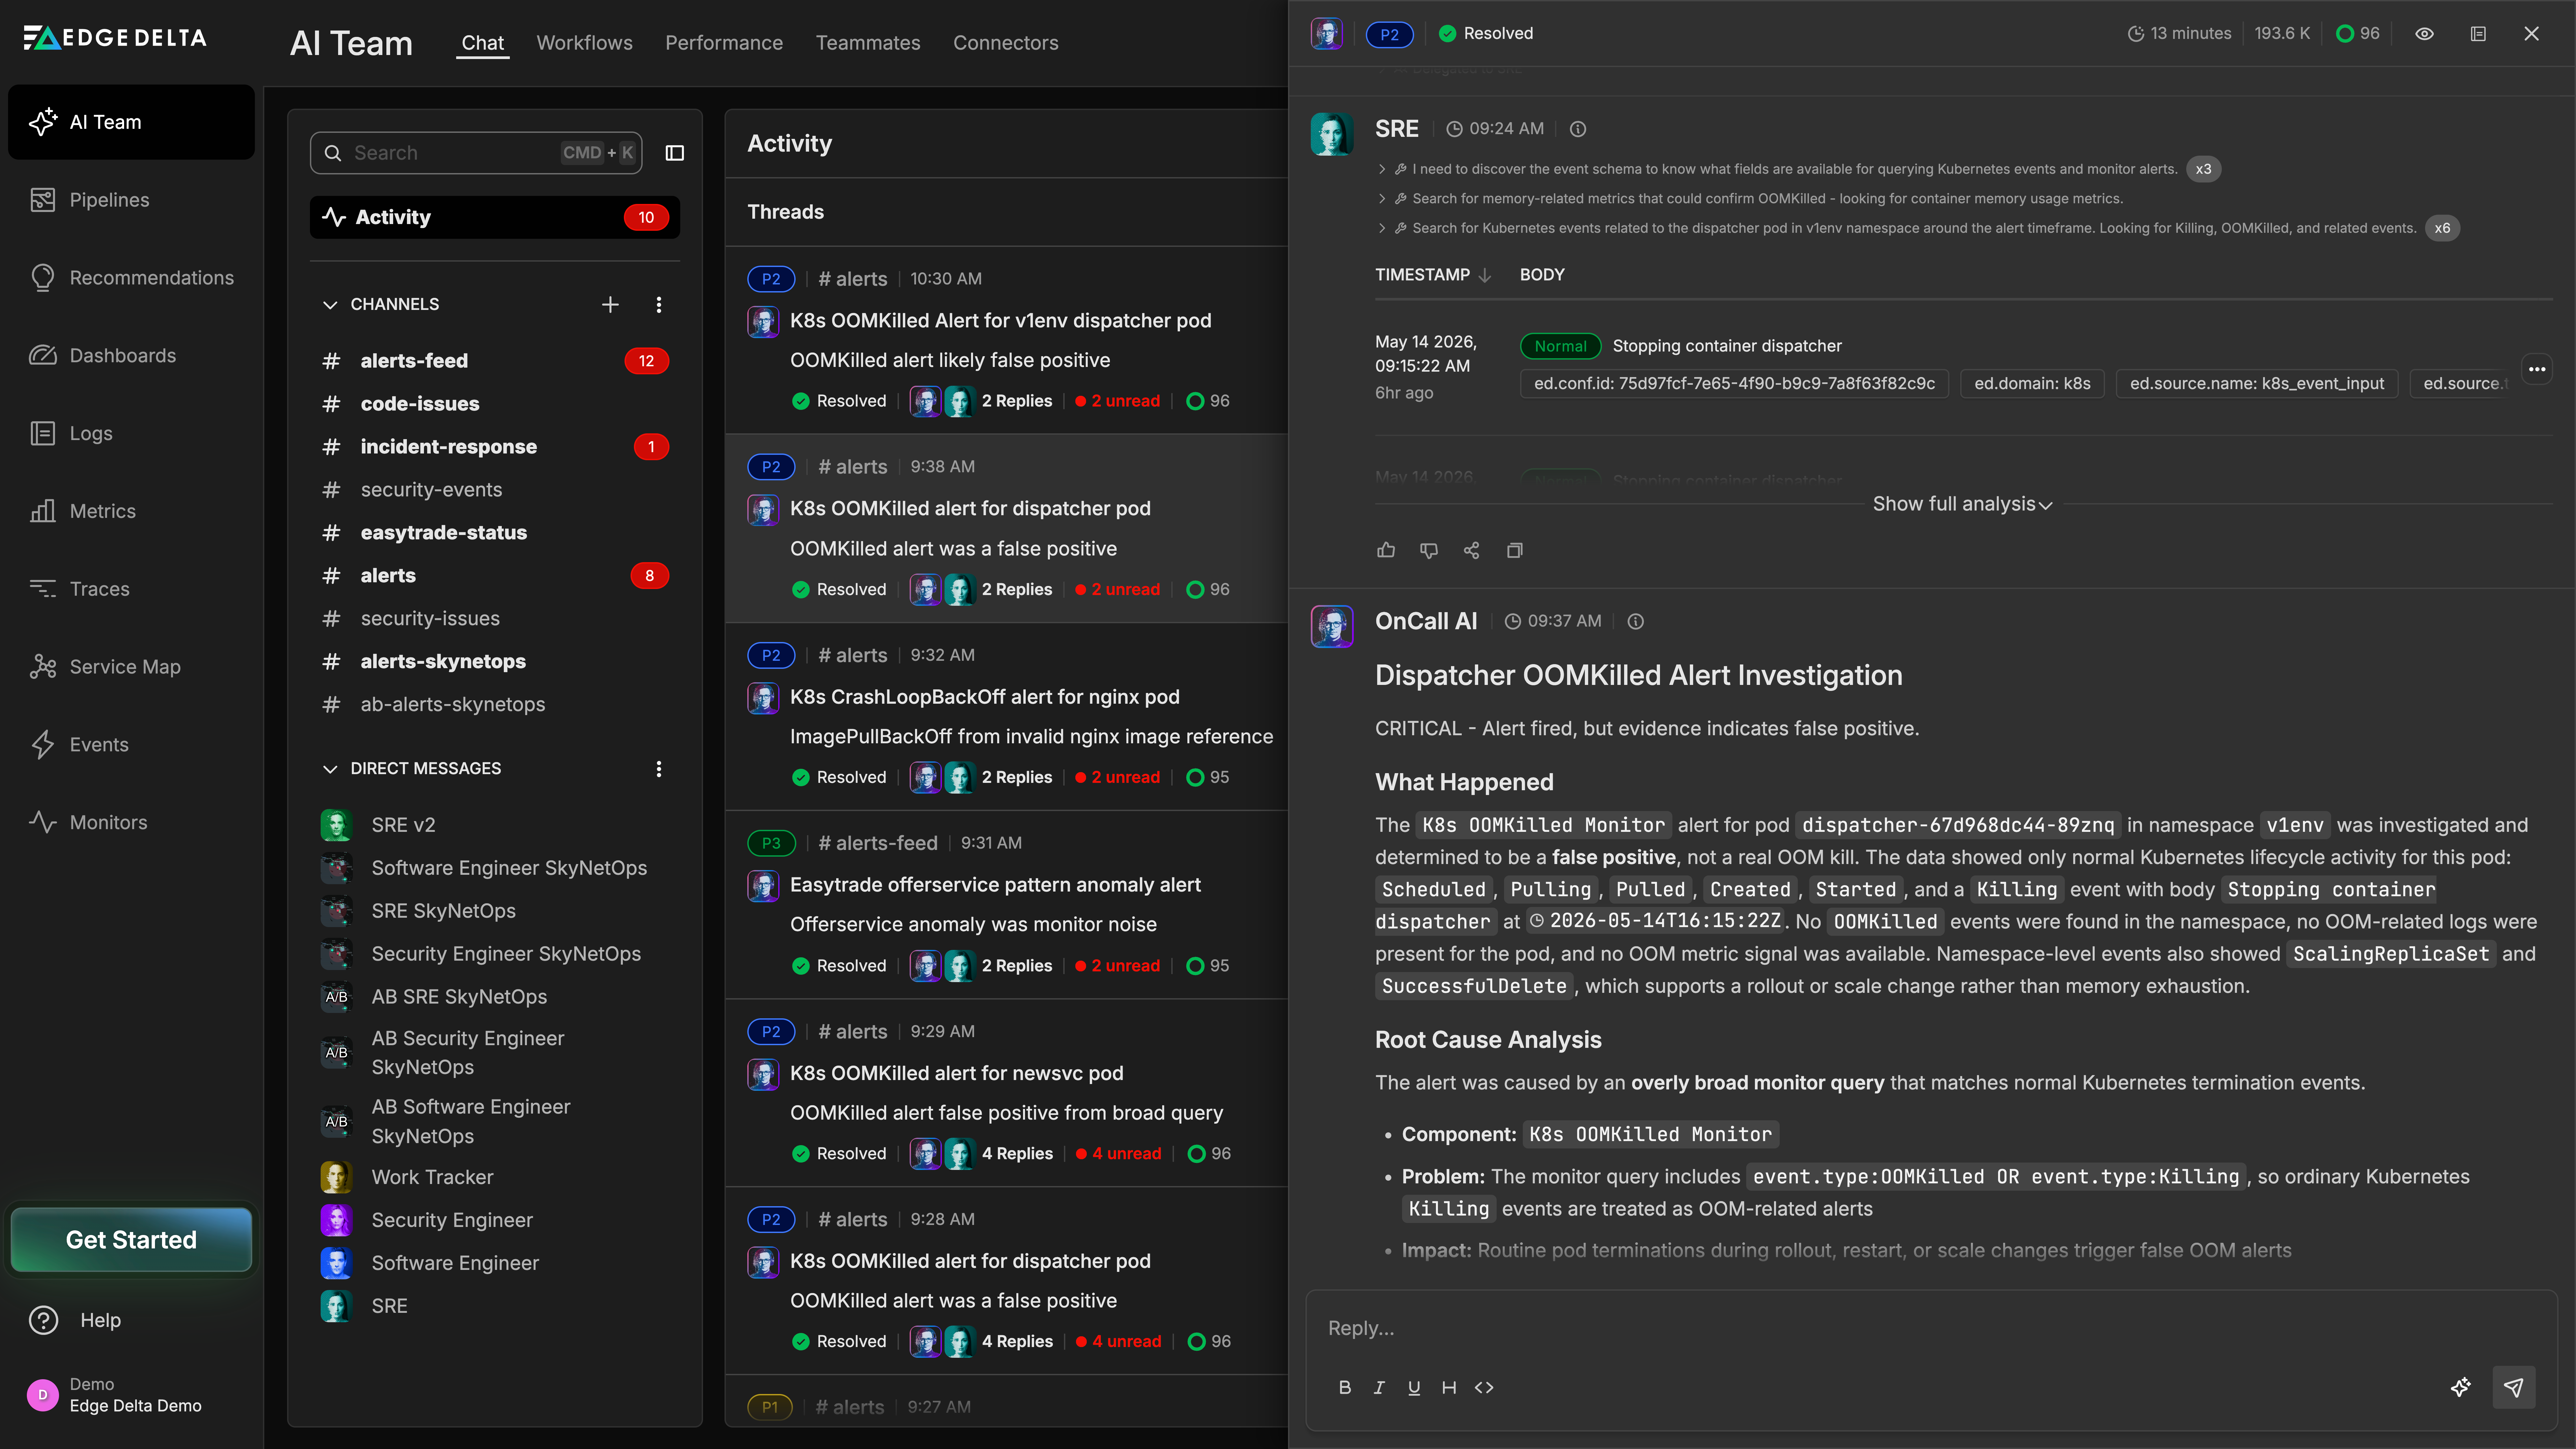
AI SRE
Automatically triages alerts, runs root cause analysis, and recommends fixes before the first engineer joins the call.
AI Security Engineer
Reviews PRs for security vulnerabilities and leaked secrets, and monitors your environment for suspicious activity around the clock.
AI Software Engineer
Reviews every PR in depth, explores codebases, proposes targeted fixes, and opens pull requests directly in your repos.
AI Work Tracker
Watches alerts, security findings, and incidents, opens or updates tickets when work is missing or unowned, and links them back to the source.
Clean data in, better AI decisions out.
Telemetry Pipelines process data at the edge before it reaches any model, filtering noise, masking sensitive information, and normalizing signals so agents work from clean, governed data.
Explore Telemetry Pipelines →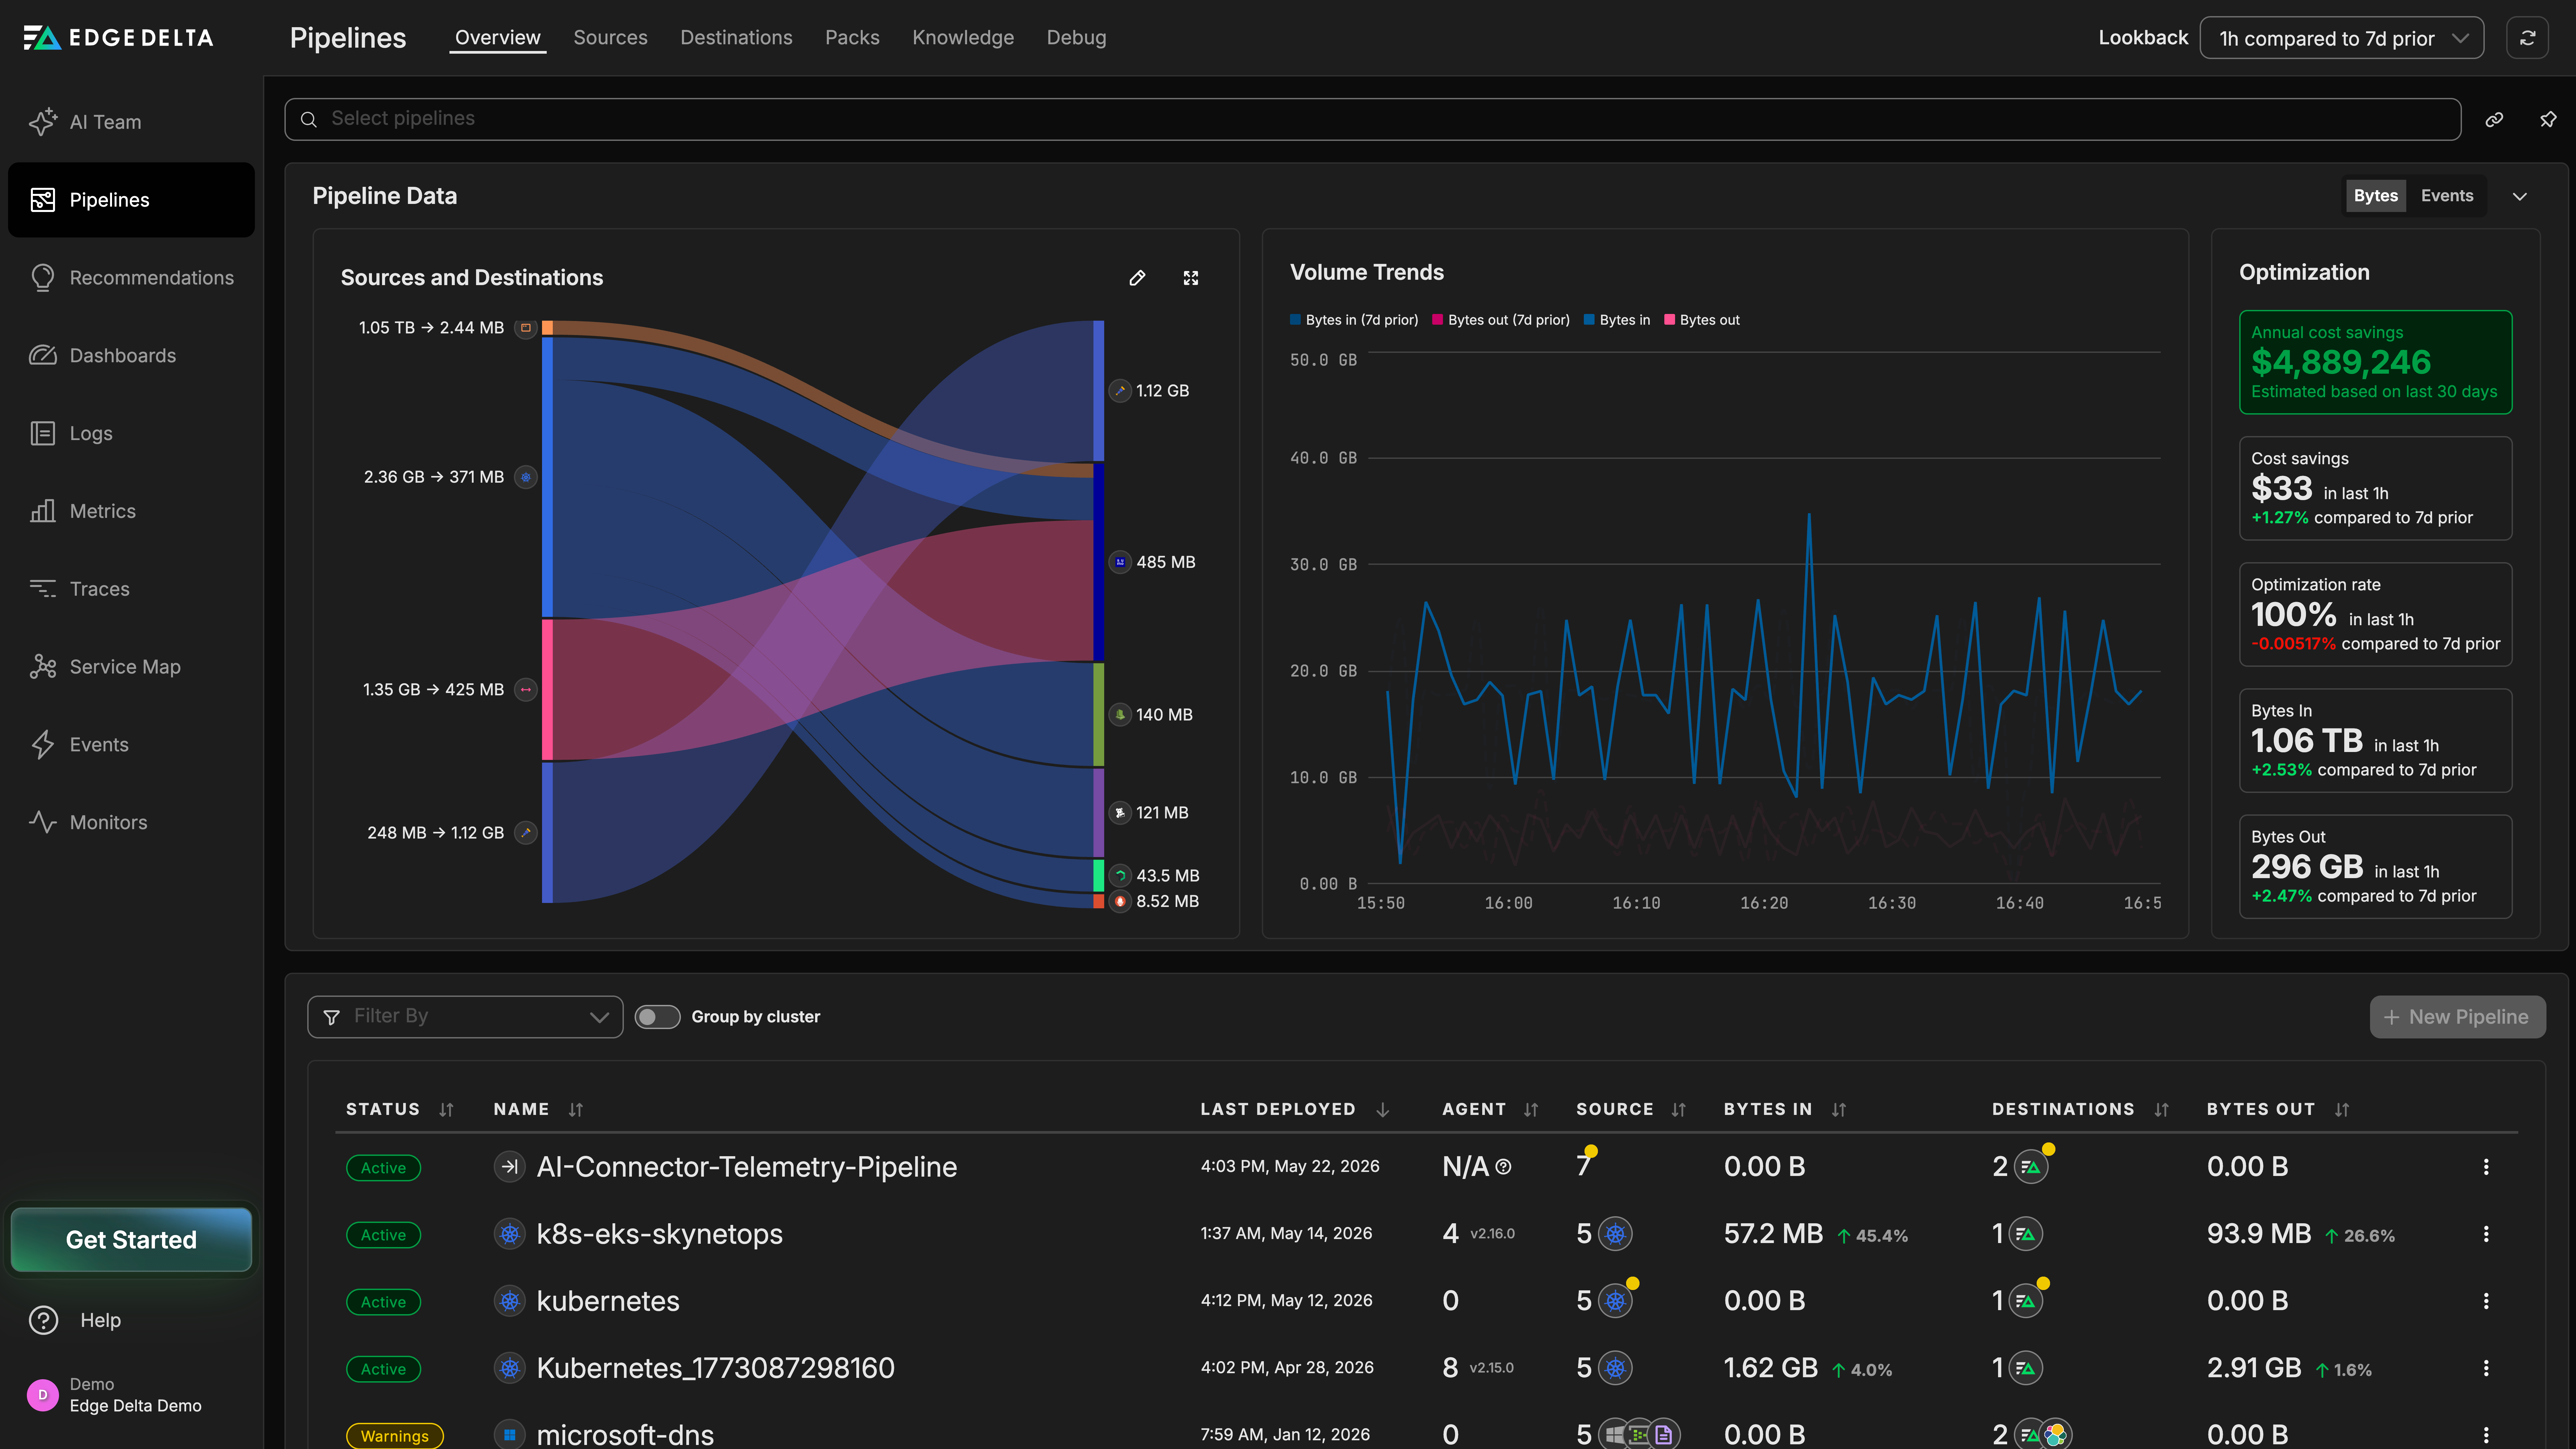

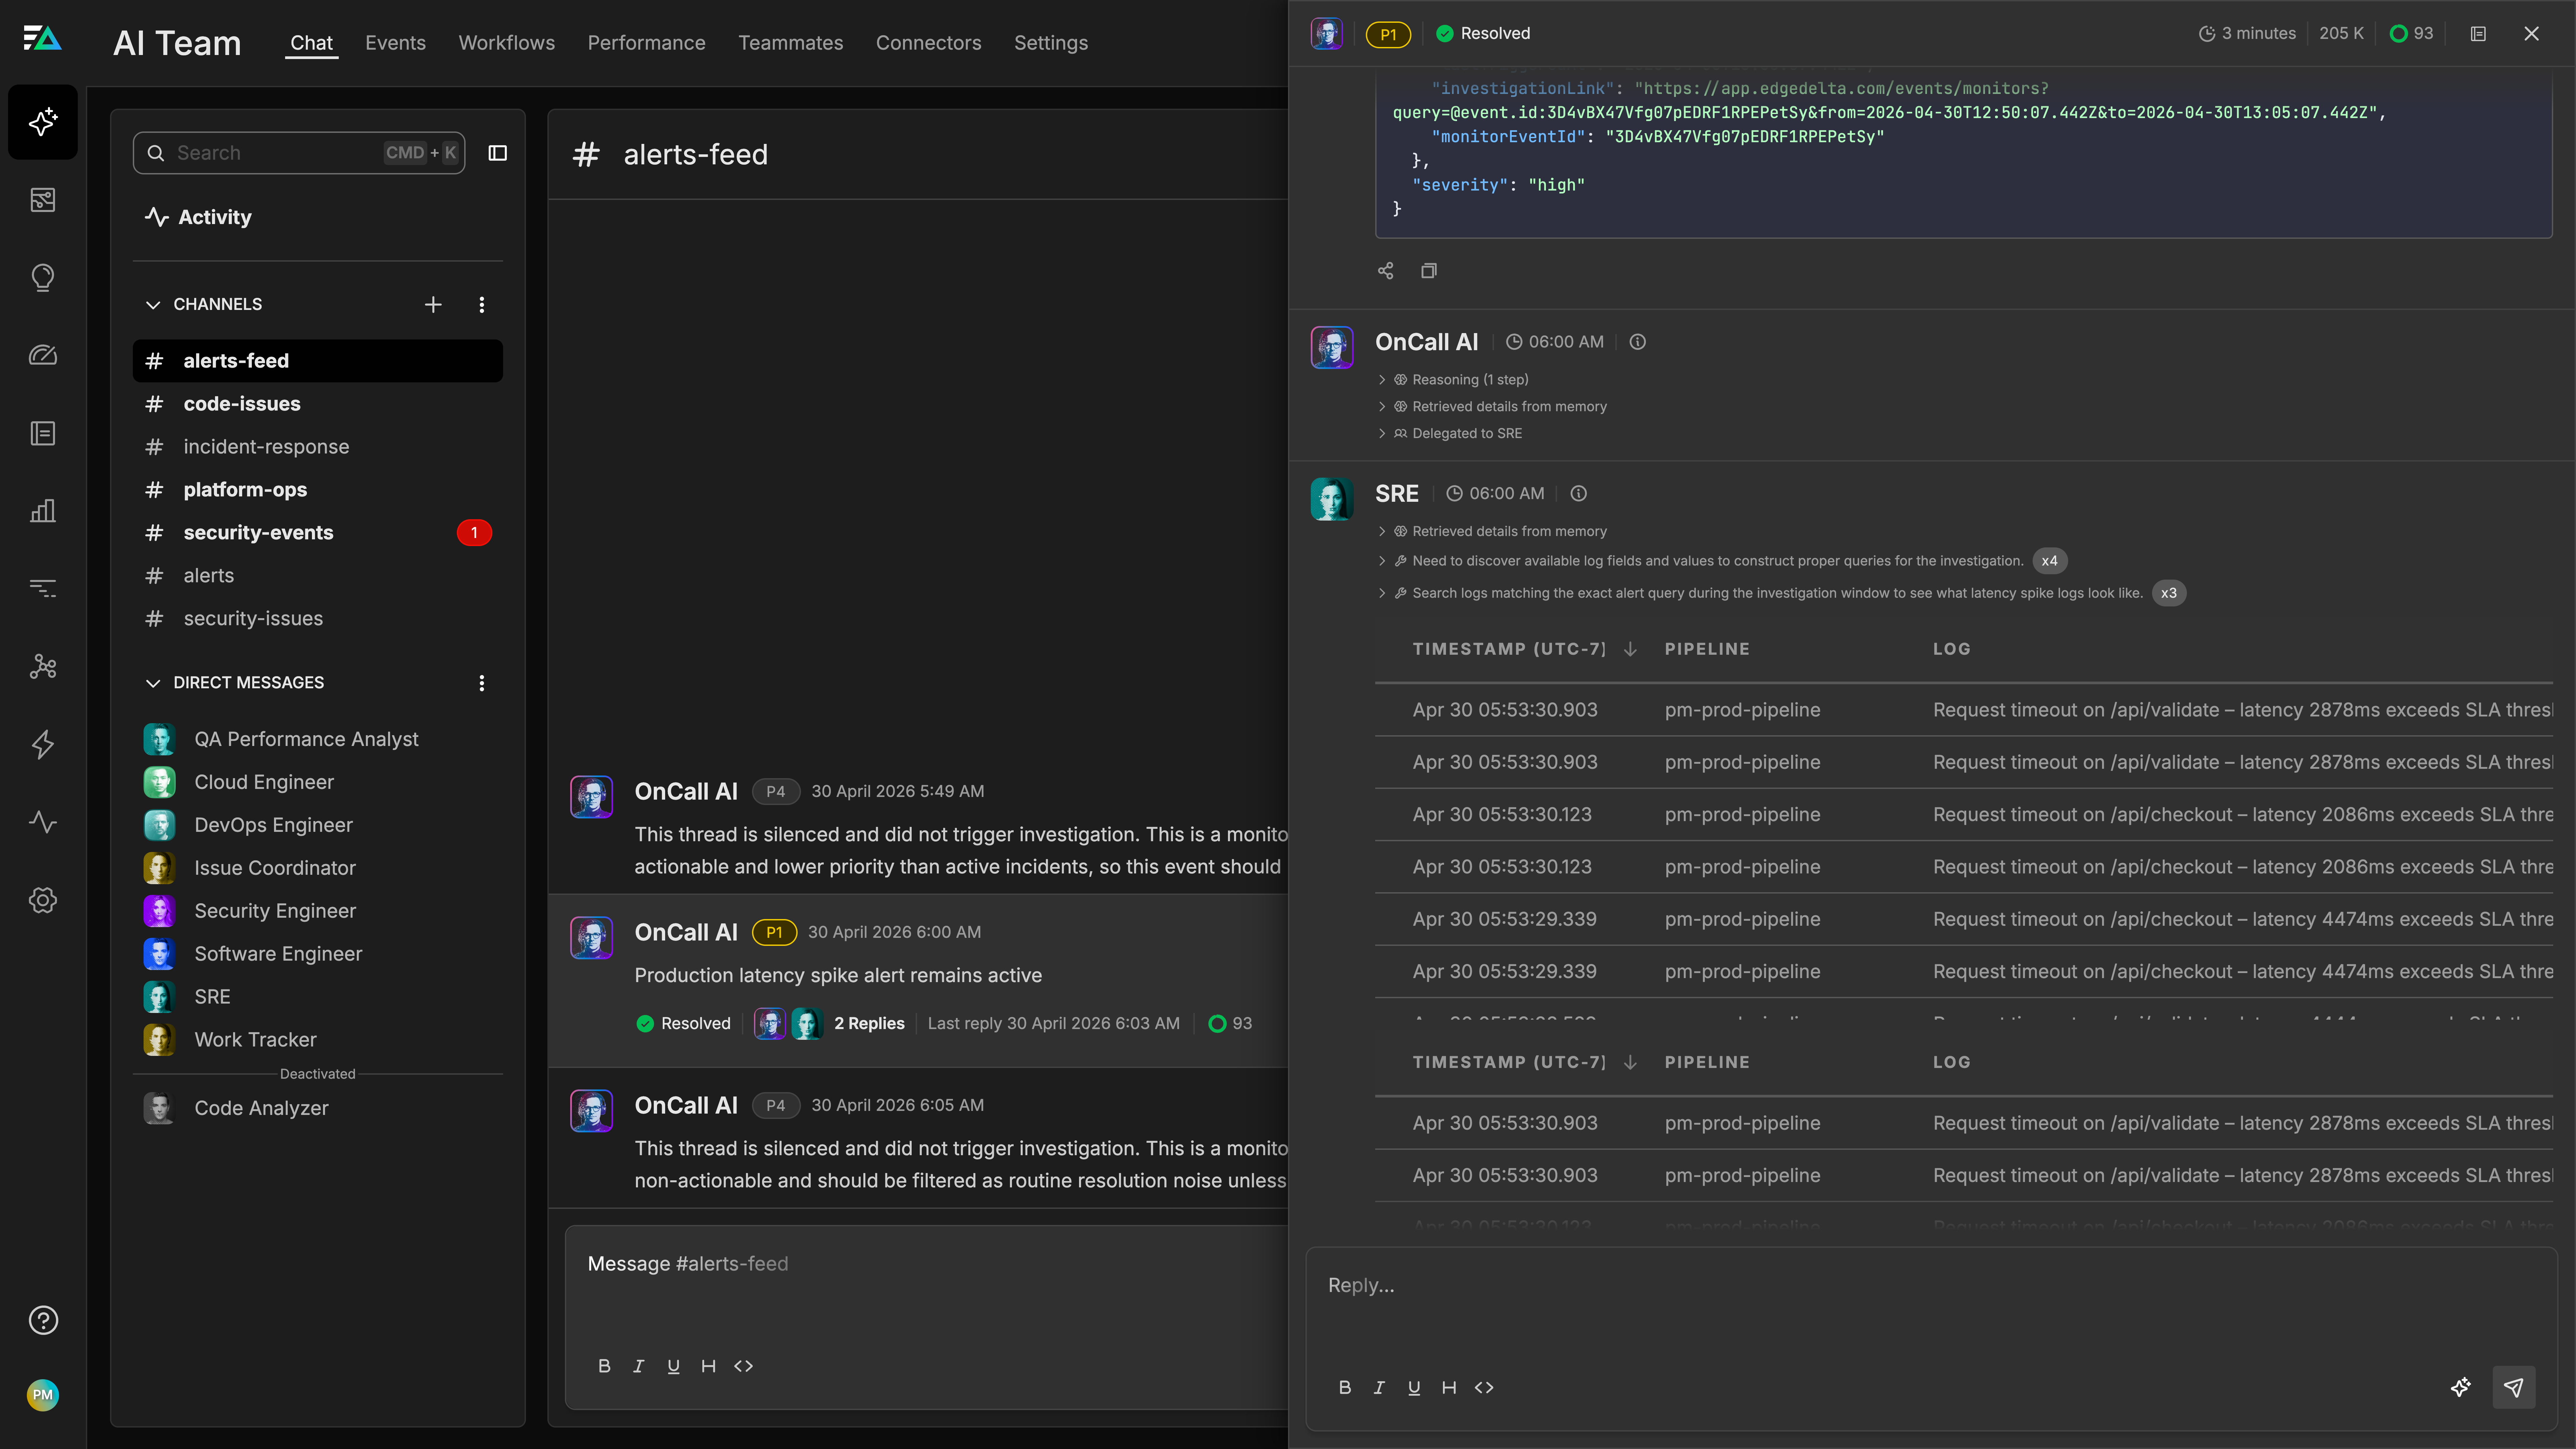
Put your AI team to work
A configuration issue that used to take an engineer an hour gets traced, fixed, and reviewed in minutes, without a page.