metrics your AI teammates act on.
Activate Agents→
✓ Ingest from any source·✓ Automatic anomaly detection·✓ Built for AI Teammates
Built for AI Teammates
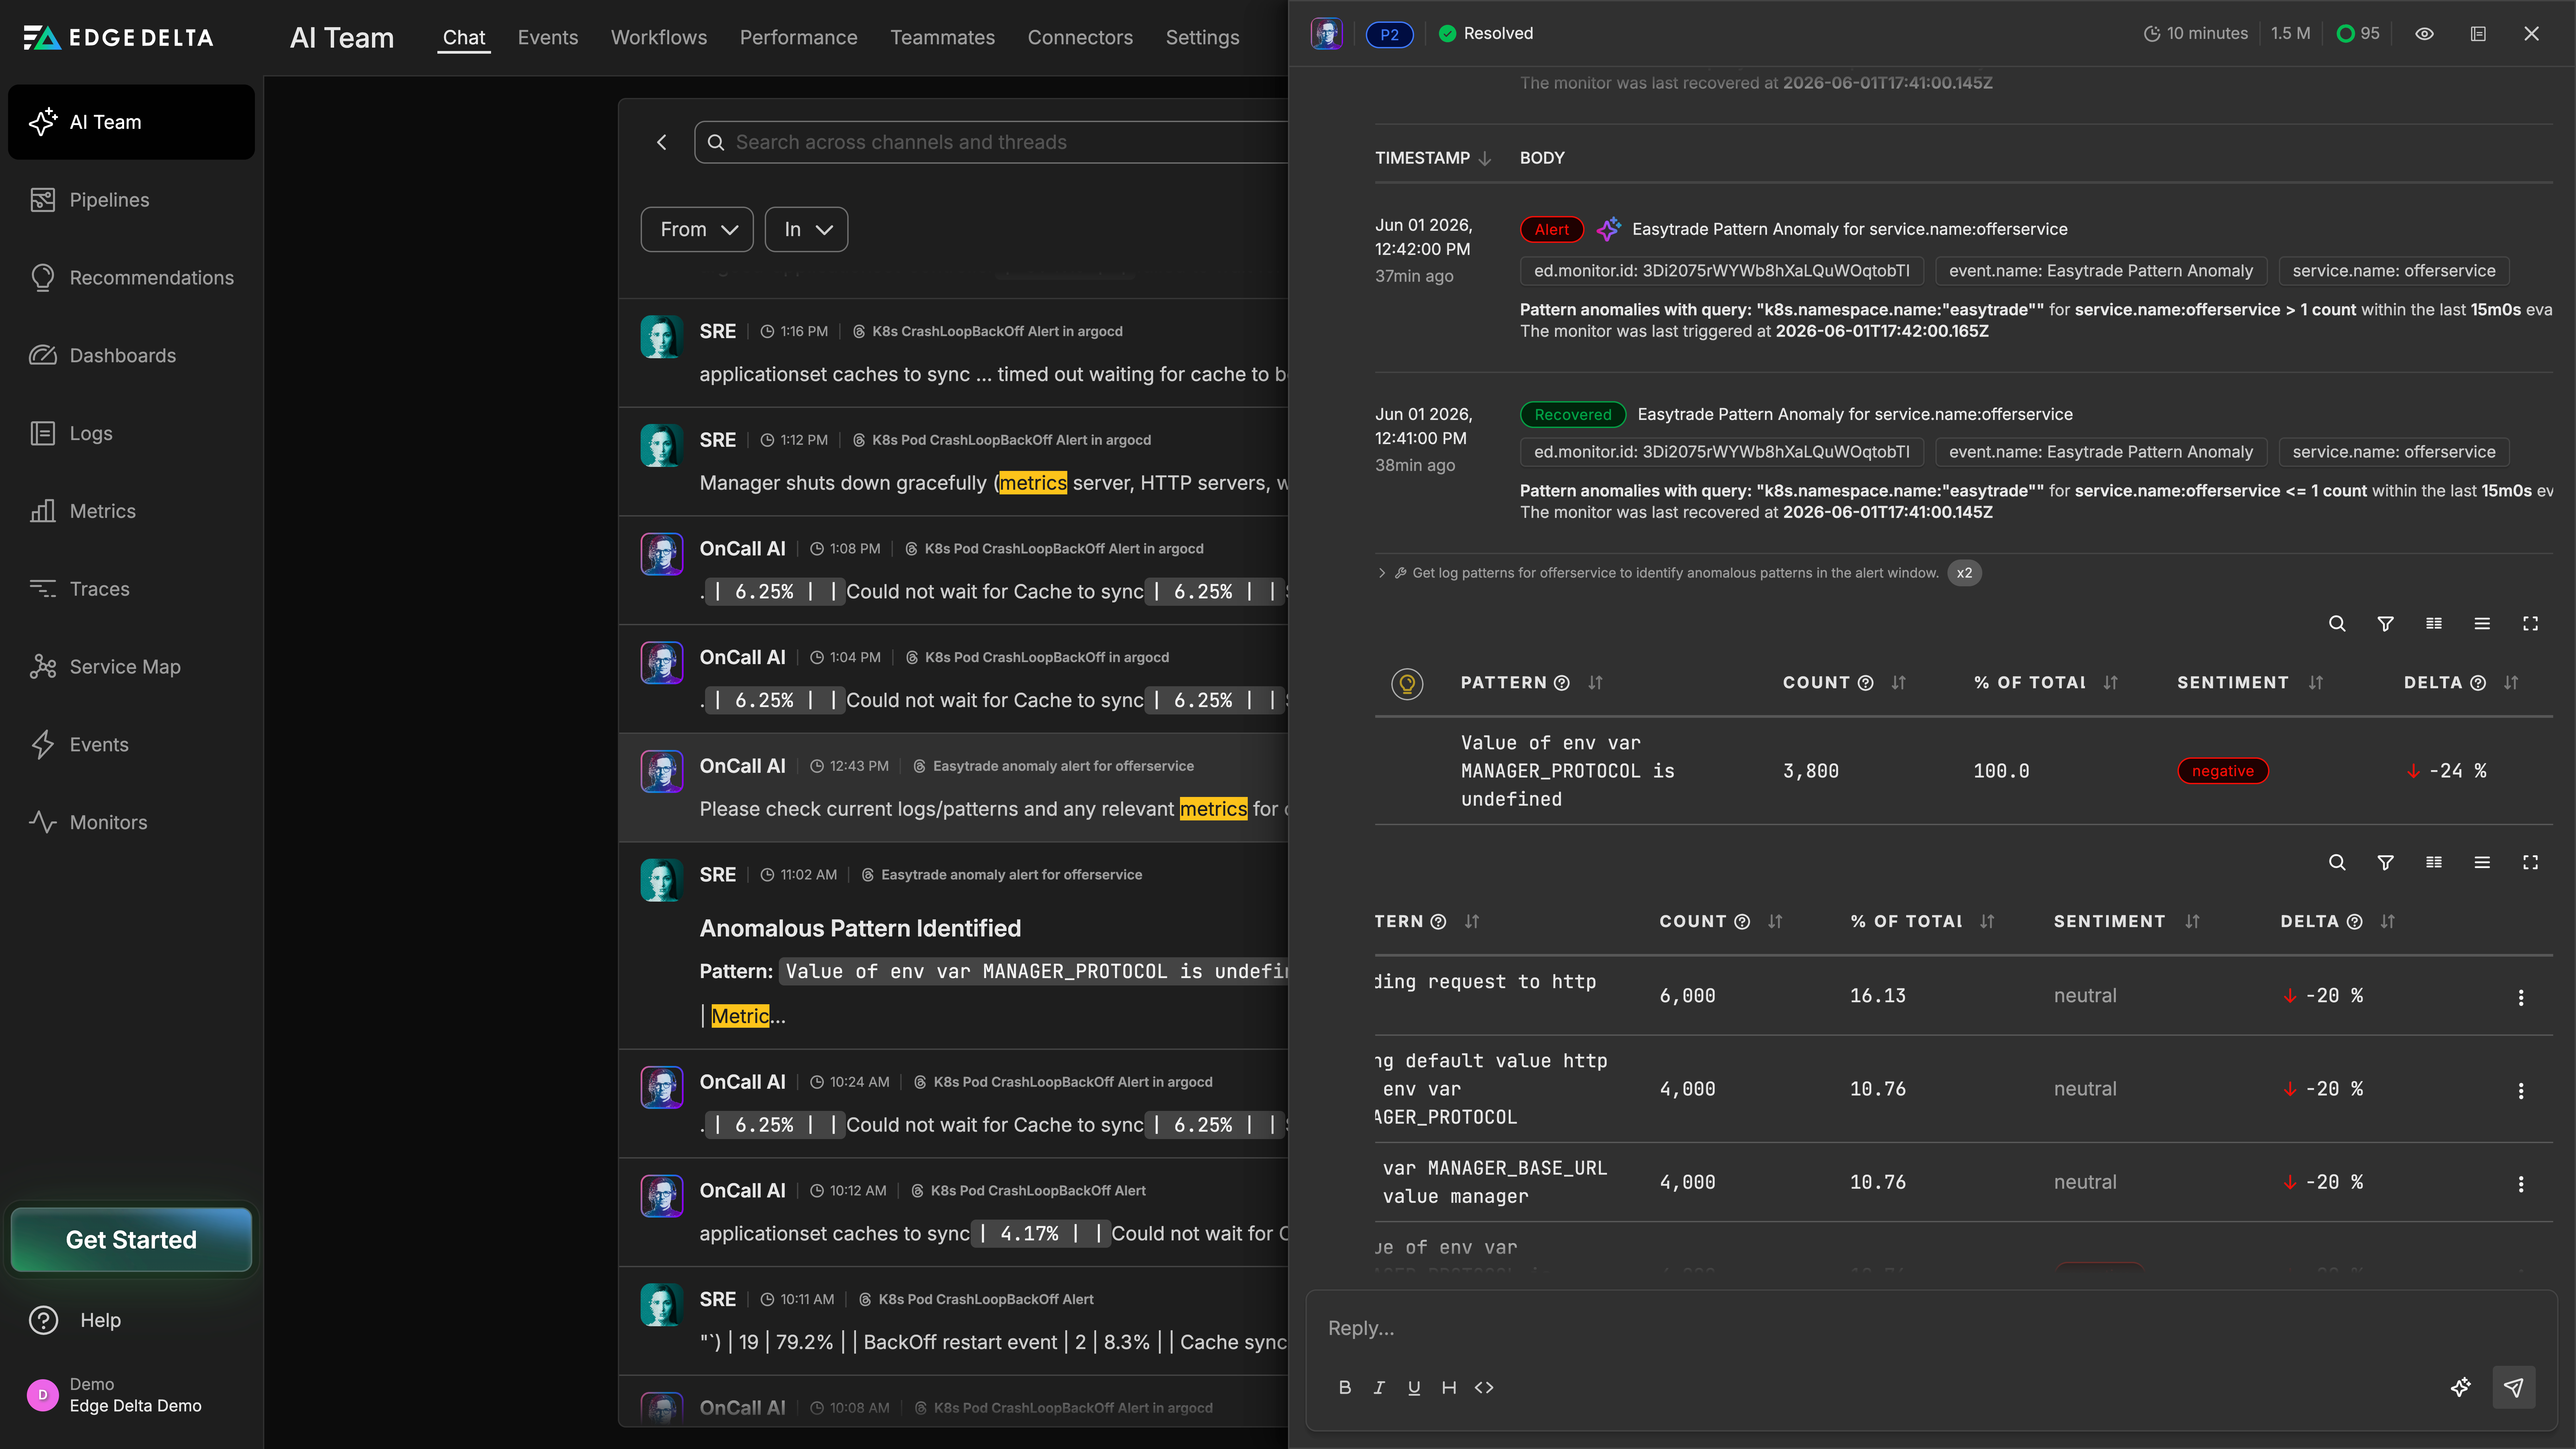
Your metrics, correlated across services by AI teammates before anyone gets paged.
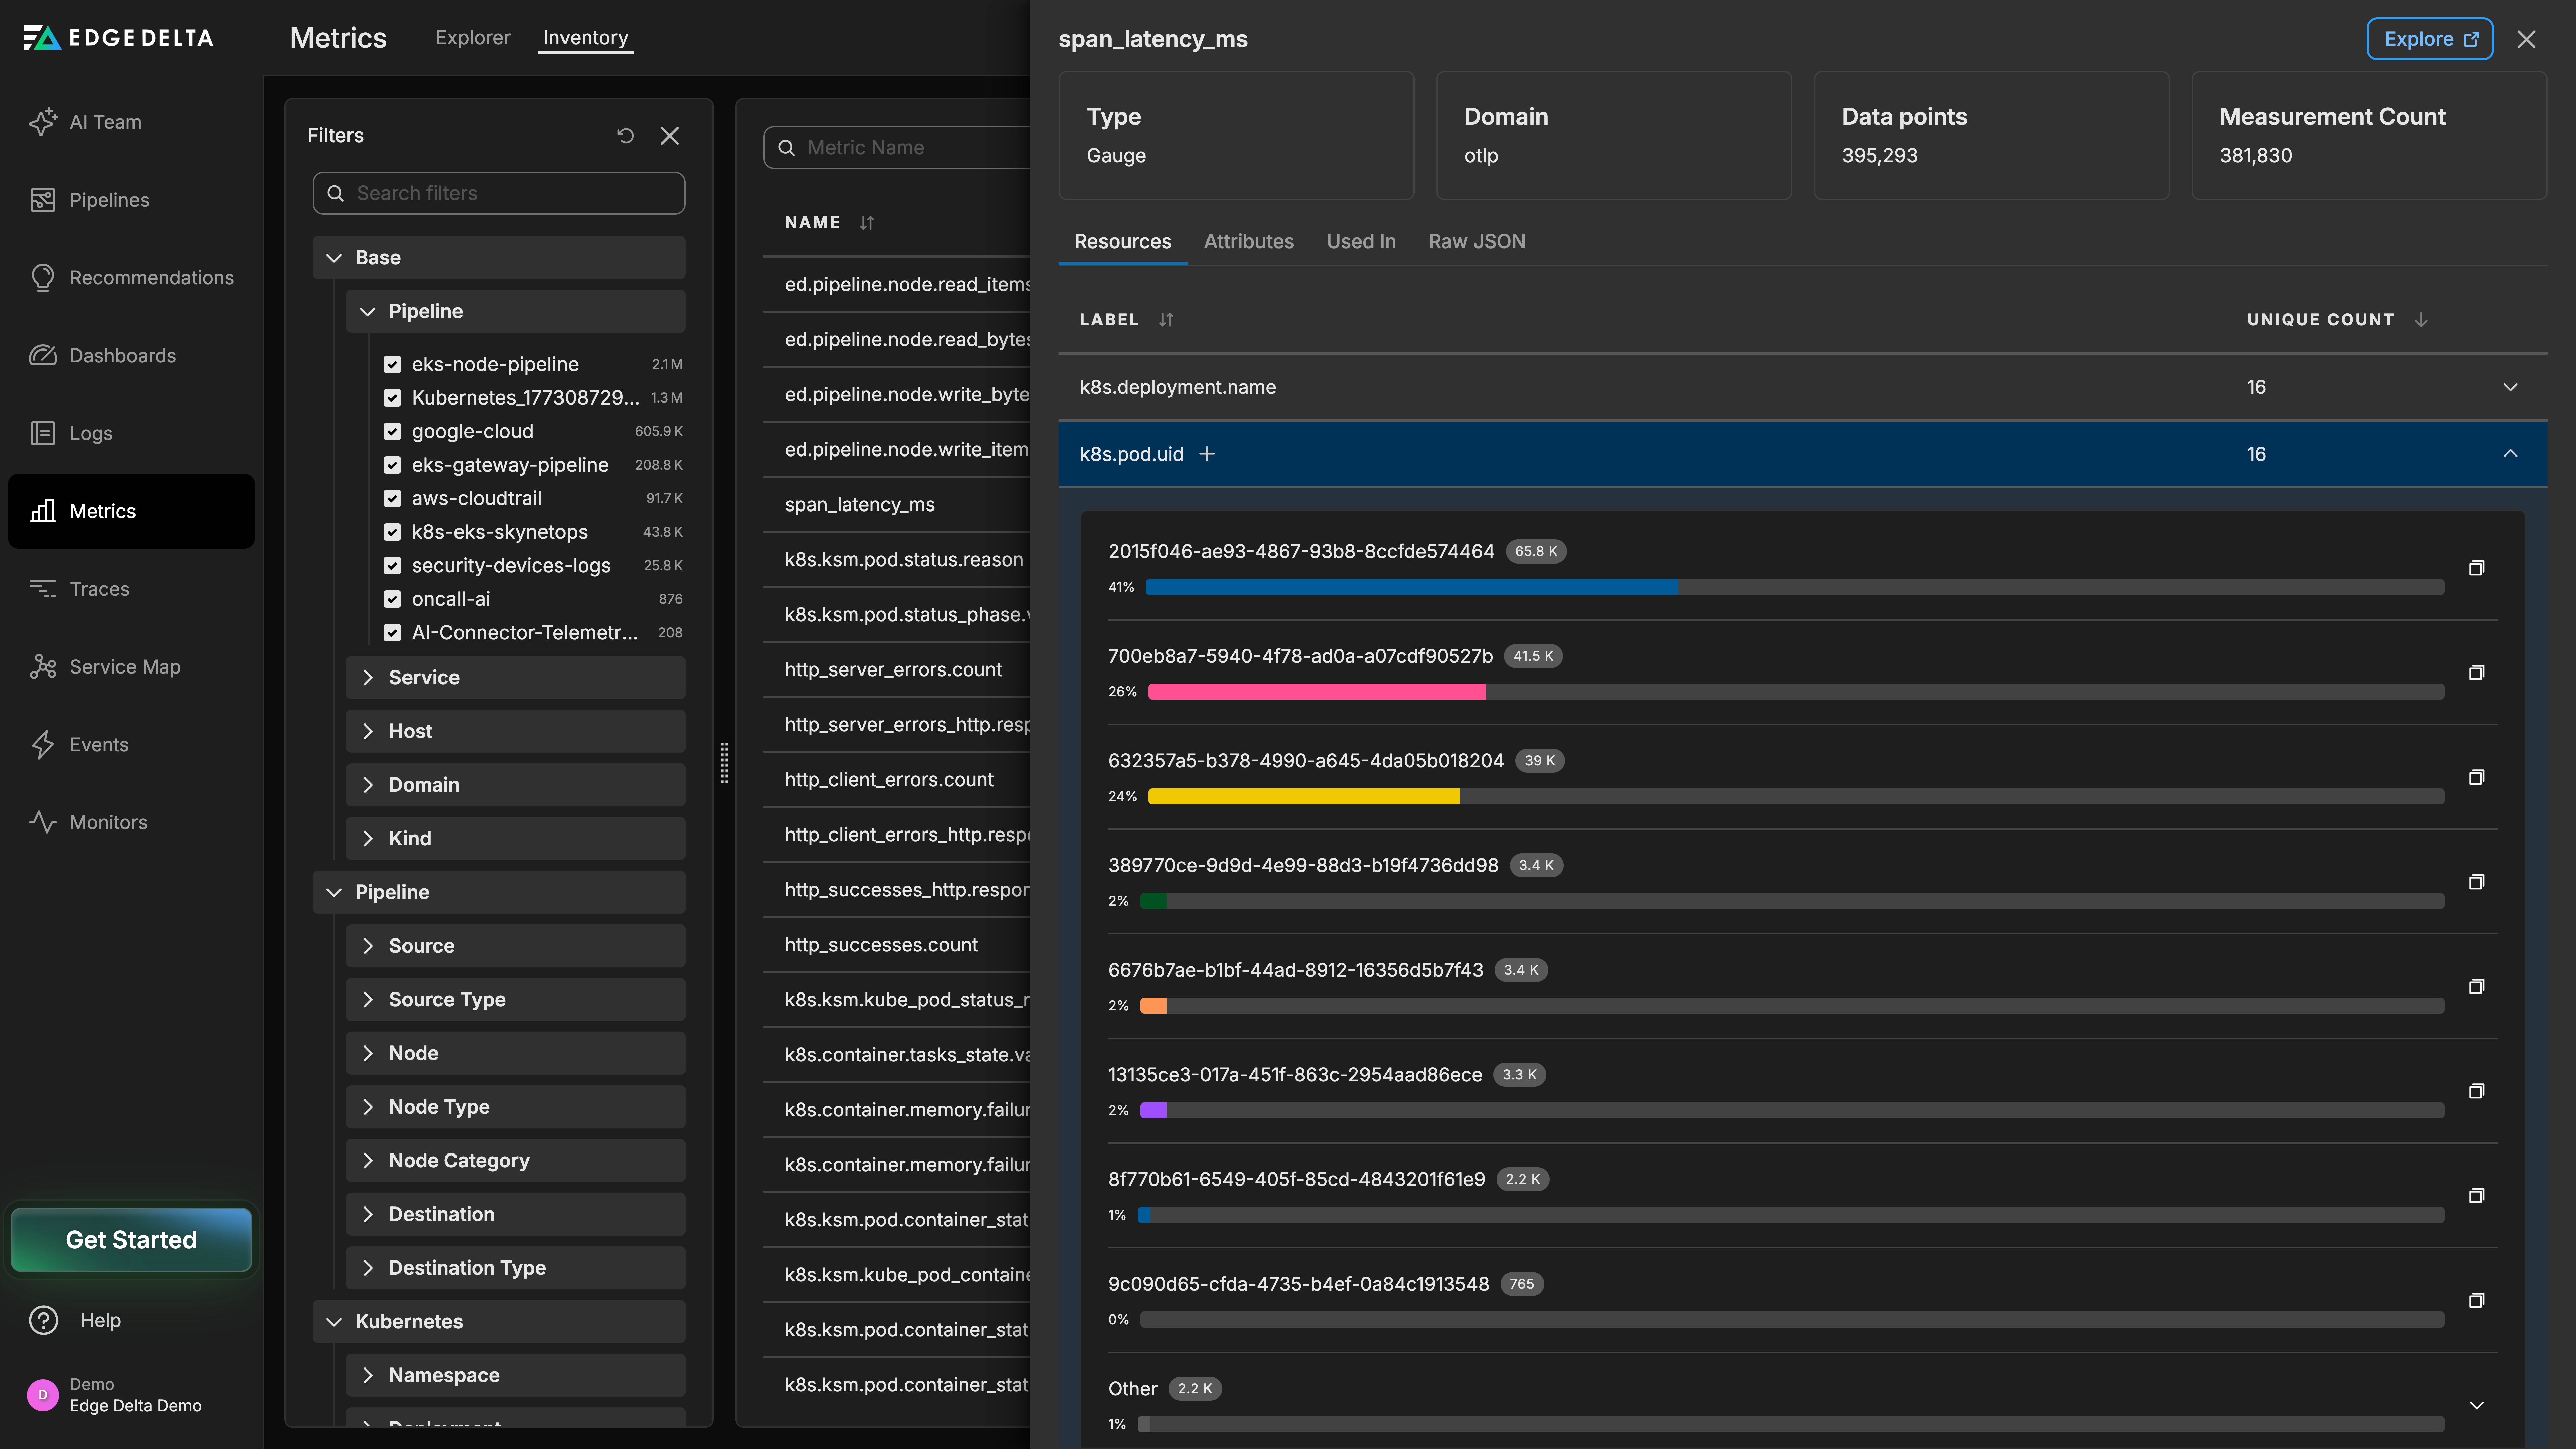
When an incident fires, the AI SRE Teammate queries metric history directly, correlates spikes across services, and attaches a recommended fix before the first engineer joins the call.
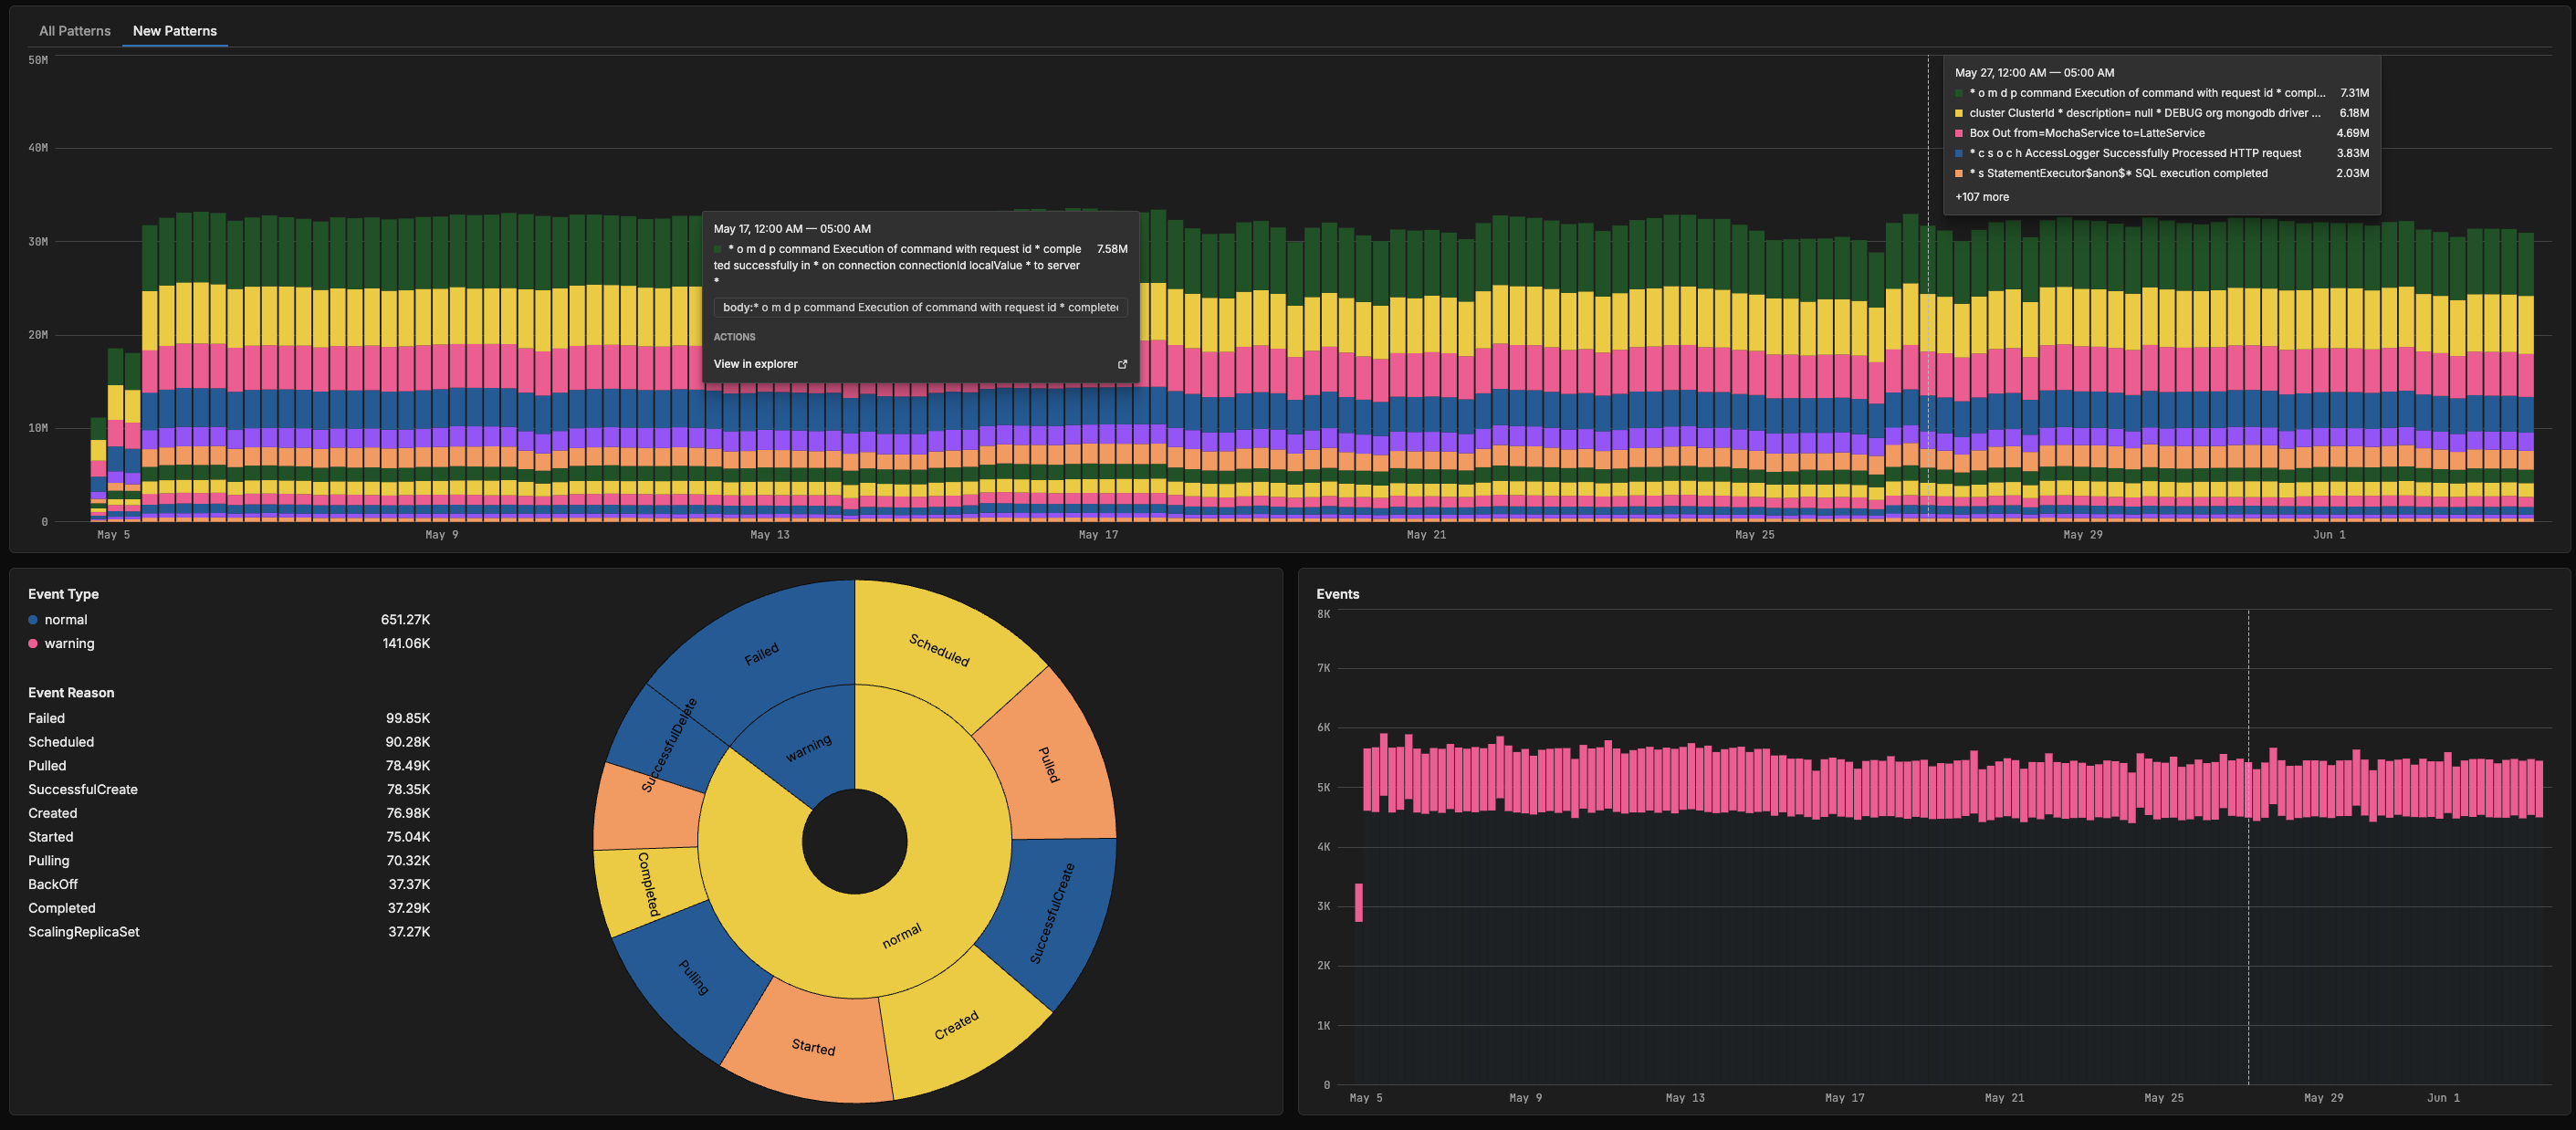
Anomalies caught before anyone wakes up.
Edge Delta monitors your metric streams around the clock, grouping correlated signals into incidents. By the time an engineer sees it, the noise is filtered and AI Teammates have already started investigating.

Put AI Teammates on your metrics
Connect in minutes. Anomaly detection runs immediately. AI Teammates start investigating the moment something spikes.
Join Engineering Teams That Are Embracing AI
It only takes a couple of minutes to start running AI Teammates in production.