
We think buyers should be able to check performance numbers themselves, so today we are publishing the Pipeline Performance Bench: an open benchmark that runs every day, measures logs, metrics and traces, and publishes every raw measurement. You can explore the live results and read or rerun the code on GitHub.
The first results also introduce the agent that now runs our pipelines. We rebuilt the Edge Delta agent in Rust, and in the run of 12 November 2026 it led every agent we tested on logs, traces and metric processing:
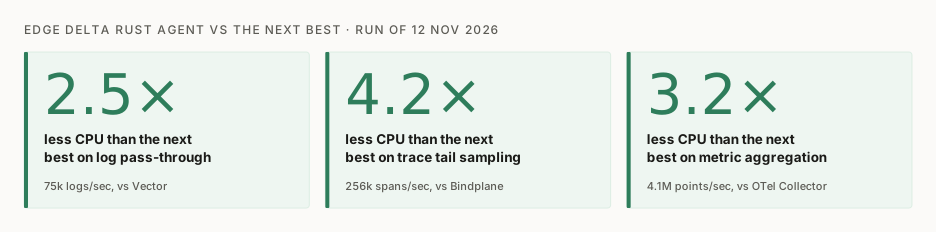
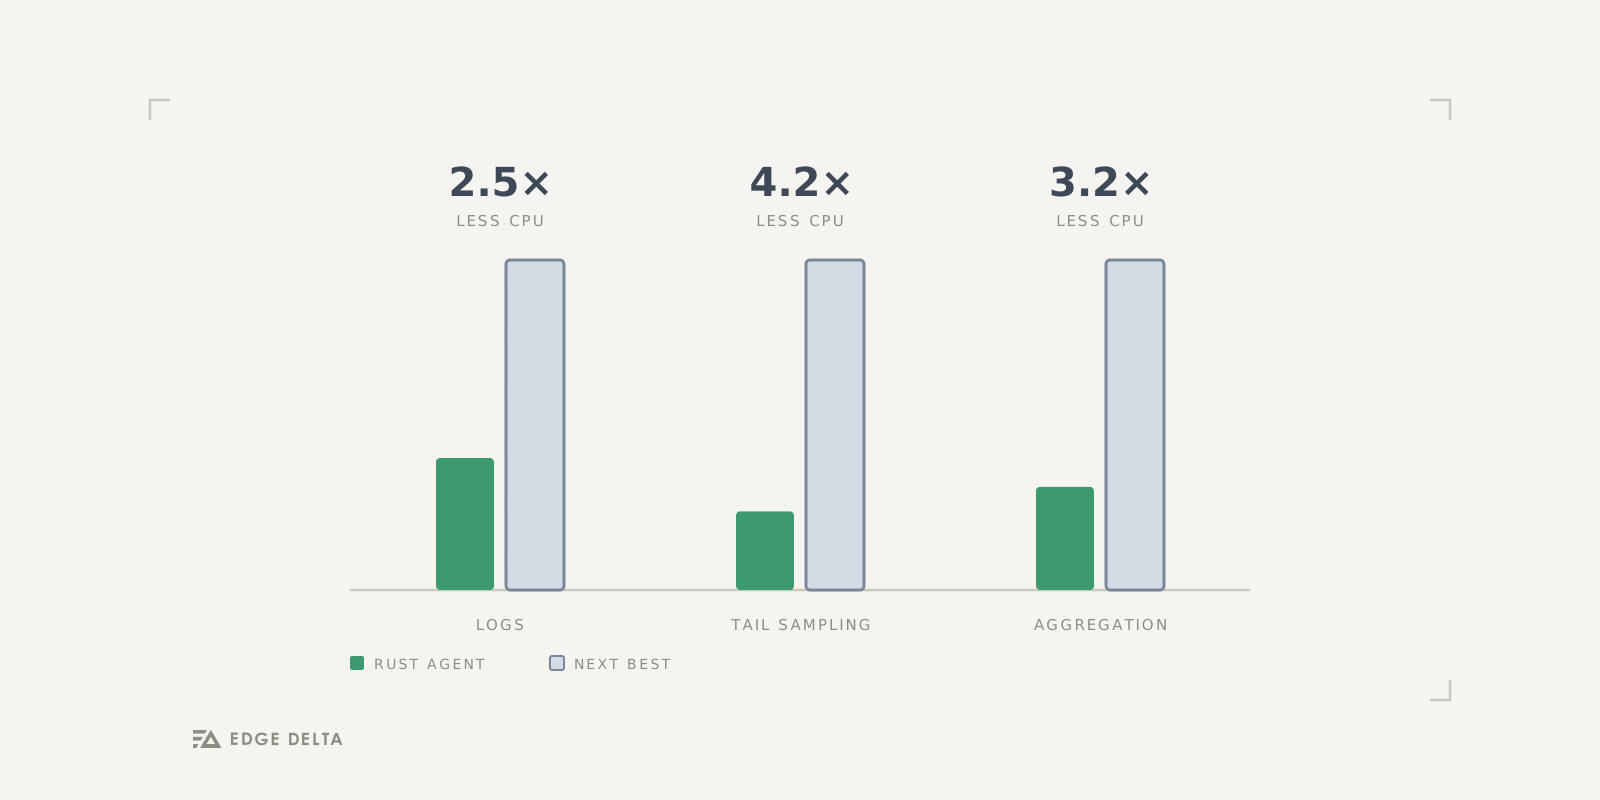
- Up to 2.5× less CPU than the next best agent on logs. At 75,000 logs per second, the Rust agent beats Vector, the next most efficient agent, by 1.6 to 2.5× on CPU and 1.7 to 1.9× on memory in all four pipelines.
- 2.4× more logs per core than the next best. At 125,000 logs per second on Pass-Through, the Rust agent processes 64,318 logs per second per core. Vector, the next best, processes 26,499.
- 4.2× less CPU than the next best on trace tail sampling. At 256,000 spans per second, tail sampling takes the Rust agent 0.68 cores and 1.6 GB. Bindplane, the next best, needs 2.83 cores and 3.5 GB. The Rust agent also uses the least CPU in every other trace pipeline, 1.4 to 2.0× less than the next best.
- 3.2× less CPU than the next best on metric aggregation. At 4.1 million points per second, the Rust agent aggregates on 4.08 cores. The OpenTelemetry Collector, the next best, needs 13.17.
There is one place where the Rust agent does not lead: forwarding metrics without processing them costs about the same for all three agents tested. We cover that below.
The rest of this post covers how the benchmark works, what each signal showed, where the Rust agent does not win, and the limits of what we measured.
Why the pipeline agent matters
A pipeline agent is a guest on someone else’s machine. Every core and every megabyte it takes is one the customer’s own workload does not get, and at fleet scale that overhead becomes a real line on the cloud bill.
It matters to us for a second reason. Our AI Teammates read production through the telemetry that flows through our pipelines. A cheaper pipeline means teams can afford to keep more of that telemetry flowing, and the teammates see more of production when they investigate.
We chose Rust because it has no garbage collector and gives precise control over allocation and data layout. That control is what lets an agent do heavy processing such as masking, sampling and aggregation on a small, predictable footprint.
Shipping a rewrite without breaking production
A rewrite of an agent that runs in customer production must not drop data and must not fall over. We used four safety nets.
- Unit tests. Our existing unit tests define correct behavior, and we held the Rust agent to the same results.
- End-to-end tests. Our end-to-end suite sends data through complete pipelines and checks what comes out the other side.
- Dogfooding. We run the Rust agent on our own telemetry, because real traffic finds problems that synthetic tests miss.
- Design partners. A group of customers ran the Rust agent on their own pipelines and told us early when something looked wrong. We are grateful for their help.
How the benchmark works
The Pipeline Performance Bench runs every day at 09:17 UTC. Each run installs fresh agents from their current release channels, records the exact version of each one, and publishes a dated release with the report, the raw measurements, the configurations and checksums.
Every agent runs on its own AWS c8i.2xlarge instance (8 vCPUs, 16 GiB) at the same time, with identical inputs. Instead of reporting one “maximum throughput” number, the benchmark offers a ladder of fixed loads and measures what each agent spends at each load. At a fixed load every agent does the same work, so the CPU and memory numbers compare directly. An agent passes a load only if it takes in at least 98% of what was offered with no unrecovered errors.
| Signal | Input | Loads | Pipelines | Agents |
|---|---|---|---|---|
| Logs | JSON over HTTP, one log per request, 256 workers | 10k, 25k, 50k, 75k, 125k logs/sec | Pass-Through, Filter, Mask, Lookup | Edge Delta Rust, Vector, OpenTelemetry Collector, Bindplane, Cribl, Fluentd, Fluent Bit |
| Metrics | OTLP/gRPC, 512 points per request | 1k, 2k, 4k, 8k requests/sec | Pass-Through, Filter, Aggregate, Rollup, Aggregate + Rollup | Edge Delta Rust, OpenTelemetry Collector, Bindplane |
| Traces | OTLP/gRPC, 512 spans per request | 100, 200, 300, 500 requests/sec | Pass-Through, Filter, Mask, Probabilistic sampling, Tail sampling | Edge Delta Rust, OpenTelemetry Collector, Bindplane |
For metrics and traces, the load generator and the destination run on their own hosts, and the destination checks that the output is correct: counts and values for metrics, trace identities and parent links for traces, and that only traces with errors survive tail sampling.
Logs: up to 2.5× less CPU than the next best
75,000 logs per second is the highest load at which both the Rust agent and Vector, the next most efficient agent, pass all four pipelines, so it gives the cleanest comparison.
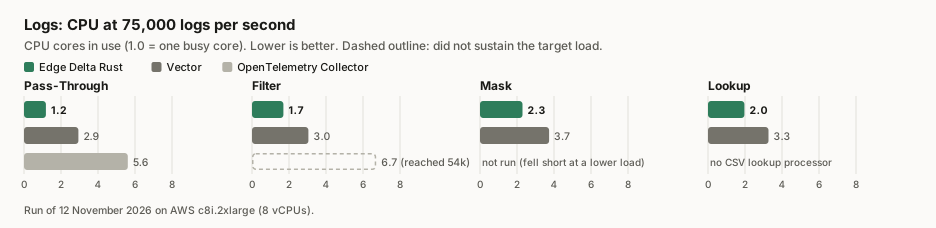
| Pipeline | Rust agent | Vector (next best) | Less CPU | Less memory |
|---|---|---|---|---|
| Pass-Through | 1.18 cores, 54 MB | 2.94 cores, 103 MB | 2.5× | 1.9× |
| Filter | 1.70 cores, 53 MB | 3.05 cores, 101 MB | 1.8× | 1.9× |
| Mask | 2.30 cores, 53 MB | 3.74 cores, 99 MB | 1.6× | 1.9× |
| Lookup | 1.97 cores, 63 MB | 3.27 cores, 105 MB | 1.7× | 1.7× |
The OpenTelemetry Collector sustains Pass-Through at this load on 5.61 cores, 4.7× what the Rust agent uses. It falls short on Filter, and it was not run at this load on Mask after falling short at a lower one.
At 125,000 logs per second, the Rust agent and Vector are the only agents that pass all four pipelines. On Pass-Through at that load, the Rust agent processes 64,318 logs per second per core, against 26,499 for Vector.
The gap also holds from day to day. Across 13 daily runs between 15 October and 12 November, the Rust agent used 1.5 to 2.6× less CPU than Vector at 75,000 logs per second in every pipeline.
Traces: a quarter of the CPU on tail sampling
At 500 requests per second of 512 spans each, or 256,000 spans per second, all three agents sustain every trace pipeline. The difference is what they spend to do it.
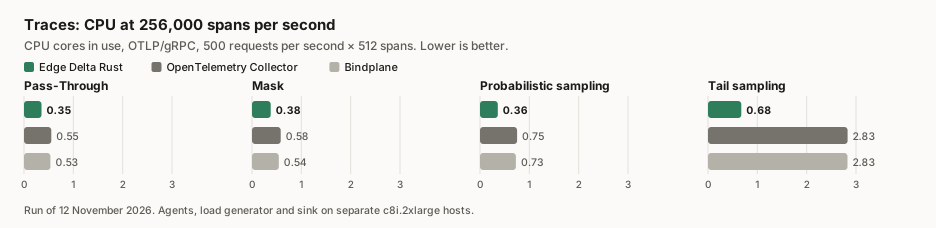
On Pass-Through, Filter and Mask, the Rust agent uses 1.4 to 1.7× less CPU than the OpenTelemetry Collector and Bindplane, and about a third of their memory (83 MB against 241 to 242 MB on Pass-Through). On probabilistic sampling it uses half the CPU.
Tail sampling shows the largest gap. The agent has to hold every span of a trace until it can decide whether the trace contains an error. The Rust agent does that on 0.68 cores and 1.6 GB. The OpenTelemetry Collector and Bindplane each use 2.83 cores and 3.5 to 3.6 GB. Across 24 daily runs since 19 October, the Rust agent used 3.7 to 4.7× less CPU on tail sampling than either.
Metrics: the same cost to forward, a third of the cost to aggregate
At 8,000 requests per second of 512 points each, or about 4.1 million points per second, the results split by the kind of work.
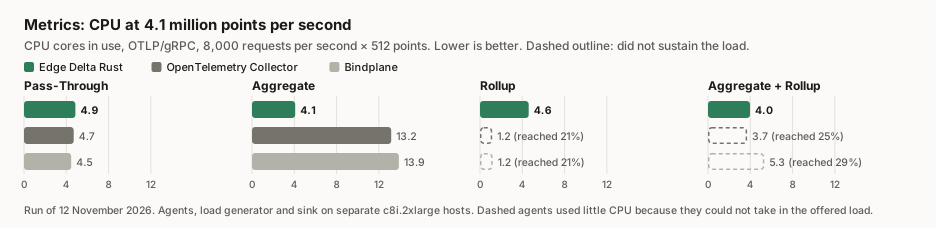
Forwarding costs about the same. On Pass-Through the Rust agent used 4.86 cores, the OpenTelemetry Collector 4.70 and Bindplane 4.47. Across 24 daily runs, the Rust agent ranged from 9% more CPU to 33% less than the others, so we call this a tie. The Rust agent used less memory (247 MB against 286 and 322 MB). Making metric pass-through cheaper is on our list.
Aggregating costs a third. Summing points across host labels, the Rust agent used 4.08 cores against 13.17 for the OpenTelemetry Collector and 13.89 for Bindplane, so 3.2 to 3.4× less CPU. Across 24 runs the range was 3.2 to 4.3×.
Only the Rust agent sustained rollups. Rollup combines points into 60-second intervals. The Rust agent sustained the full 8,000 requests per second on Rollup and on Aggregate + Rollup, using about 4 to 4.6 cores. The OpenTelemetry Collector fell short on Rollup from 2,000 requests per second, and Bindplane from 4,000. On Aggregate + Rollup, both fell short from 4,000. Neither sustained Rollup or Aggregate + Rollup at 8,000 requests per second in any of the 24 daily runs.
The open benchmark
Everything above comes from one benchmark that anyone can inspect and rerun:
- Interactive results for logs, metrics and traces. Pick a load and a metric, or switch to Trend to see the daily history.
- The code, including the load generators, every agent’s configuration and the scoring, in the pipeline-performance-bench repository.
- A dated release for every complete run, with the report, raw measurements and checksums. Shortfalls stay visible in the data and are never reported as zero.
We use the same rules for every agent. If you think we configured your favorite pipeline unfairly, open an issue or a pull request in the repository. We would rather fix a configuration than win on a bad one.
The fine print
- These numbers apply to these workloads on this instance type. Different pipelines, payload sizes and hardware will give different numbers.
- For logs, the load generator shares the instance with the agent under test, and the benchmark measures logs accepted over HTTP rather than delivery to the final destination. Some shortfalls at the highest loads, including the OpenTelemetry Collector on Filter at 75,000 logs per second, are flagged in the report as possibly limited by the shared generator.
- Each agent implements rollup with its own native interval behavior, so output point counts can differ. The benchmark requires grouped sums to survive and the output to be reduced, and it measures what each implementation costs.
- Metrics and traces compare the Rust agent with the OpenTelemetry Collector and Bindplane. We are working on adding more agents to those signals.
- The metrics and traces runs use a release candidate of the Rust agent (3.15.2-rc.68). The logs run uses 3.15.2.
Where we are today
The Rust agent now runs our pipelines, and we are still expanding its input and output coverage.
In short: against the next best agent, log pipelines run on up to 2.5× less CPU, trace tail sampling costs a quarter of the CPU, and metric aggregation costs a third. Telemetry pipelines are free on Edge Delta at any scale, so these savings go straight to the hardware you run them on.
To check these numbers yourself, browse the interactive results or clone the benchmark repository. If you want to see what the Rust agent does with your own workload, talk to us.