
When a page feels slow, the useful question is which part is slow, where, and why, and that’s hard to answer when browser data and backend data live in separate tools: a RUM product for sessions and page speed, a tracing tool for backend requests, and a person in the middle matching timestamps by hand to guess whether the two tools are even looking at the same request.
We built RUM into our existing product instead, so the two were never separate to begin with, and a page load and the backend request it triggered land in the same trace store, correlated automatically the moment either one happens. We wrote a small browser script that turns browser events into that same trace and log data, pointed it at the ingestion endpoint our agents already use, and what follows covers how that correlation works, then walks through a real debugging session where a slow page and the backend request behind it turned up in the same query.
The pipeline already did the hard part
When we started, the pipeline had already done most of the work: our ingestion endpoint accepted OTLP over HTTP, the OpenTelemetry wire format for logs, metrics, and traces, validated tokens, and applied rate limits, and the Traces Explorer drew each operation as a waterfall of timed steps, what OpenTelemetry calls spans.
So the browser script did not need its own backend, only to translate browser events into the shapes the pipeline already understood: a page load or a route change becomes a span, the page speed scores become attributes on that span, LCP for how long the main content takes to appear, CLS for how much the layout shifts while loading, INP for how quickly the page responds to a click, and a JavaScript error becomes a log record with its stack trace attached. The script itself stays around 10 kB gzipped, with Google’s web-vitals library as its one dependency, and it works back to Safari 14, Chrome 80, Firefox 78, and Edge 88.
Two benefits of reusing the endpoint
Sending browser data through the same ingestion endpoint as everything else means our existing processing rules apply to page views with no RUM-specific code: the Mask PII processor already strips personal data before storage, and pointed at browser traffic it strips the browser version out of the user agent string before a page view is ever written to disk.
before  Mozilla/5.0 (Macintosh; Intel Mac OS X 10_15_7) AppleWebKit/605.1.15 Chrome/128.0.6613.137
after   Mozilla/5.0 (Macintosh; Intel Mac OS X 10_15_7) AppleWebKit/605.1.15 Chrome/***.*.***
It also means every feature that reads the trace and log stores keeps working without any changes: the Traces Explorer shows a page load next to the backend request it triggered, dashboards chart 75th percentile LCP by route, monitors alert on browser errors for a single route, and AI teammates pull up browser errors while they’re investigating an incident, which is how the only new code, in the end, turned out to be the browser script itself and one origin check on the ingest side.
What gets captured
- Core Web Vitals: LCP, CLS, and INP, captured per page view and rated good, needs improvement, or poor, the same thresholds Chrome uses.
- Page loads and routes: every page load and client-side route change becomes a span, so navigation timing sits next to everything else in the trace store.
- Request timings:
fetchandXMLHttpRequestcalls are timed and recorded as child spans of the page view that triggered them. - Errors, with context: JavaScript errors land as log records with stack traces, plus the last 20 breadcrumbs: clicks, fetches, console errors.
The part that matters: one trace, two runtimes
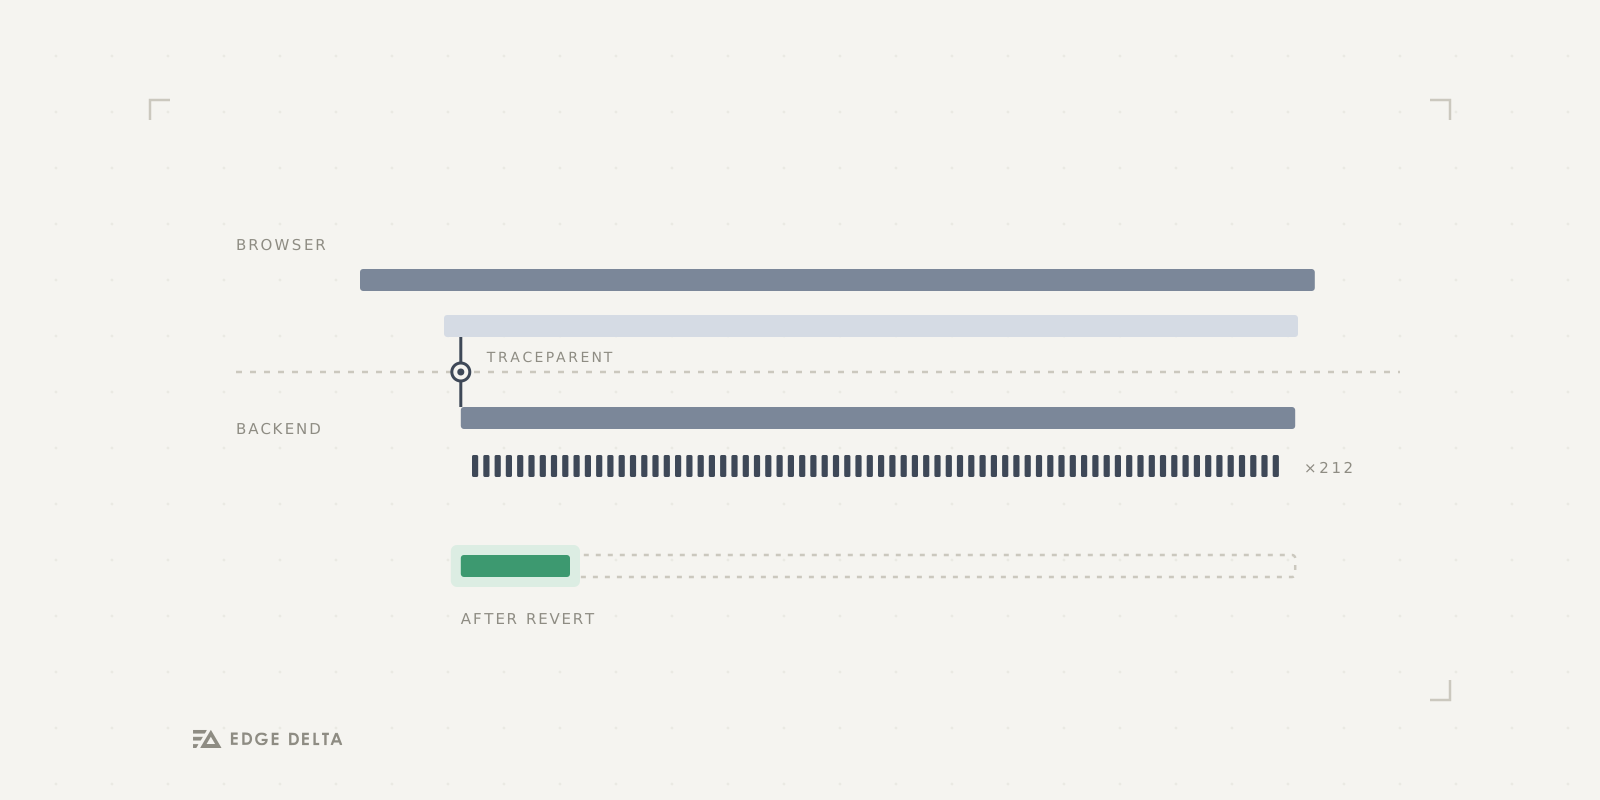
Metrics on their own can tell you a page is slow, and the traceparent header is what tells you why: the script attaches a W3C traceparent header to same-origin requests automatically, and to cross-origin requests once the target is allowlisted, since browsers block the header on cross-origin CORS preflight unless the server expects it, and that header is what turns a browser span and a backend span into one trace, so clicking into a slow page load brings the backend request it triggered along with it, instead of a separate lookup in a separate tool.
A few smaller decisions make that data usable at scale rather than just present: every page view in a session carries a shared session.id, routes are recorded as patterns, /orgs/$orgId/logs rather than the literal org ID, so a thousand different customers hitting the same page aggregate into one row instead of a thousand, sampling decisions are written to sessionStorage so a session doesn’t get split across sampled and unsampled halves, and a /react entry point wires straight into React error boundaries so component-level crashes get the same treatment as everything else.
Chasing a regression, from browser to backend
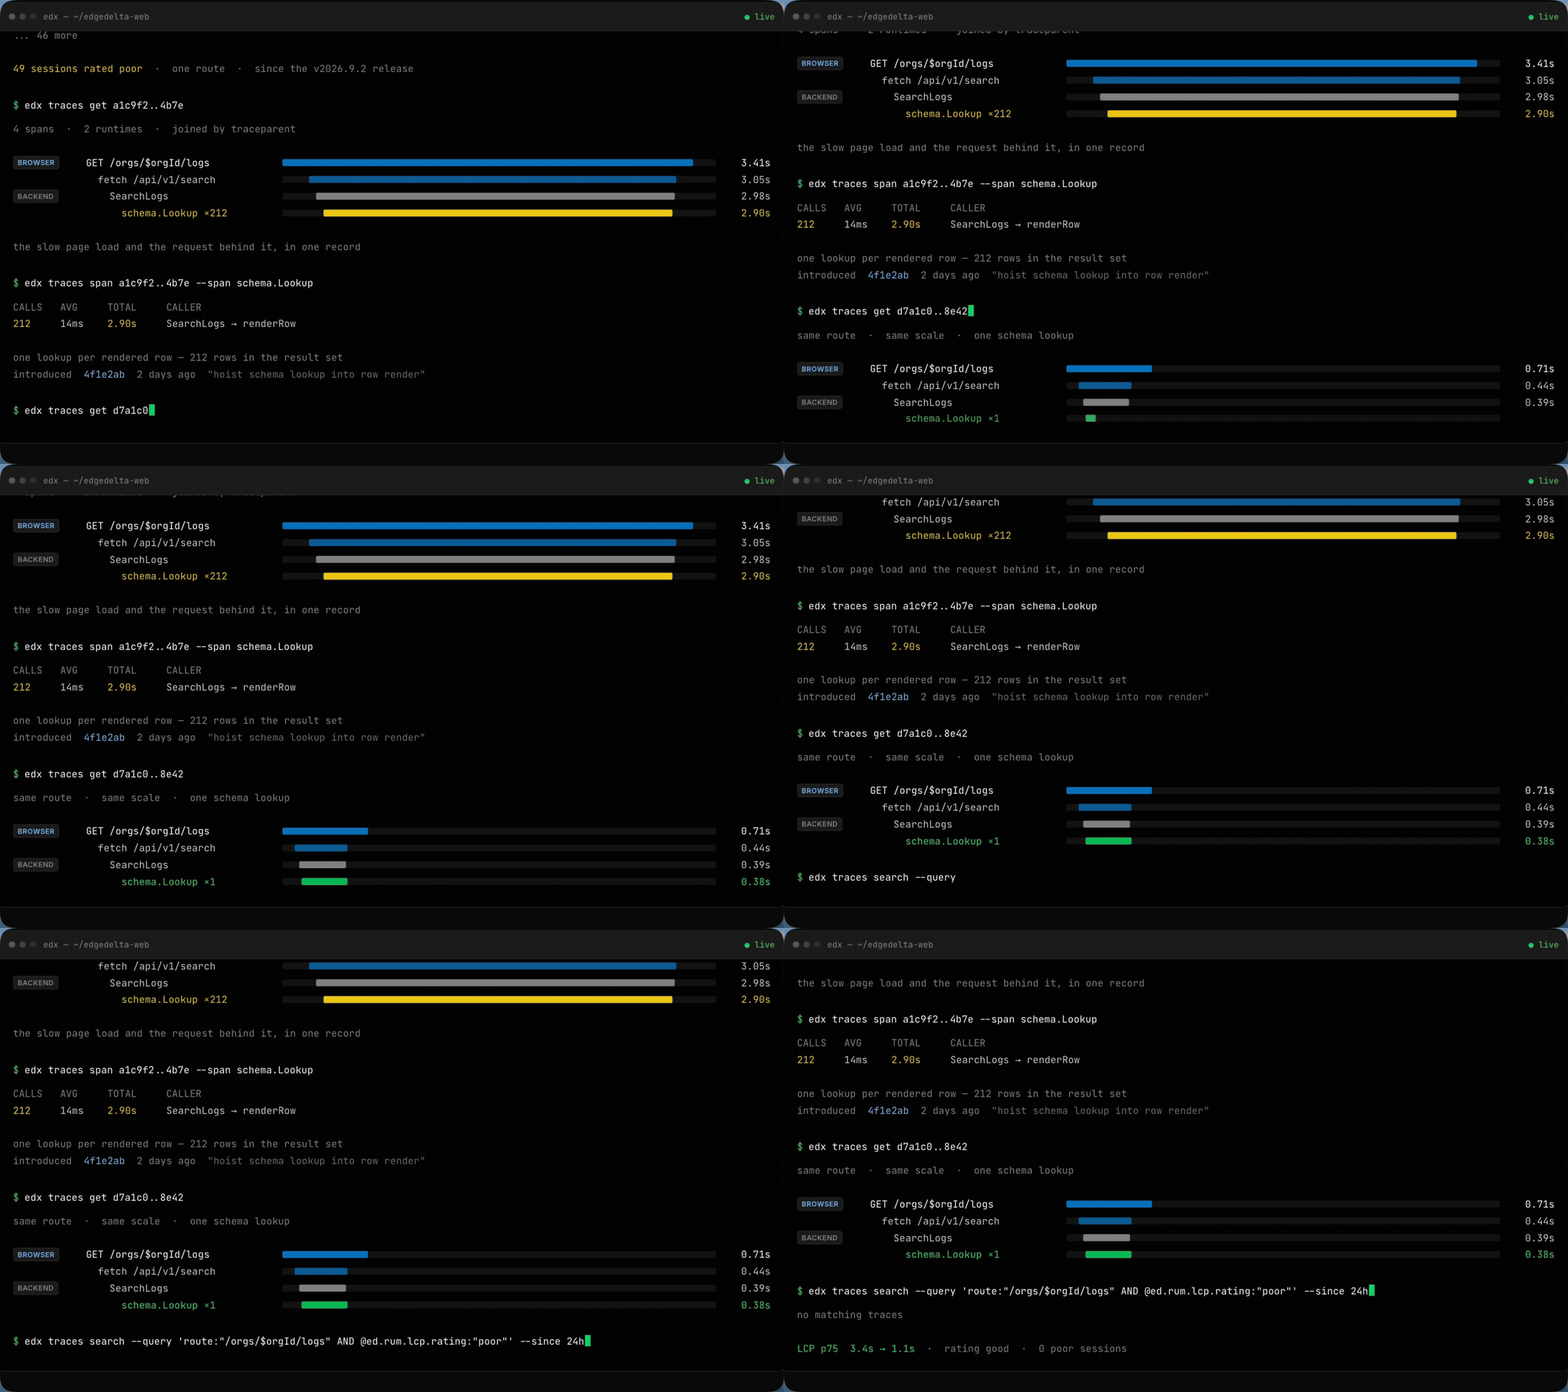
Here’s the kind of session this setup is for. Say LCP on /orgs/$orgId/logs, our log search screen, drifts from good into poor for a slice of sessions after a release. The first signal is just a query run against the same store everything else lives in:
$ edx traces search --query 'service.name:"edgedelta-web" AND route:"/orgs/$orgId/logs" AND @ed.rum.lcp.rating:"poor"' --since 2h

TRACE ID        LCP    SESSION
a1c9f2..4b7e    3.4s   8f2ec9..91a4
b370de..19a2    3.6s   1a9d44..f072
c94b81..05f3    3.2s   77b3e0..2c9d
... 46 more
Forty-nine sessions on that one route come back rated poor, and pulling any single one of those traces brings the backend request along with it, joined by the traceparent header from the moment it left the browser, so there’s no second tool to open and no timestamps to line up by hand:
$ edx traces get a1c9f2..4b7e

GET /orgs/$orgId/logs              3.41s
  fetch /api/v1/search             3.05s
    SearchLogs                     2.98s
      schema.Lookup x212           2.90s
The page load span comes in at 3.41s, almost all of it sitting inside SearchLogs, the handler behind /api/v1/search, and expanding that span shows why: the schema service gets called 212 times, one per row in the result set, at 14ms apiece for 2.9s total. Attributing that span points straight at a two-day-old commit, 4f1e2ab, “hoist schema lookup into row render”, the kind of change that reads fine in a diff:
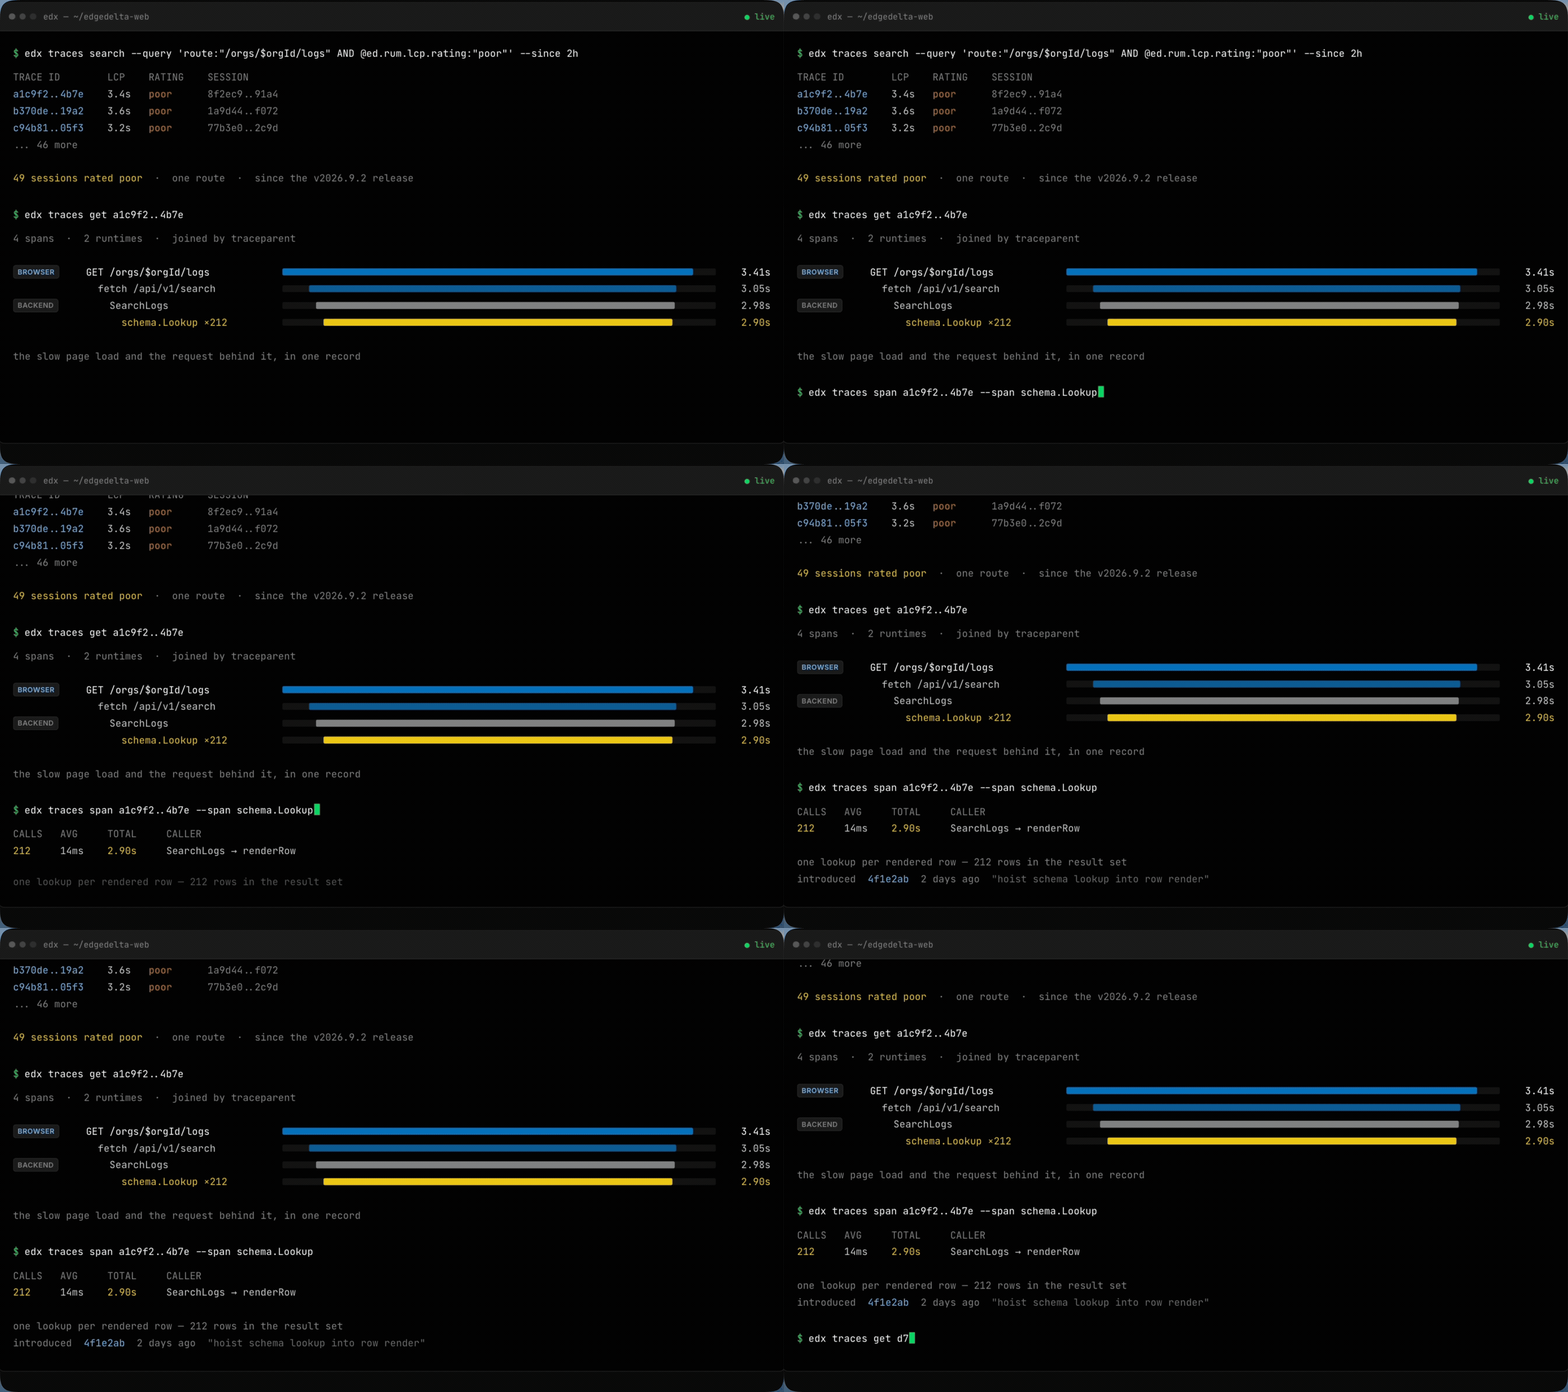
Reverting that one line drops SearchLogs back to 390ms, with a single schema.Lookup call at 380ms, and running the same edx traces search query against the last 24 hours confirms it: no matching traces, p75 LCP back to 1.1s, rated good, zero poor sessions on that route.
Conclusion
A JavaScript error, a slow page load, and the backend request behind it now show up as the same kind of record, in the same store, queryable with the same tool we use for everything else, so debugging a frontend regression stops being a separate skill from debugging a backend one, and every dashboard, monitor, and AI teammate we already had gets browser visibility for free, on day one, with nothing new to learn and no second place to go looking when a page feels slow.
AI Teammates investigate incidents from a JavaScript error or a slow page load through the exact backend request that caused it. Visit edgedelta.com to start a free trial and point it at your own frontend and backend.