
Every combination of metric name and labels creates a time series. Add services, routes, and pod names, and the number of series grows fast. This number is called cardinality.
Many dashboards need totals by service or route. They do not need a separate series for every pod. Edge Delta can combine those series before they reach storage. The pipeline must use the right operation for each metric type to keep the values useful.
We tested this with 100 synthetic services and Edge Delta’s Rust agent running as a gateway pipeline on Kubernetes: eight pods with 4 CPU each on four nodes. A one-hour Prometheus remote write test accepted 3.6 billion points at 999,977 points per second, with zero failed input points. The processed metrics went through the Edge Delta destination into Edge Delta metric storage, where all 500 stored totals we checked matched the values we sent.
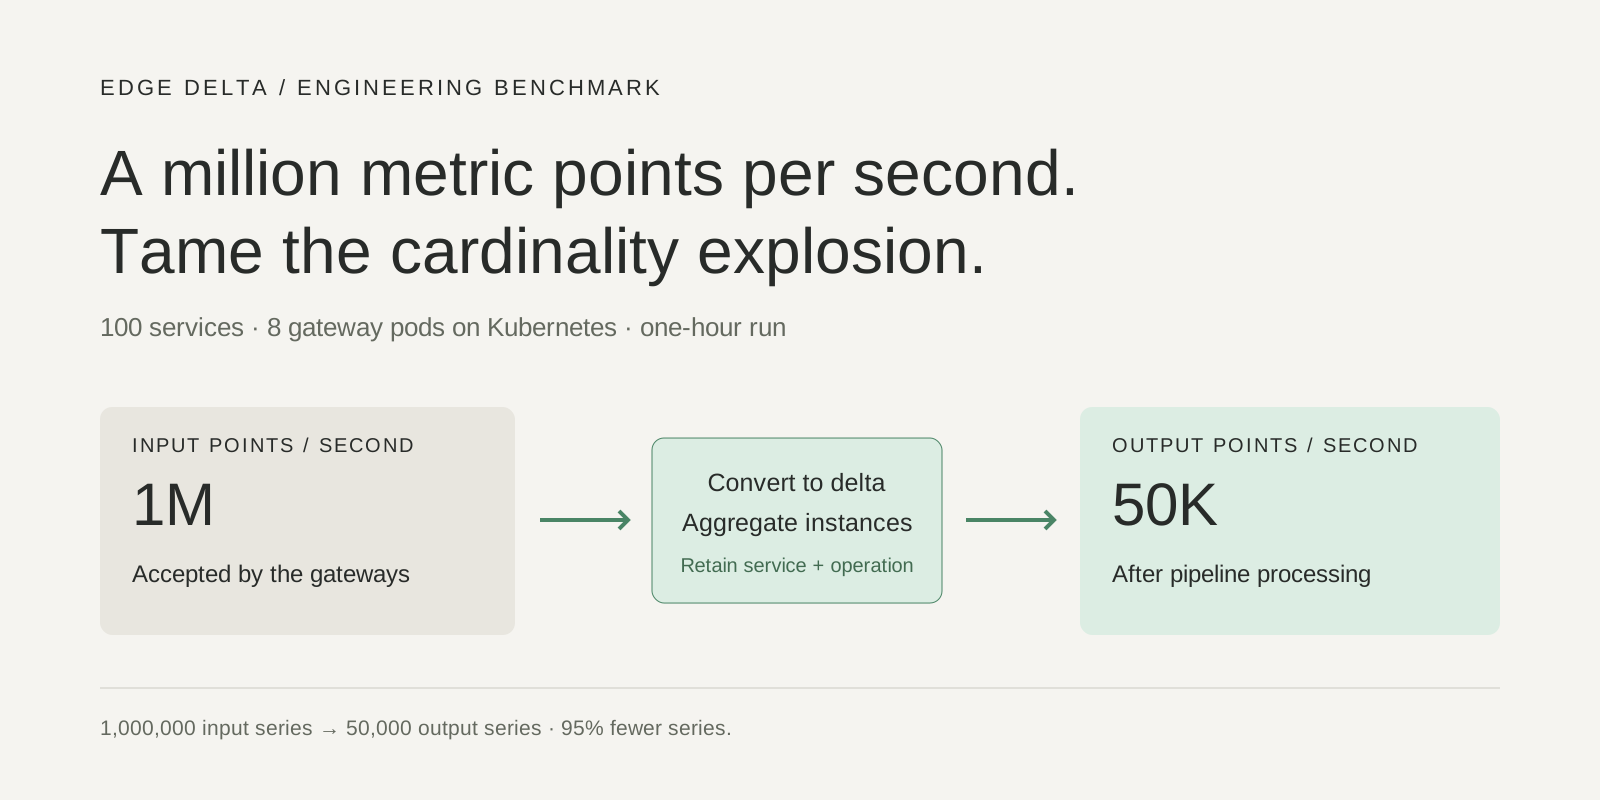
The pipeline combined 20 instances into one series per service and operation, so 1,000,000 input series became 50,000 output series, a 95% reduction. The eight gateway pods used an average of 22.7 vCPUs over the hour, and their memory stayed flat at about 4.2 GiB in total.
These results apply to the workload and the fixed deployment described below.
Create data with known values
We created 100 services in five groups: API, checkout, payments, search, and worker. Each service had its own identity. Services in the same group used the same metric names.
Each service sent ten counters, ten gauges, and one classic histogram. The histogram had three bucket series, a sum, and a count. This gave us 25 metric components per operation and instance:
100 services × 25 components × 20 operations × 20 instances
= 1,000,000 active input series

1 update per series per second
= 1,000,000 input points per second
The five service groups used 115 metric names in total. Labels created the large number of series.
This example shows a request counter in Prometheus text format. The generator sent the actual data as protobuf:
redbench_api_requests_total{
  service_name="svc-000",
  route="operation-001",
  instance="pod-0000",
  status_class="2xx",
  bench_run="example-run",
  protocol="prometheus"
} 100
Each update increased the counter by the instance index plus one. Across twenty instances, the expected increase was:
1 + 2 + ... + 20 = 210 requests per updateA queue-depth gauge used values from 1100 to 1119. Its expected average was 1109.5. These known values let us check the output after the pipeline combined the series.
Convert counters, then combine series
A cumulative counter holds a running total. The cumulative_to_delta processor subtracts its previous value to find the change since the last sample. The processor must do this for each original series before the pipeline removes the instance label.

The pipeline converts cumulative values before it combines instances. Gauges and metrics that already contain deltas skip conversion.
We copied service_name to resource["service.name"], route to resource["http.route"], and instance to resource["service.instance.id"], then deleted the original labels. The converter keeps its state per resource, so every instance kept its own running total until the aggregation step removed it. We used host.name as a shared test-run label. A different hostname for each instance would keep those series separate.
This condition sent cumulative sums and histograms to the converter:
(kind == "sum" and sum["aggregation_temporality"] == "cumulative")
or
(kind == "histogram" and histogram["aggregation_temporality"] == "cumulative")
Next, aggregate_metric combined values in one-second windows. This configuration excerpt shows the sum rule:
- type: aggregate_metric
  aggregate_metric_rules:
    - conditions:
        - 'kind == "sum" or kind == "histogram"'
      interval: 1s
      aggregation_type: sum
      keep_only_group_by_keys: true
      group_by:
        - 'resource["service.name"]'
        - 'resource["host.name"]'
        - 'resource["region"]'
        - 'resource["http.route"]'
        - 'attributes["status_class"]'
        - 'attributes["le"]'
        - 'attributes["protocol"]'
A second rule used aggregation_type: mean for gauges, with the same labels. An average matched the values in our test. Choose the operation for each real metric: queued work may need a sum, while peak use may need a maximum.
Histograms need matching bucket layouts. We kept the le label so classic histogram buckets remained separate.
The request counter then had this form:
metric: redbench_api_requests_total
kind: sum
aggregation_temporality: delta
resource:
  service.name: svc-000
  host.name: example-run
  region: us-west-2
  http.route: operation-001
attributes:
  status_class: 2xx
  protocol: prometheus
value: 210
The output keeps service, operation, status class, and protocol. It removes instance identity. You can query totals by service and operation, but you cannot use this output to inspect a single pod.
Deploy eight gateway pods on Kubernetes
We ran Rust agent 3.15.0 as an Edge Delta gateway pipeline on an EKS cluster in AWS us-west-2. We created the pipeline with the edx CLI and installed it with the Helm command the platform generates for it. The pods fetched their configuration from Edge Delta. We made no changes to the agent code.

| Role | Nodes | Instance type | Resources per node | Pods |
|---|---|---|---|---|
| Metric gateways | 4 | m6a.4xlarge | 16 vCPU, 64 GiB RAM | 2 gateway pods per node, 4 CPU and 8 GiB each |
| Load generator | 2 | m6a.4xlarge | 16 vCPU, 64 GiB RAM | 1 generator pod per node, 50 services each |
Each service sent its data to one fixed pod, chosen by service index modulo eight. Each pod handled 12 or 13 services and kept the counter state for them. We set the inputs’ max_connection_age to 24h so the pods did not close connections during a run.
Prometheus remote write 1.0 used Snappy-compressed protobuf requests of 2,000 points. OTLP gRPC grouped points by metric name, used gzip, and also sent 2,000 points per request. The Edge Delta destination flushed every second with a 4 MB batch limit and eight upload workers per pod. The generator had no retries, so a failed request counted as lost points.
Measure rate, delay, CPU, and memory
The generator waited for all scheduled requests to finish. We calculated the rate from accepted points and actual elapsed time, including the last requests. All runs in this table had zero failed input points and passed 500 stored-value checks across 100 services.
| Input and run | Duration | Accepted points/s | Request p99 | Gateway vCPU, mean | Gateway RSS, sum of pod peaks |
|---|---|---|---|---|---|
| Prometheus | 600 s | 999,904 | 106 ms | 22.1 | 2.9 GiB |
| OTLP gRPC | 300 s | 999,783 | 98 ms | 19.0 | 3.1 GiB |
| Prometheus, one hour | 3,600 s | 999,977 | 110 ms | 22.7 | 4.6 GiB |
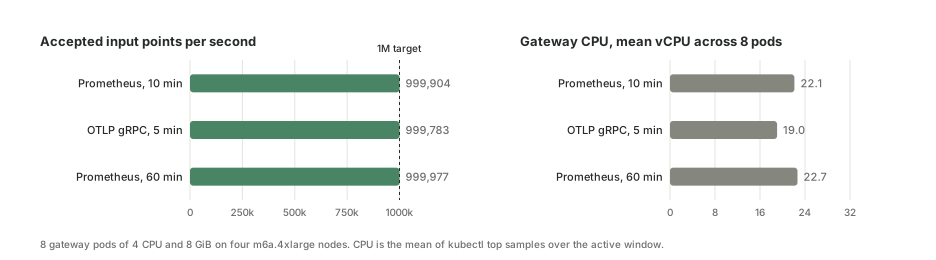
Request p99 is the time within which 99% of input requests completed. It does not measure the time until data becomes visible in storage. RSS is the physical memory used by the gateway pods.
The one-hour run accepted 3,600,000,000 points in 3,600.1 seconds. The gateway input count matched the generator count. CPU in the first and last ten minutes differed by 0.1%, and memory by 18 MiB. The pods used 22.7 of the 32 vCPUs allocated to them. OTLP cost 14% less CPU than remote write for the same points.
We sampled pod CPU and memory every five seconds with kubectl top while the generator sent data. The figures exclude the generator pods and the nodes’ own processes. The memory total adds each pod’s peak, and those peaks may have occurred at different times.
One pod stops near 180,000 points per second
Before the fleet runs, we sent increasing load to a single pod:
| Offered points/s | Accepted points/s | Pod CPU, of 4 cores | Request p99 |
|---|---|---|---|
| 100,000 | 100,000 | 1.3 | 54 ms |
| 200,000 | 178,400 | 2.6 | 409 ms |
| 300,000 | 179,700 | 2.3 | 627 ms |
| 400,000 | 178,900 | 3.3 | 851 ms |
| 500,000 | 178,700 | 3.1 | 1,092 ms |
The accepted rate stops near 180,000 points per second while the pod uses about three of its four cores. For capacity planning, count pods rather than cores. One 4-CPU pod per 125,000 points per second leaves headroom, which is why eight pods carried one million.
Check series counts and stored values
The rule combined twenty instances into each service-operation series:
Before: 100 × 25 × 20 × 20 = 1,000,000 series
After:  100 × 25 × 20      =    50,000 series
Reduction: 95%
The ten-minute Prometheus run sent 29,970,127 points to the output, against 29,970,000 for one point per series per second. The 127 extra points come from updates that arrived after their window had closed; the gateway emits those as a second point for the same second. Captured output samples had no instance labels, delta temporality, and the expected values.
For every service, we checked requests, errors, queue depth, histogram count, and histogram sum in storage. That gave us 500 aggregate checks per run. These checks did not list every stored series. Storage queries can take time to show all data; an immediate query can be incomplete, and a later one passes.
A 95% series reduction does not establish a 95% cost reduction. Storage size, retention, queries, and pricing need separate measurements. The 95% also comes from this workload’s twenty instances per operation. Your reduction equals your own instance fan-in.
Check memory with changing series
The converter keeps a previous value for every series it has seen. We measured what that costs with three consecutive three-minute runs at one million points per second, each under a new run label, so each run added a million series the pods had not seen before.
Idle memory across the eight pods went from 1.86 GiB before the first run to 3.09 GiB two minutes after the third, about 410 MiB per million new series. Size gateway memory for the number of distinct series the pods will see over their lifetime, not for the active set at one moment.
Test your own workload
Choose the labels your dashboards and alerts need. Use known counter changes, gauge values, and histogram totals to check your policy. Keep each original series on one pod while it holds counter state: pin senders to pods, or route by sender, and do not rotate connections.
Check a small, complete output sample before you increase the rate. Then record accepted points, failures, elapsed time, request delay, output counts, CPU, memory, and stored values. Add processors one at a time and measure each: in our runs a 10-second aggregation window or a dedup step cost 3% more CPU, while a PII mask or a rate limiter on metric attributes cost about 35% and pushed the eight pods into overload.
This test covered a fixed deployment for up to one hour. It did not test recovery from destination failures or guarantee delivery during an outage. Changing labels, late data, and agent restarts need their own checks before a production rollout.
Our rule kept service and operation totals while cutting the number of series by 95%. To test a policy for your metrics, talk with the Edge Delta team.