Most of the time when we are developing software or even using software, we are playing within the safe boundaries of the operating system. We don’t even know how that IP packet was welcomed from the network interface, or those inodes were handled by the filesystem when we save a file.
That boundary is called the user space, and it’s where we write our applications, libraries, and tools. But there’s another world, which is the kernel space. It’s where the operating system’s kernel resides, and it’s responsible for managing the system’s resources, such as memory, CPU, and I/O devices.
We usually don’t need to go below the sockets or file descriptors, but sometimes we need to. Let’s say you want to profile an application to see how much resource it consumes.
If you profile the application from the user space, you will not only miss too many useful details. But, you will also consume a significant amount of resources for profiling itself, because each layer on top of the CPU or memory introduces some overhead.
The Need to Go Deeper
Let’s say you want to go down the stack and somehow insert your custom code into the kernel to profile the application, or to trace the system calls, or to monitor the network packets. How would you do that?
Traditionally you have two options.
Option 1: Edit the Kernel Source Code
If you want to change the Linux kernel source code and then ship the same kernel to your customer’s machine, you will need to convince the Linux kernel community that the change is required. Then, you will need to wait for several years for the new kernel version to be adopted by the Linux distributions.
This is not a practical approach for most of the cases, and it’s also a little
much for just profiling an application, or monitoring the network packets.
Option 2: Write a Kernel Module
You can write a kernel module, which is a piece of code that can be loaded into the kernel and executed. This is a more practical approach, but it has its own risks and downsides.
First, you need to write a kernel module, which is not an easy task. Then, you need to maintain it regularly, because the kernel is a living thing, and it changes over time. If you don’t maintain your kernel module, it will be outdated and won’t work with the new kernel versions.
Second, you are risking corrupting your Linux kernel, because kernel modules don’t have security boundaries. If you write a kernel module that has a bug, it can crash the whole system.
Enter eBPF
eBPF (Extended Berkeley Packet Filter) is a revolutionary technology that allows you to reprogram the Linux kernel within minutes, without even rebooting the system.
eBPF allows you to trace system calls, user space functions, library functions, network packets, and much more. It’s a powerful tool for systems performance, monitoring, security, and much more.
But how?
eBPF is a system consisting of several components:
- eBPF programs
- eBPF hooks
- BPF maps
- eBPF verifier
- The eBPF virtual machine
Note that I have used the term “BPF” and “eBPF” interchangeably. eBPF stands for “Extended Berkeley Packet Filter”. BPF was originally introduced to Linux to filter network packets, but eBPF extends the original BPF to allow it to be used for other purposes. Today it’s not related to Berkeley, and it’s not only for filtering packets.
eBPF programs are written in a high-level language, such as C, and then compiled to eBPF bytecode. Then, the eBPF bytecode is loaded into the kernel and executed by the eBPF virtual machine.
An eBPF program is attached to a specific code path in the kernel, such as a system call. These code paths are called "hooks". When the hook is triggered, the eBPF program is executed and now it performs the custom logic you have written. This way we can run our custom code in the kernel space.
Hello World with eBPF
Before moving on to the details, let’s write a simple eBPF program to trace the execve system call. We will write the program in C, the user space program in Go, and then run the user space program. This will load the eBPF program into the kernel, and poll the custom events we will emit from the eBPF program, right before the actual execve system call is executed.
Writing the eBPF Program
Let’s start writing the eBPF program first. I will write part by part to explain the details better, but you can find the whole program in my GitHub repo: ozansz/intro-ebpf-with-go.
#include "vmlinux.h" #include struct event { u32 pid; u8 comm[100]; }; struct { __uint(type, BPF_MAP_TYPE_RINGBUF); __uint(max_entries, 1000); } events SEC(".maps");Here we import the vmlinux.h header file, which contains the kernel’s data structures and function prototypes. Then we include the bpf_helpers.h header file, which contains helper functions for eBPF programs.
Then we define a struct to hold the event data, and then we define a BPF map to store the events. We will use this map to communicate the events between the eBPF program, which will run in kernel space, and the user space program.
We will go into the details of BPF maps later, so don’t worry if you don’t understand why we used
BPF_MAP_TYPE_RINGBUF, or what isSEC(".maps")for.
We are now ready to write our first program and define the hook that it will be attached to:
SEC("kprobe/sys_execve")

int hello_execve(struct pt_regs *ctx) {

   u64 id = bpf_get_current_pid_tgid();

   pid_t pid = id >> 32;

   pid_t tid = (u32)id;

   if (pid != tid)

       return 0;

   struct event *e;

e = bpf_ringbuf_reserve(&events, sizeof(struct event), 0);

if (!e) {

return 0;

}

e->pid = pid;

bpf_get_current_comm(&e->comm, 100);

bpf_ringbuf_submit(e, 0);

return 0;

}
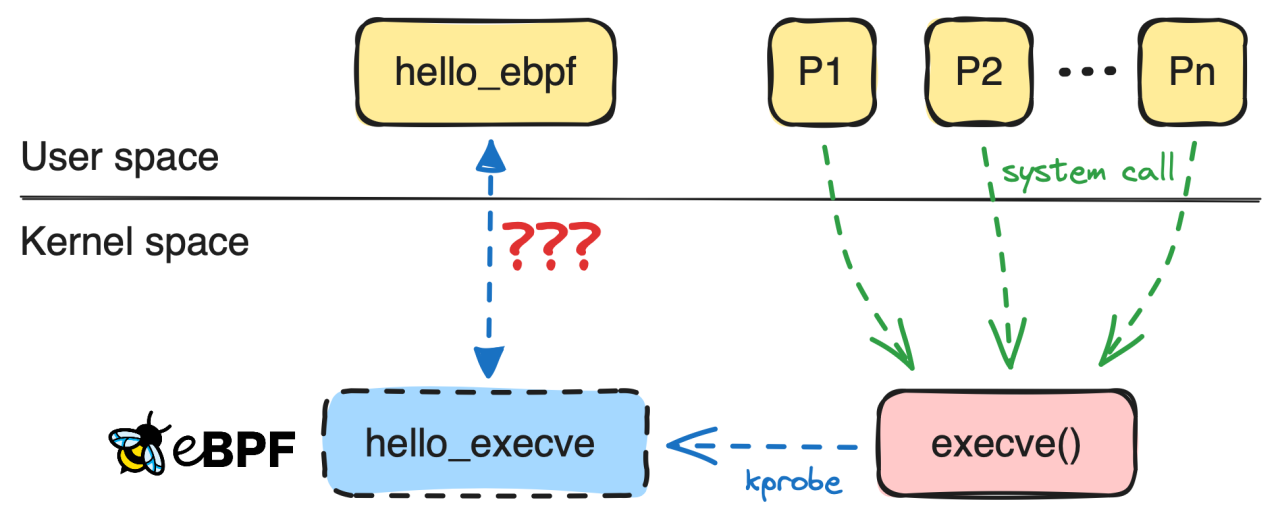
Here we define a function, hello_execve, and attach it to the sys_execve system call using the kprobe hook. kprobe is one of many hooks that eBPF provides, and it’s used to trace kernel functions. This hook will trigger our hello_execve function right before the sys_execve system call is executed.
Inside the hello_execve function, we first get the process ID and the thread ID, and then we check if they are the same. If they are not the same, that means we are in a thread, and we don’t want to trace threads, so we exit the eBPF program by returning zero.
We then reserve space in the events map to store the event data, and then we fill the event data with the process ID and the command name of the process. Then we submit the event to the events map.
It’s pretty simple until now, right?
Writing the User Space Program
Before starting to write the user space program, let me briefly explain what the program needs to do in user space. We need a user space program to load the eBPF program into the kernel, create the BPF map, attach to the BPF map, and then read the events from the BPF map.
To perform these operations, we need to use a specific system call. This system call is called bpf(), and it’s used to perform several eBPF-related operations, such as reading the contents of a BPF map.
We can call this system call ourselves from the user space as well, but it means too many low-level operations. Thankfully there are libraries that provide a high-level interface to the bpf() system call. One of them is Cilium’s ebpf-go package, which we will use in this example.
Let’s dive into some Go code.
//go:generate go run github.com/cilium/ebpf/cmd/bpf2go -type event ebpf hello_ebpf.c

func main() {

stopper := make(chan os.Signal, 1)

signal.Notify(stopper, os.Interrupt, syscall.SIGTERM)

// Allow the current process to lock memory for eBPF resources.

if err := rlimit.RemoveMemlock(); err != nil {

log.Fatal(err)

}

objs := ebpfObjects{}

if err := loadEbpfObjects(&objs, nil); err != nil {

log.Fatalf("loading objects: %v", err)

}

defer objs.Close()

kp, err := link.Kprobe(kprobeFunc, objs.HelloExecve, nil)

if err != nil {

log.Fatalf("opening kprobe: %s", err)

}

defer kp.Close()

rd, err := ringbuf.NewReader(objs.Events)

if err != nil {

log.Fatalf("opening ringbuf reader: %s", err)

}

defer rd.Close()

   ...
The first line is a Go compiler directive, go:generate. Here we say to the Go compiler to run the bpf2go tool from the github.com/cilium/ebpf/cmd/bpf2go package, and generate a Go file from the hello_ebpf.c file.
The generated Go files will include the Go representation of the eBPF program, the types and structs we have defined in the eBPF program, etc. We then will use these representations inside our Go code to load the eBPF program into the kernel, and to interact with the BPF map.
We then use the generated types to load the eBPF program (`loadEbpfObjects`), attach to the kprobe hook (`link.Kprobe`), and read the events from the BPF map (`ringbuf.NewReader`). All of these functions use the generated types.
It’s time to interact with the kernel side:
   ...

go func() {

<-stopper

if err := rd.Close(); err != nil {

log.Fatalf("closing ringbuf reader: %s", err)

}

}()

log.Println("Waiting for events..")

var event ebpfEvent

for {

record, err := rd.Read()

if err != nil {

if errors.Is(err, ringbuf.ErrClosed) {

log.Println("Received signal, exiting..")

return

}

log.Printf("reading from reader: %s", err)

continue

}

if err := binary.Read(bytes.NewBuffer(record.RawSample), binary.LittleEndian, &event); err != nil {

log.Printf("parsing ringbuf event: %s", err)

continue

}

procName := unix.ByteSliceToString(event.Comm[:])

log.Printf("pid: %d\tcomm: %s\n", event.Pid, procName)

}

}
We start a goroutine to listen to the stopper channel, which we defined in the previous Go snippet. This channel will be used to stop the program gracefully when we receive an interrupt signal.
We then start a loop to read the events from the BPF map. We use the ringbuf.Reader type to read the events, and then we parse the event data using the binary.Read function, into the ebpfEvent type, which is generated from the eBPF program.
We then print the process ID and the command name of the process to the standard output.
Running the Program
Now we are ready to run the program. First, we need to compile the eBPF program, and then run the user space program.
$ go generate

Compiled /Users/sazak/workspace/gocode/src/github.com/ozansz/intro-ebpf-with-go/0x01-helloworld/ebpf_bpfel.o

Stripped /Users/sazak/workspace/gocode/src/github.com/ozansz/intro-ebpf-with-go/0x01-helloworld/ebpf_bpfel.o

Wrote /Users/sazak/workspace/gocode/src/github.com/ozansz/intro-ebpf-with-go/0x01-helloworld/ebpf_bpfel.go

Compiled /Users/sazak/workspace/gocode/src/github.com/ozansz/intro-ebpf-with-go/0x01-helloworld/ebpf_bpfeb.o

Stripped /Users/sazak/workspace/gocode/src/github.com/ozansz/intro-ebpf-with-go/0x01-helloworld/ebpf_bpfeb.o

Wrote /Users/sazak/workspace/gocode/src/github.com/ozansz/intro-ebpf-with-go/0x01-helloworld/ebpf_bpfeb.go

$ go build -o hello_ebpf
We first run the go generate command to compile the eBPF program, and then we run the go build command to compile the user space program.
Then we run the user space program:
sudo ./hello_ebpf

hello_ebpf: 01:20:54 Waiting for events..
I’m running this program inside a VM in Lima, why not open another shell and see what will happen?
limactl shell intro-ebpf

$
Meanwhile in the first shell:
hello_ebpf: 01:22:22 pid: 3360 comm: sshd

hello_ebpf: 01:22:22 pid: 3360 comm: bash

hello_ebpf: 01:22:22 pid: 3361 comm: bash

hello_ebpf: 01:22:22 pid: 3362 comm: bash

hello_ebpf: 01:22:22 pid: 3363 comm: bash

hello_ebpf: 01:22:22 pid: 3366 comm: bash

hello_ebpf: 01:22:22 pid: 3367 comm: lesspipe

hello_ebpf: 01:22:22 pid: 3369 comm: lesspipe

hello_ebpf: 01:22:22 pid: 3370 comm: bash
As expected, we are seeing that the sshd process is starting, and then the bash process is starting, and then the lesspipe process is starting, and so on.
This is a simple example of how we can use eBPF to trace the execve system call, and then read the events from the BPF map in the user space. We wrote a fairly simple yet powerful program, and we intercepted the execve system call without modifying the kernel source code or restarting the system.
eBPF Hooks and Maps
So, what actually happened in the previous example? We attached the eBPF program to the sys_execve system call using the kprobe hook, to run the hello_execve function wheneve the sys_execve system call is called, right before the original system call is code is executed.

eBPF is event driven, meaning that it expects us to attach the eBPF program to a specific code path in the kernel. These code paths are called “hooks”, and there are several types of hooks that eBPF provides. The most common ones are:
kprobe,kretprobe: Trace kernel functionsuprobe,uretprobe: Trace user space functionstracepoint: Trace predefined tracepoints in the kernelxdp: eXpress Data Path, used to filter and redirect network packetsusdt: User Statically Defined Tracing, used to trace user space functions in a more efficient way
The hooks kprobe and uprobe are used to invoke the attached eBPF programs before the function/syscall execution, and kretprobe and uretprobe are used to invoke the attached eBPF programs after the function/syscall execution.
We also used a BPF map to store the events. BPF maps are data structures to store and communicate different kinds of data. We also use them for state management. There are too many types of BPF maps supported, and we use different types of maps for different purposes. Some of the most common BPF map types are:
BPF_MAP_TYPE_HASH: A hash mapBPF_MAP_TYPE_ARRAY: An arrayBPF_MAP_TYPE_RINGBUF: A ring bufferBPF_MAP_TYPE_STACK: A stackBPF_MAP_TYPE_QUEUE: A queueBPF_MAP_TYPE_LRU_HASH: A least recently used hash map
Some of these map types also have per-CPU variants, such as BPF_MAP_TYPE_PERCPU_HASH, which is a hash map with a separate hash table for each CPU core.
One Step Further: Tracing Incoming IP Packets
Let’s take a step further and write a more complex eBPF program. This time we will use the XDP hook to invoke the eBPF program right after the network interface sends a network packet to the kernel, even before the kernel processes the packet.
Writing the eBPF Program
We will write an eBPF program to count the number of incoming IP packets by the source IP address and port number, and then we will read the counts from the BPF map in the user space. We will parse the ethernet, IP and TCP/UDP headers of each packet, and store the counts of the valid TCP/UDP packets in the BPF map.
First, the eBPF program:
#include "vmlinux.h" #include #include #define MAX_MAP_ENTRIES 100 /* Define an LRU hash map for storing packet count by source IP and port */ struct { __uint(type, BPF_MAP_TYPE_LRU_HASH); __uint(max_entries, MAX_MAP_ENTRIES); __type(key, u64); // source IPv4 addresses and port tuple __type(value, u32); // packet count } xdp_stats_map SEC(".maps");Like the first example, we will include the vmlinux.h and BPF helper headers. We also define a map, xdp_stats_map, to store the IP:ports and packet count information. We wil then populate this map inside the hook function and read the contents in the user space program.
What I mean by IP:ports is basically a u64 value, packed with the source IP, source port and the destination port. The IP address (**IPv4**, specifically) is 32-bits long, and each port number is 16-bits long, so we need exactly 64 bits to store all three – that’s why we are using u64 here. We are only processing the ingress (incoming packets) here so we won’t need to store the destination IP address.
Different from the last example we now used BPF_MAP_TYPE_LRU_HASH as the map type. This type of map lets us store a (key, value) pair as a hashmap with LRU variant.
See how we defined the map here, we explicitly set the number of maximum entries, and the types of the map key and values. For key we are using a 64-bit unsigned integer and for value a 32-bit unsigned integer.
The maximum value of
u32is2^32 - 1, which is more than enough packets for the sake of this example.
To learn the IP address and port number, we first need to parse the packet and read the ethernet, IP and then TCP/UDP headers.
As XDP is placed right after the network interface card, we will be given the raw packet data in bytes, so we will need to manually walk on the byte array and unmarshal the ethernet, IP and TCP/UDP headers.
Hopefully, we have all the header definitions (`struct ethhdr`, struct iphdr, struct tcphdr, and struct udphdr), inside vmlinux.h header file. We will use these structs to extract the IP address and port number information in a separate function, parse_ip_packet:
#define ETH_P_IP 0x0800 /* Internet Protocol packet */ #define PARSE_SKIP 0 #define PARSED_TCP_PACKET 1 #define PARSED_UDP_PACKET 2 static __always_inline int parse_ip_packet(struct xdp_md ctx, u64 ip_metadata) { void data_end = (void )(long)ctx->data_end; void data = (void )(long)ctx->data; // First, parse the ethernet header. struct ethhdr *eth = data; if ((void *)(eth + 1) > data_end) { return PARSE_SKIP; } if (eth->h_proto != bpf_htons(ETH_P_IP)) { // The protocol is not IPv4, so we can't parse an IPv4 source address. return PARSE_SKIP; } // Then parse the IP header. struct iphdr ip = (void )(eth + 1); if ((void *)(ip + 1) > data_end) { return PARSE_SKIP; } u16 src_port, dest_port; int retval; if (ip->protocol == IPPROTO_TCP) { struct tcphdr tcp = (void)ip + sizeof(*ip); if ((void*)(tcp+1) > data_end) { return PARSE_SKIP; } src_port = bpf_ntohs(tcp->source); dest_port = bpf_ntohs(tcp->dest); retval = PARSED_TCP_PACKET; } else if (ip->protocol == IPPROTO_UDP) { struct udphdr udp = (void)ip + sizeof(*ip); if ((void*)(udp+1) > data_end) { return PARSE_SKIP; } src_port = bpf_ntohs(udp->source); dest_port = bpf_ntohs(udp->dest); retval = PARSED_UDP_PACKET; } else { // The protocol is not TCP or UDP, so we can't parse a source port. return PARSE_SKIP; } // Return the (source IP, destination IP) tuple in network byte order. // |<-- Source IP: 32 bits -->|<-- Source Port: 16 bits --><-- Dest Port: 16 bits -->| *ip_metadata = ((u64)(ip->saddr) << 32) | ((u64)src_port << 16) | (u64)dest_port; return retval; }The function:
- Checks if the packet has a valid ethernet header, IP header, and TCP or UDP header. These checks are done by using the
h_protoofstruct ethhdrandprotocolofstruct iphdr. Each header stores the protocol of the inner packet it wraps. - Extracts the IP address from the IP header and port number from the TCP/UDP headers and forms an
IP:portstuple inside a 64-bit unsigned integer (`u64`) - Returns a code to tell the caller whether the packet is a TCP packet, a UDP packet, or else (`PARSE_SKIP`)
Notice the __always_inline at the beginning of the function signature. This tells the compiler to always inline this funcion as static code, which saves us from performing a function call.
Now it’s time to write the hook function and use parse_ip_packet:
SEC("xdp")

int xdp_prog_func(struct xdp_md *ctx) {

u64 ip_meta;

int retval = parse_ip_packet(ctx, &ip_meta);


if (retval != PARSED_TCP_PACKET) {

return XDP_PASS;

}

u32 *pkt_count = bpf_map_lookup_elem(&xdp_stats_map, &ip_meta);

if (!pkt_count) {

// No entry in the map for this IP tuple yet, so set the initial value to 1.

u32 init_pkt_count = 1;

bpf_map_update_elem(&xdp_stats_map, &ip_meta, &init_pkt_count, BPF_ANY);

} else {

// Entry already exists for this IP tuple,

// so increment it atomically.

__sync_fetch_and_add(pkt_count, 1);

}

return XDP_PASS;

}
The xdp_prog_func is fairly simple as we already coded most of the program logic inside parse_ip_packet. What we do here is:
- Parse the packet using
parse_ip_packet - Skip counting if it’s not a TCP or UDP packet by returning
XDP_PASS - Lookup the
IP:portstuple in BPF map keys using thebpf_map_lookup_elemhelper function - Set the value to one if the
IP:portstuple is seen the first time, else increment it by one. The__sync_fetch_and_addis an LLVM built-in here
Finally we attach this function to the XDP subsystem by using the SEC("xdp") macro.
Writing the User Space Program
It’s time to dive into Go code again.
//go:generate go run github.com/cilium/ebpf/cmd/bpf2go ebpf xdp.c

var (

   ifaceName = flag.String("iface", "", "network interface to attach XDP program to")

)

func main() {

log.SetPrefix("packet_count: ")

log.SetFlags(log.Ltime | log.Lshortfile)

   flag.Parse()

// Subscribe to signals for terminating the program.

stop := make(chan os.Signal, 1)

signal.Notify(stop, os.Interrupt, syscall.SIGTERM)

iface, err := net.InterfaceByName(*ifaceName)

if err != nil {

log.Fatalf("network iface lookup for %q: %s", *ifaceName, err)

}

// Load pre-compiled programs and maps into the kernel.

objs := ebpfObjects{}

if err := loadEbpfObjects(&objs, nil); err != nil {

log.Fatalf("loading objects: %v", err)

}

defer objs.Close()

// Attach the program.

l, err := link.AttachXDP(link.XDPOptions{

Program:   objs.XdpProgFunc,

Interface: iface.Index,

})

if err != nil {

log.Fatalf("could not attach XDP program: %s", err)

}

defer l.Close()

log.Printf("Attached XDP program to iface %q (index %d)", iface.Name, iface.Index)

   ...
Here we first load the generated eBPF program and map using the loadEbpfObjects function. Then we attach the program to the specified network interface using the link.AttachXDP function. Similar to the previous example we used a channel to listen to the interrupt signal and close the program gracefully.
Next, we will read the map contents in every second and print the packet counts to the standard output:
   ...

   ticker := time.NewTicker(time.Second)

defer ticker.Stop()

for {

select {

case <-stop:

if err := objs.XdpStatsMap.Close(); err != nil {

log.Fatalf("closing map reader: %s", err)

}

return

case <-ticker.C:

m, err := parsePacketCounts(objs.XdpStatsMap, excludeIPs)

if err != nil {

log.Printf("Error reading map: %s", err)

continue

}

log.Printf("Map contents:\n%s", m)

srv.Submit(m)

}

}

}
We will use a utility function, parsePacketCounts, to read the map contents and parse the packet counts. This function will read the map contents in a loop.
As we will be given raw bytes from the map, we will need to parse the bytes and convert them into a human-readable format. We will define a new type PacketCounts to store the parsed map contents.
type IPMetadata struct { SrcIP netip.Addr SrcPort uint16 DstPort uint16 } func (t *IPMetadata) UnmarshalBinary(data []byte) (err error) { if len(data) != 8 { return fmt.Errorf("invalid data length: %d", len(data)) } if err = t.SrcIP.UnmarshalBinary(data[4:8]); err != nil { return } t.SrcPort = uint16(data[3])<<8 | uint16(data[2]) t.DstPort = uint16(data[1])<<8 | uint16(data[0]) return nil } func (t IPMetadata) String() string { return fmt.Sprintf("%s:%d => :%d", t.SrcIP, t.SrcPort, t.DstPort) } type PacketCounts map[string]int func (i PacketCounts) String() string { var keys []string for k := range i { keys = append(keys, k) } sort.Strings(keys) var sb strings.Builder for _, k := range keys { sb.WriteString(fmt.Sprintf("%s\t| %d\n", k, i[k])) } return sb.String() }We defined a new type, IPMetadata, to store the IP:ports tuple. We also defined a UnmarshalBinary method to parse the raw bytes and convert them into a human-readable format. We also defined a String method to print the IP:ports tuple in a human-readable format.
We then defined a new type, PacketCounts, to store the parsed map contents. We also defined a String method to print the map contents in a human-readable format.
Finally, we will use the PacketCounts type to parse the map contents and print the packet counts:
func parsePacketCounts(m *ebpf.Map, excludeIPs map[string]bool) (PacketCounts, error) {

var (

key    IPMetadata

val    uint32

counts = make(PacketCounts)

)

iter := m.Iterate()

for iter.Next(&key, &val) {

if _, ok := excludeIPs[key.SrcIP.String()]; ok {

continue

}

counts[key.String()] = int(val)

}

return counts, iter.Err()

}
Running the Program
We first need to compile the eBPF program and then run the user space program.
$ go generate

Compiled /Users/sazak/workspace/gocode/src/github.com/ozansz/intro-ebpf-with-go/0x03-packet-count/ebpf_bpfel.o

Stripped /Users/sazak/workspace/gocode/src/github.com/ozansz/intro-ebpf-with-go/0x03-packet-count/ebpf_bpfel.o

Wrote /Users/sazak/workspace/gocode/src/github.com/ozansz/intro-ebpf-with-go/0x03-packet-count/ebpf_bpfel.go

Compiled /Users/sazak/workspace/gocode/src/github.com/ozansz/intro-ebpf-with-go/0x03-packet-count/ebpf_bpfeb.o

Stripped /Users/sazak/workspace/gocode/src/github.com/ozansz/intro-ebpf-with-go/0x03-packet-count/ebpf_bpfeb.o

Wrote /Users/sazak/workspace/gocode/src/github.com/ozansz/intro-ebpf-with-go/0x03-packet-count/ebpf_bpfeb.go

$ go build -o packet_count
Now we can run it:
$ sudo ./packet_count --iface eth0

packet_count: 22:11:10 main.go:107: Attached XDP program to iface "eth0" (index 2)

packet_count: 22:11:10 main.go:132: Map contents:

192.168.5.2:58597 => :22 | 51

packet_count: 22:11:11 main.go:132: Map contents:

192.168.5.2:58597 => :22 | 52

packet_count: 22:11:11 main.go:132: Map contents:

192.168.5.2:58597 => :22 | 53
The packets coming to the port 22 from the IP address 192.168.5.2 are the SSH packets, as I am running this program inside a VM and I am SSHing into.
Let’s run curl inside the VM in another terminal, and see what will happen:
$ curl https://www.google.com/Meanwhile in the first terminal:
packet_count: 22:14:07 main.go:132: Map contents:

172.217.22.36:443 => :38324 | 12

192.168.5.2:58597 => :22 | 551

packet_count: 22:14:08 main.go:132: Map contents:

172.217.22.36:443 => :38324 | 12

192.168.5.2:58597 => :22 | 552

packet_count: 22:14:08 main.go:132: Map contents:

172.217.22.36:443 => :38324 | 30

192.168.5.2:58597 => :22 | 570

packet_count: 22:14:09 main.go:132: Map contents:

172.217.22.36:443 => :38324 | 30

192.168.5.2:58597 => :22 | 571
We are seeing the packets coming to the port 38324 from the IP address 172.217.22.36 are the packets coming from the curl command.


