
Most teams monitor their servers closely and their web pages very little. Every service writes logs and every API call produces a trace. But when a visitor opens the app on a mid-range phone, waits nine seconds for it to load, and closes the tab, nothing records that visit.
The industry term for collecting timing data from the browsers of real visitors is Real User Monitoring, or RUM. Vendors usually sell it as a separate product. You install a separate script and pay a separate bill.
We built it into Edge Delta instead. This post explains how we did that, what a page view looks like once it reaches the pipeline, and what we still have to do. In short, a 10 kB script now runs on app.edgedelta.com. It collects page loads, route changes, page speed scores, request timings, and JavaScript errors. After one release of running both, it replaced Sentry in our web app.
Starting from what we already had
When we started, the pipeline already handled most of the work. Our ingestion endpoint accepted OTLP over HTTP, the OpenTelemetry wire format for logs, metrics, and traces. It validated tokens and applied rate limits. The Traces Explorer already drew each operation as a waterfall of timed steps, which OpenTelemetry calls spans.
So the browser script did not need its own backend. It only had to translate browser events into the shapes the pipeline already understood. A page load or a route change becomes a span. The page speed scores become attributes on that span: LCP for how long the main content takes to appear, CLS for how much the layout shifts while loading, and INP for how quickly the page responds to a click. A JavaScript error becomes a log record.
Sending browser data through the same ingestion endpoint as everything else has two benefits.
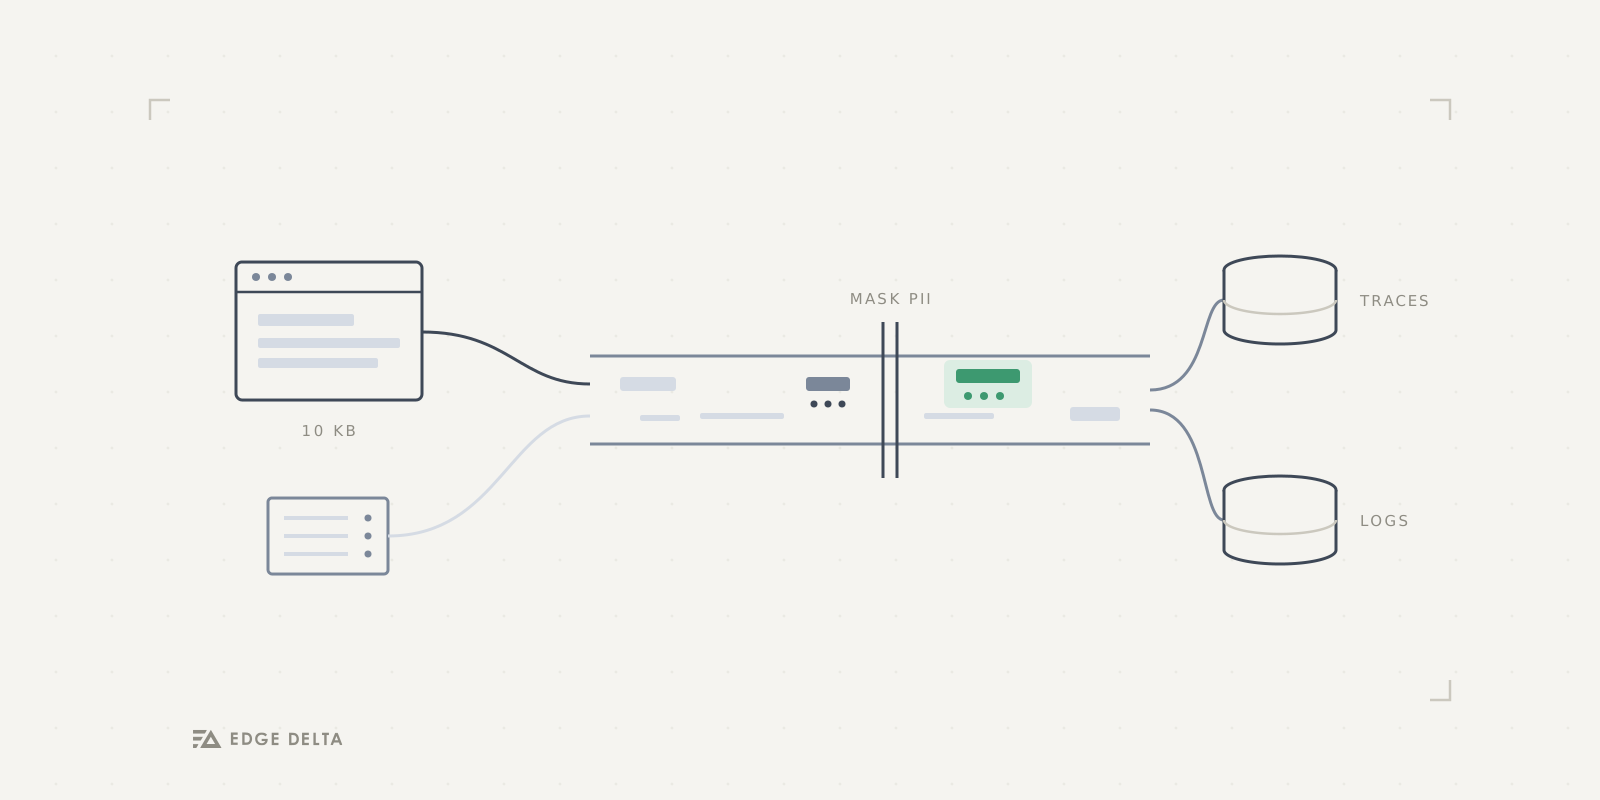
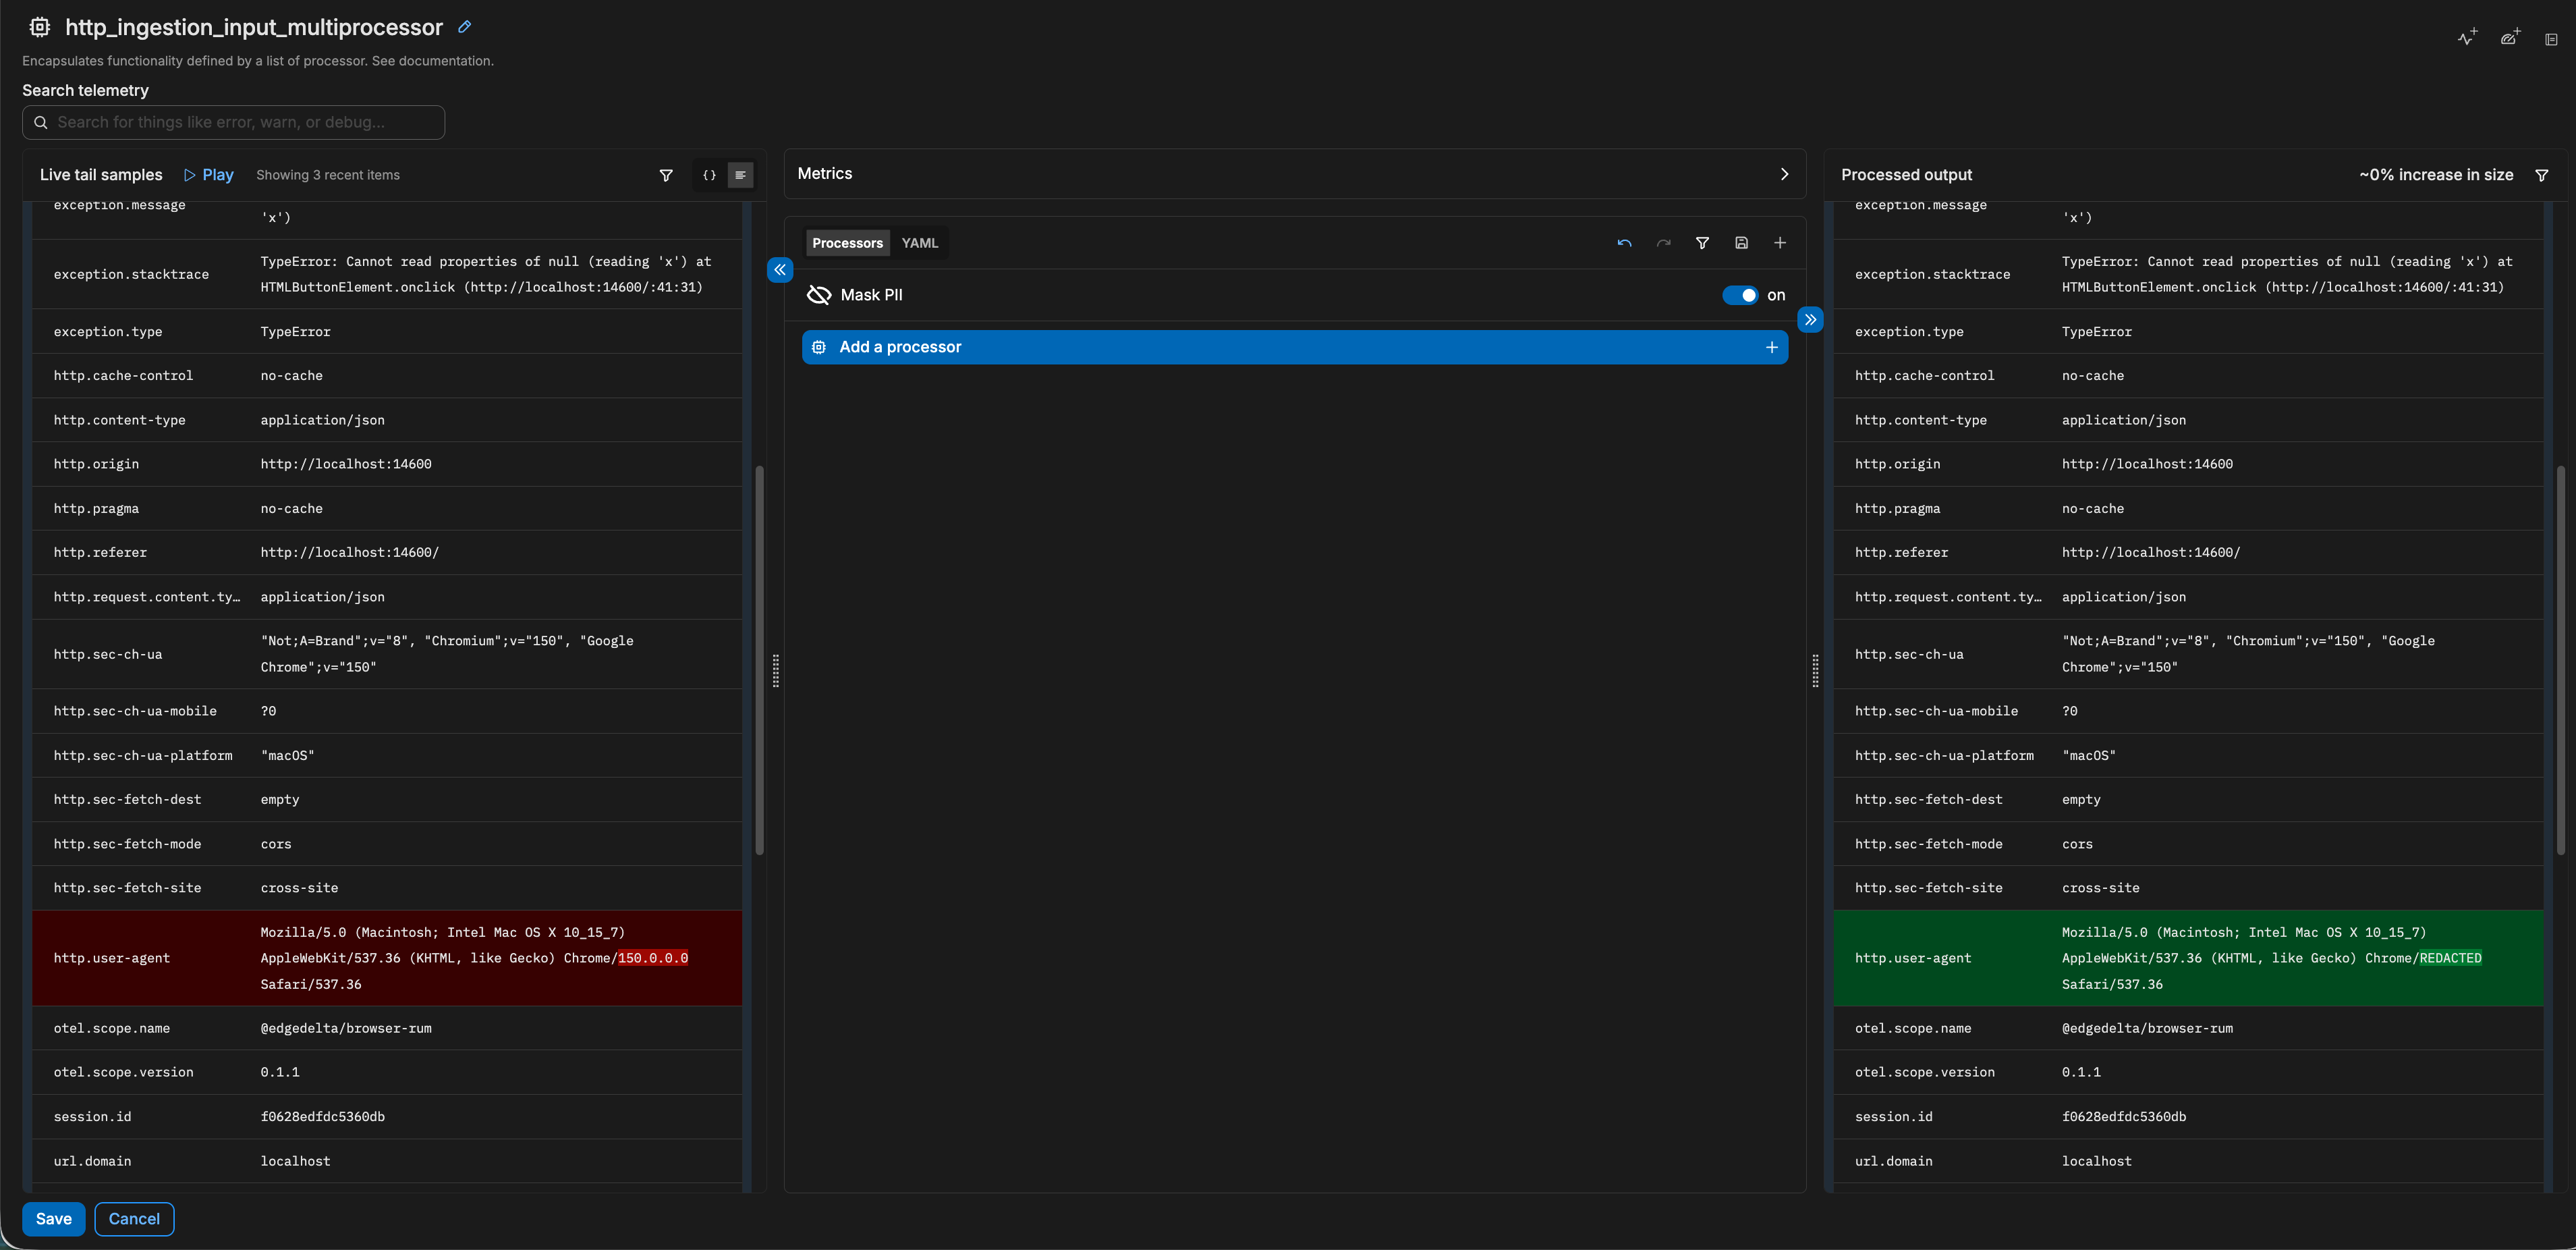
First, your existing processing rules apply to page views. In the screenshot below, the Mask PII processor strips the browser version out of the user agent before storage. We wrote no RUM-specific code for that.
Second, every feature that reads the trace and log stores works with RUM data without changes. The Traces Explorer shows a page load next to the backend request it triggered. Dashboards chart 75th percentile LCP by route. Monitors alert on browser errors for a single route. AI teammates search browser errors while they investigate an incident. The only new code was the browser script and one origin check on the ingest side.
Querying it from the terminal
Because RUM data lives in the same stores, our CLI reads it with no RUM-specific code. This command returns page speed per route from our own app:
edx traces search \
  --query 'service.name:"edgedelta-web" AND @ed.rum.lcp.rating:"good"' \
  --lookback 24h --limit 6 --output table \
  --columns 'attributes.ed.rum.route,attributes.ed.rum.lcp,attributes.ed.rum.cls,attributes.ed.rum.inp'
ATTRIBUTES.ED.RUM.ROUTE ATTRIBUTES.ED.RUM.LCP ATTRIBUTES.ED.RUM.CLS ATTRIBUTES.ED.RUM.INP
/_auth/auth/_anon/login 840 0.0046 136
/_app-init/_license-guard/_navbar/_active-org/ 508 0
/_app-init/_license-guard/_navbar/_active-org/ 452 0
/_auth/auth/_anon/login 800 0.0046 144
/_app-init/_license-guard/_navbar/_active-org/ 516 0
/_auth/auth/_anon/login 948 0.0046 144These are real rows. The route column holds the pattern the router matched, not the URL the visitor opened, and that is what lets the rows group. The empty INP cells are page loads where nobody clicked anything, so there was no interaction to measure.
Errors come out of the log store. You can count the most common ones with sort and uniq:
edx logs search --query 'ed.tag:"ed-rum" AND severity_text:"ERROR"' \
  --lookback 72h --limit 400 --output csv --columns body \
  | tail -n +2 | sort | uniq -c | sort -rn | head -6
88 ResizeObserver loop completed with undelivered notifications.
13 Paper Shaders: image for uniform u_noiseTexture must be fully loaded
12 ResizeObserver loop limit exceeded
4 Paper Shaders: WebGL is not supported in this browser
3 Zendesk not loaded
3 Authentication window was closed before the flow completed.The top line is the reason the script has an ignoreErrors option. ResizeObserver warnings are browser noise that no application code can fix, and here they outnumber the errors that matter. We have not added them to our own ignore list yet. We found out we should by running this query.
What one page view looks like
The script measures views. The initial document load is one view, and every route change after it is another. Each view gets its own trace, span, CLS score, and INP score. Views link to each other through session.id, because a forty-minute session in a single-page app is not one operation.
Detecting a route change needs no framework integration. The script listens for the Navigation API’s currententrychange event and wraps history in browsers that lack it. Only a change of path starts a new view, so a router that rewrites the query string on every filter change does not create extra views.
The script cannot determine two things on its own: the route pattern and the moment the transition finished. By default it uses the pathname and the first paint. One subscription fixes both:
// TanStack Router. The same shape works for any router with a resolved event.
router.subscribe("onResolved", ({ toLocation }) => endView(toLocation.routeId));
Now ed.rum.route reads /orgs/$orgId/logs instead of /orgs/42/logs, so route spans group into something you can chart. The view timing also runs until the data resolved instead of stopping at first paint.
A view span tells you a route took 1.8 seconds. It does not tell you why. When you turn on requestSpans, every request the view made becomes a client span nested under it:
routeChange  /orgs/$orgId/logs
├─ GET api.edgedelta.com     200   42ms
├─ GET api.edgedelta.com     200  310ms
└─ GET api.edgedelta.com     500  1.2s   ← status ERROR, error.type=500
fetch and XMLHttpRequest produce identical records. Each span carries the method, status, host, and the URL with the query string and fragment stripped, since those often contain tokens and record ids. It also carries session.id and ed.rum.route, so you can attribute latency to a route and a user.
The script handles aborted requests differently. They report with error.type: AbortError and no status, not as failures. Query libraries cancel in-flight requests on every unmount and refetch. If we counted those as errors, your error rate would mostly measure how quickly people navigate.
One trace across the browser and the backend
With request spans on, the script sends a traceparent header with each request, and the server’s span becomes a child of the browser’s. You do not need to change the backend. Every OpenTelemetry SDK reads W3C trace context by default, and so do the Datadog, Elastic, and Dynatrace agents.
Same-origin requests get the header automatically. You opt in to cross-origin hosts one at a time, for a specific reason. traceparent is not on the CORS safelist, so adding it triggers a preflight request. If the server does not list the header in Access-Control-Allow-Headers, the preflight fails and the browser never sends the real request. Update your CORS config first, then add the host. Entries match whole hosts with no wildcards, so an allowlist entry cannot match a third-party host by accident.
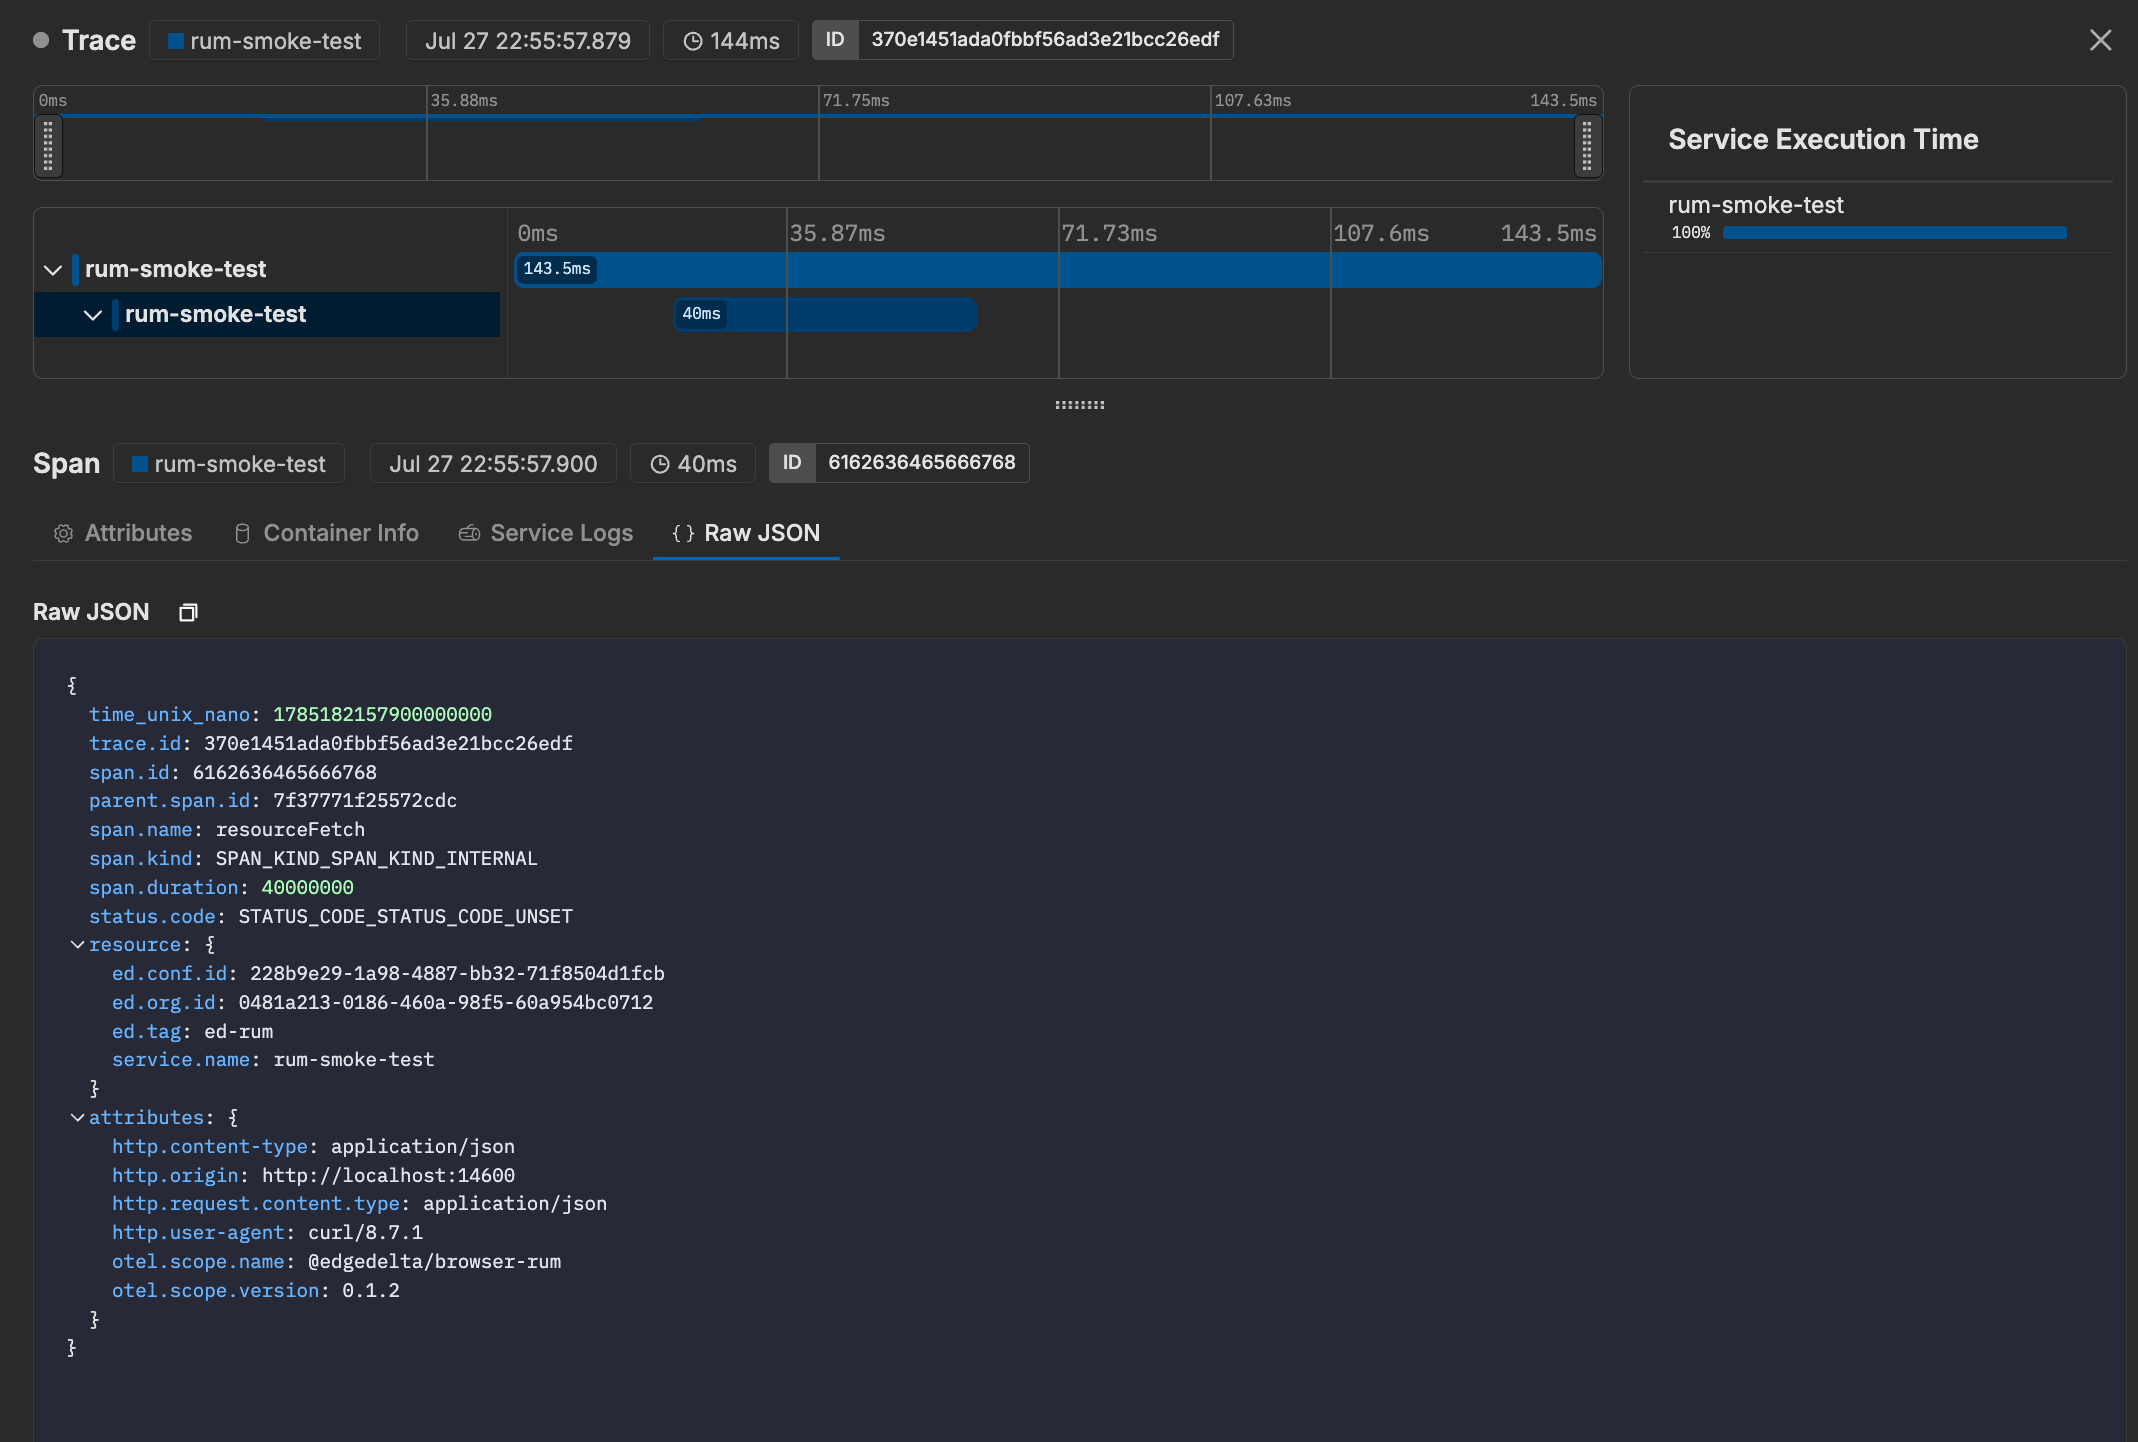
One request can never carry the header: the request for your HTML, because no script runs before the browser asks for the document. For that request, the link goes in the other direction. The server reports its own trace on the response, and the documentLoad span records it as a link rather than a parent, since the server started a separate trace:
Server-Timing: traceparent;desc="00-4bf92f3577b34da6a3ce929d0e0e4736-00f067aa0ba902b7-01"Turning propagation on also exposed a bug on our side. Our API started every span with tracer.Start(r.Context(), ...) without extracting the incoming context first, so every span became a root span, even for service-to-service calls. We fixed it by extracting the context and switching to a parent-based sampler.
Why errors are logs
Most RUM products record a JavaScript error as an event attached to a span. We record it as a log record. An error from a global handler usually has no span it belongs to. As a log, it gets full-text search across stack traces and opens in the same drawer as your service logs. You can still reach the page load, because every error carries the view’s trace id and session.id, and the log drawer links to that view.
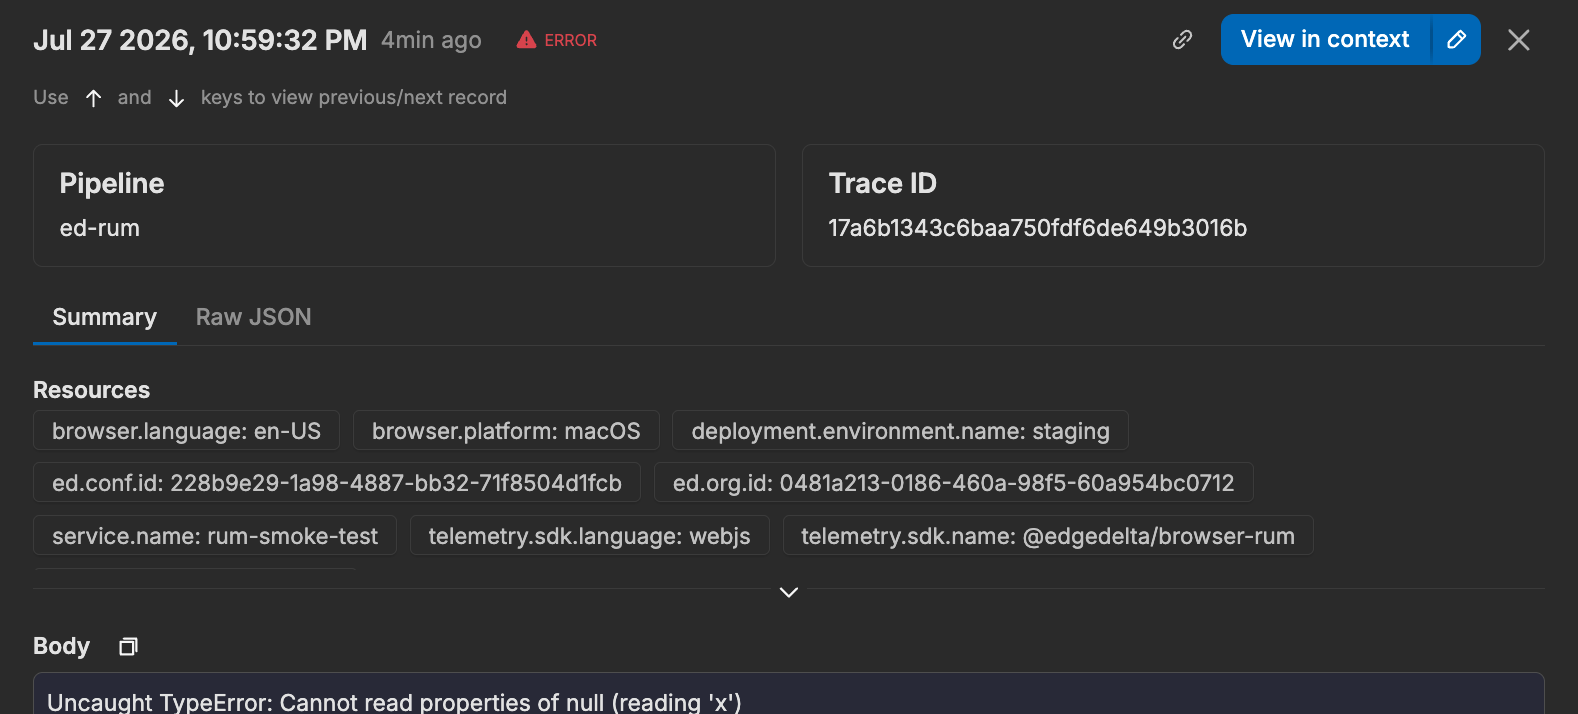
Each error also carries ed.rum.breadcrumbs, the last twenty things that happened before it. The script records clicks, fetch calls, and console.error calls automatically, and your app can add its own. A click breadcrumb describes structure only, for example button#save.btn[data-test-id=save-button]. It contains no text content, input values, or aria-label, because that string leaves the browser attached to every error the page reports afterwards.
React needs its own path, because React catches render errors before any global handler sees them. The /react entry point covers three cases and tags them in ed.rum.mechanism: errors your error boundary caught, errors no boundary caught, which we report as FATAL because the page died, and errors a router’s per-route boundary caught. The last case is easy to miss. If you miss it, a whole route can crash and nothing reports it.
Keeping it at ten kilobytes
A tool that measures page speed should not slow the page down. Our first prototype used the standard OpenTelemetry web stack, and it came to 80 to 100 kB gzipped before it measured anything. So we wrote the OTLP/JSON encoding ourselves. The SDK ships no OpenTelemetry code at runtime and has one dependency, Google’s web-vitals library. A size-limit check in CI fails the build if the bundle grows.
This is how it compares to other SDKs:
| SDK | gzipped |
|---|---|
| Edge Delta browser RUM v0.6.0 | 9.9 kB |
| Datadog RUM v7 | 63.3 kB |
| Sentry browser + tracing v10.73 | 49.2 kB |
| Grafana Faro web SDK v2.11 | 39.2 kB |
| New Relic SPA loader v1.321 | 26.4 kB* |
*Each number is that vendor’s public CDN bundle run through gzip -9, measured on 2026-09-01. The New Relic figure covers only the initial loader, and the full agent downloads after it.
Because the bundle is small, we also support Safari 14, Chrome 80, Firefox 78, and Edge 88. We set the floor that low on purpose. RUM exists to tell you about slow and unusual devices, and a script that only runs in current browsers misses the visitors you most need to measure.
Installing it, and keeping the token safe
The Vite plugin handles the two jobs that have to happen before the browser runs anything:
export default defineConfig({
  plugins: [edgeDeltaRum({ config: { service: "acme-web" } })],
});
First, it reads the configuration from environment variables at build time and serves it as a virtual module, so no variable names end up in the bundle. If you configure no token, the module exports null and the plugin injects nothing. Our local and preview builds run this way.
Second, it injects a 505-byte blocking script that catches errors thrown before your bundle finishes downloading. An SDK that initializes inside a React root has already missed that window, and nothing inside the bundle can recover it. The loader keeps up to twenty early errors, queues any calls made against a stubbed API, and hands everything to init once the real bundle arrives. For sites that do not use Vite, we publish the loader as a snippet you paste into <head>.
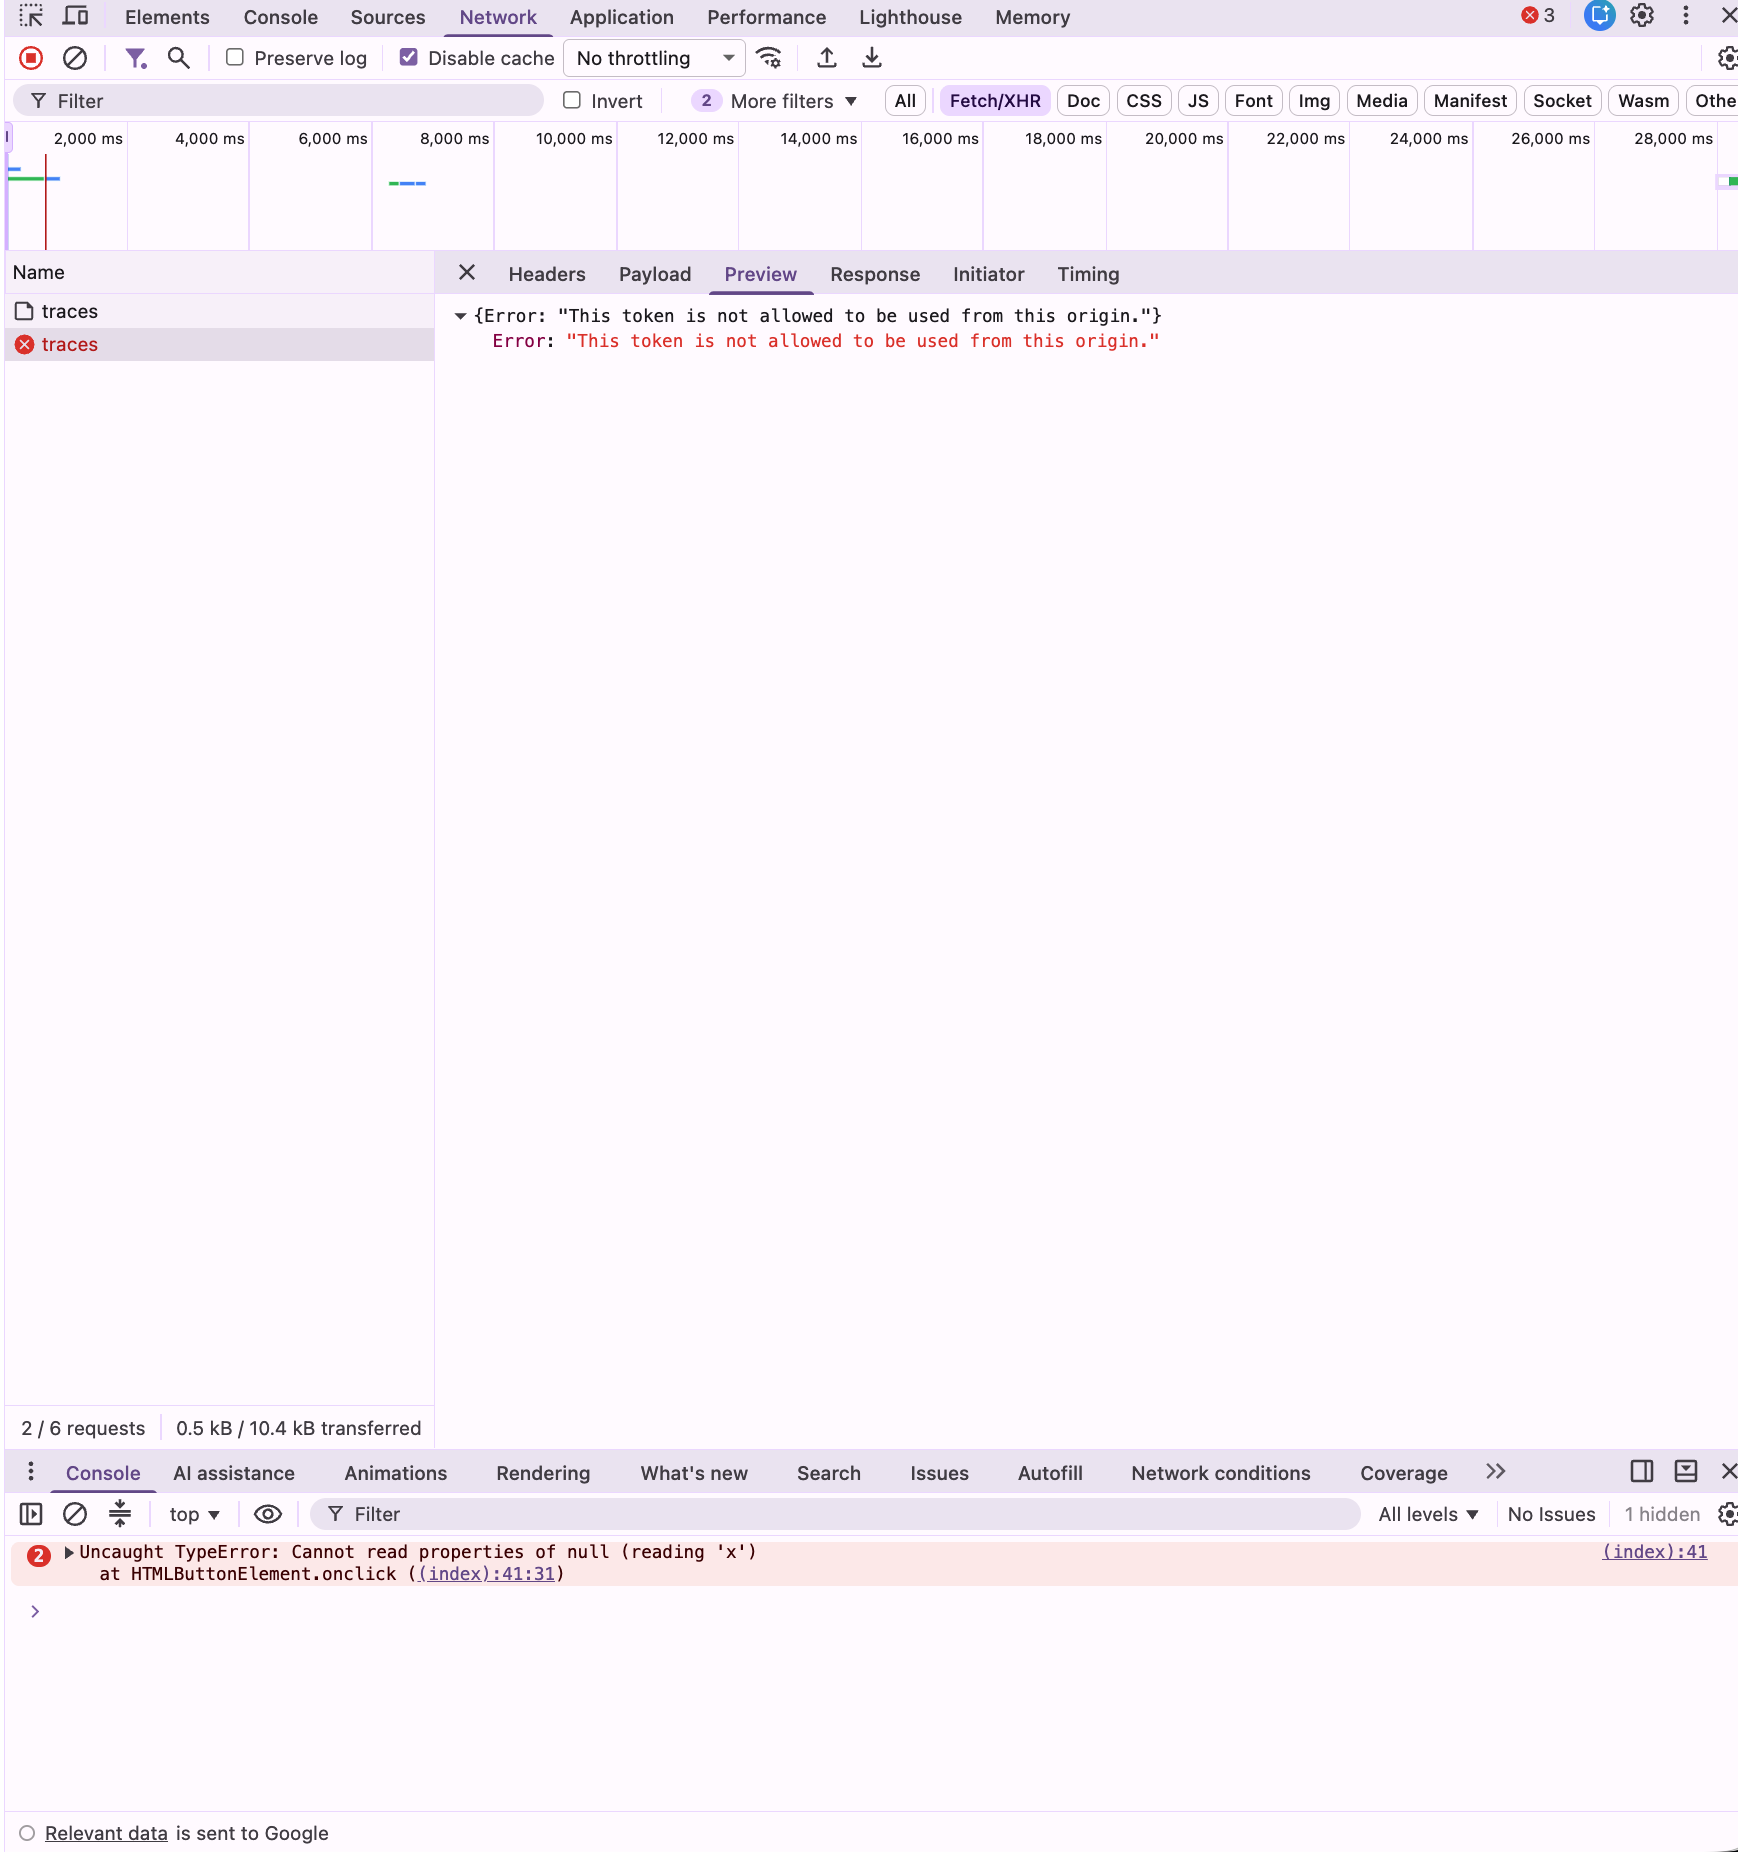
The token sits in your page source, so anyone can read it. We limit what it can do by binding it to your domains. The ingest token middleware checks this, not CORS, because CORS was never designed as an access control:
- name: rum_ingest
  type: http_ingestion_input
  allowed_origins:
    - https://acme.com
    - https://*.acme.com
After that, the token works only from a browser. The middleware rejects a request with no Origin header, because that is what a stolen token replayed from curl looks like. A wildcard covers exactly one leading host label, so https://*.acme.com matches app.acme.com but never acme.com itself, and never evilacme.com.
The script decides sampling once when a session starts and stores the decision in sessionStorage. If it decided per page view instead, you would get sessions with the middle missing. Fifteen minutes of inactivity ends a session, and four hours closes it regardless. One consequence surprises people: the script holds a view’s span open until the view ends, because CLS and INP keep changing while the visitor is still on the page. So a page nobody has left yet has not reported. The script sends errors separately, and they arrive within seconds.
Try it now
The browser script is small because the pipeline already did the rest. Page loads are spans, errors are logs, and every dashboard, monitor, CLI command, and AI teammate that read those stores before now reads RUM too. If you want to see your own pages in it, start a free trial, add the script to your <head>, and your first page loads will appear in the Traces Explorer within a few minutes.
If you work with a coding agent, it can do the setup for you. We publish an ed-browser-rum skill that covers the script tag, the Vite plugin, configuration, locking the token to your origins, React error boundaries, and the queries you run afterwards. Install it alongside the CLI skill:
npx skills add edgedelta/agent-skills \
  --skill ed-edx --skill ed-browser-rum --full-depth -y
Then ask your agent to add Edge Delta browser monitoring to your app. It reads the project, picks the right installation path, wires up the token, and can query the first page views once they arrive. The other skills in edgedelta/agent-skills cover logs, traces, dashboards, and monitors through the same CLI.