
Every engineering leader I talk to these days has the same chart in their head. The line for code written has bent sharply upward since coding agents arrived, and the line for code operated has barely moved. A small team can now ship in a week what used to take a quarter. The pager did not get any faster, the monitors did not tune themselves, and the dashboards from two reorgs ago are still there, some of them returning empty panels. The bottleneck of a software organization has moved from writing the software to operating it.
When I say operating, I do not mean the war room. Incident response is the visible part of the job, and it gets all the tooling, but it is a small share of the hours. Most of operating is peacetime work: confirming that yesterday’s fix actually held, checking that every service that paged last quarter has a monitor now, retuning the alert that fires eleven times a night, finding the dashboard widget that has been reading a field a processor dropped in March, writing the runbook for the service that has none. Every one of these makes the next incident shorter, and every one of them loses the scheduling battle to a feature, because nothing in the toolchain holds the goal for you. A monitor tells you a threshold was crossed. A workflow runs a fixed sequence of steps. Neither can hold a sentence like “every critical service has monitor coverage” and keep working toward it.
Today we are introducing Loops, standing goals your Edge Delta AI Team keeps verifying. In this post, we’ll walk through what a loop does, which loops come with the product, how a loop starts from a sentence you type or from an issue, and how the guardrails you already set decide what a loop may change.
What an immune system does on a healthy day
We describe Edge Delta as your production immune system, and the phrase is easy to hear as a promise about sick days, the antibody rushing to the infection. Most of the work of your immune system, though, happens while you feel fine. Cells patrol continuously, clear out what does not belong before it becomes a symptom, remember what they have seen, and adjust their thresholds so the next encounter is handled faster. That regulation is constant and proactive, and it makes changes while you are not looking.
That is the parallel we want for production, and loops are the mechanism that makes it true. A loop patrols on a trigger you choose, while you are shipping features, and when it finds something drifting it proposes a correction through the boundaries you set. (The boundaries are a big part of this post. We will get there.)
What does a loop do?
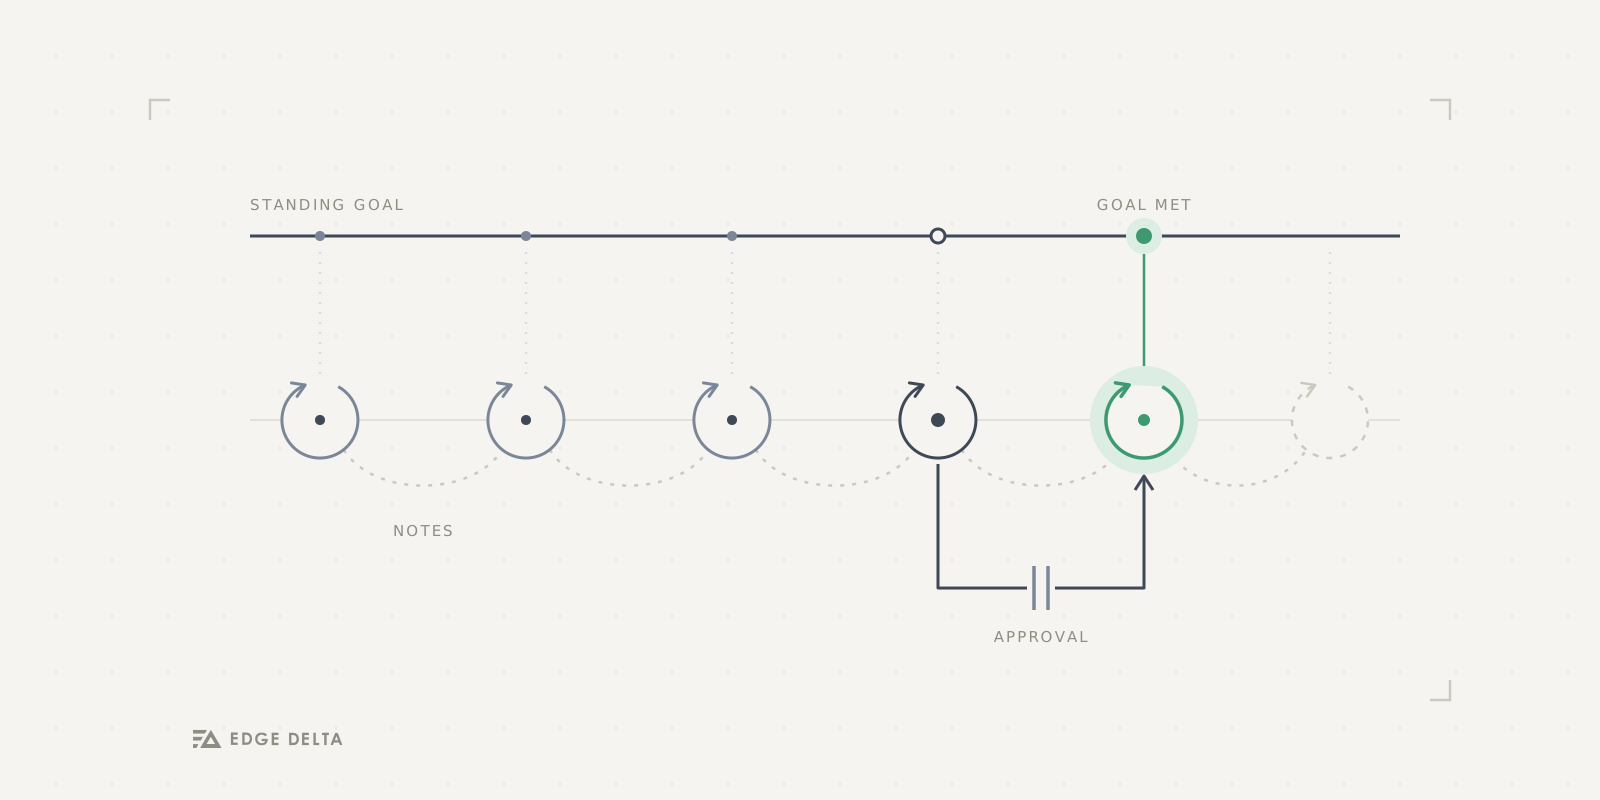
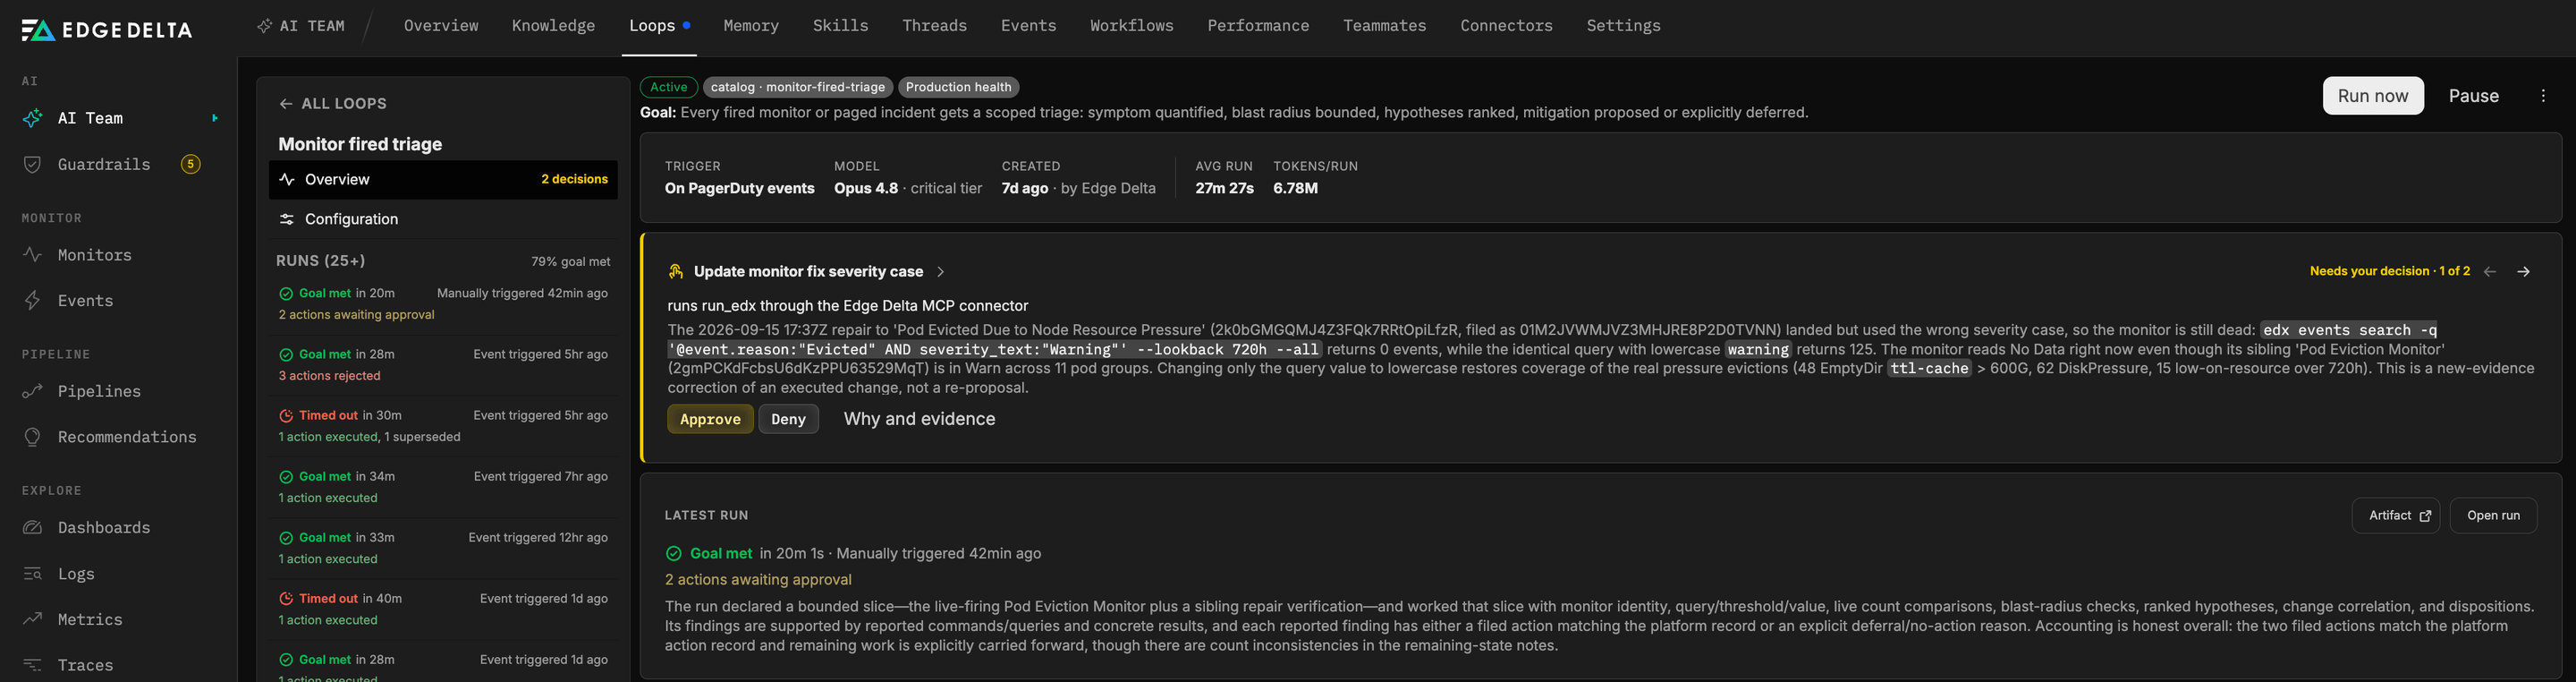
A loop holds one outcome about your production, such as “every deployment of checkout-service is verified healthy within 15 minutes,” and keeps checking it. Each time its trigger fires (a schedule, a GitHub deployment, a PagerDuty incident, a monitor), a run works through the same cycle our teammates use on an incident: detect, investigate, reason, act, verify, learn. It reads your telemetry with read-only tools first, writes a report in which every claim cites the query that produced it, files each change it wants as a proposed action, and leaves notes for the run that comes after it.
Sounds simple, right? The cycle itself was the easy part. What took us longest was deciding how a run proves it did the work, because an unattended agent that says “verified, all good” is worth nothing if you cannot see what it looked at. So every run is graded by a separate goal evaluator that did not perform the run and reads only the final report. It checks that the declared scope was actually worked, that findings are backed by shown results, that every finding has a disposition (an action, a fix, or a written reason for skipping it), and that the accounting is honest, with no padded rows and no capped counts passed off as totals. The verdict is Goal met only when all four pass, and a failed lookup never counts as proof of absence.
The notes are what make a loop feel different from a scheduled prompt. Each run ends by rewriting them: what it covered, what remains, where the next run should start, and the standing learnings such as baselines, owner mappings, and signals already confirmed as benign. A loop that has run for a month knows things about your environment that a fresh chat does not, and you can read and edit those notes yourself.
The loops that ship with the product
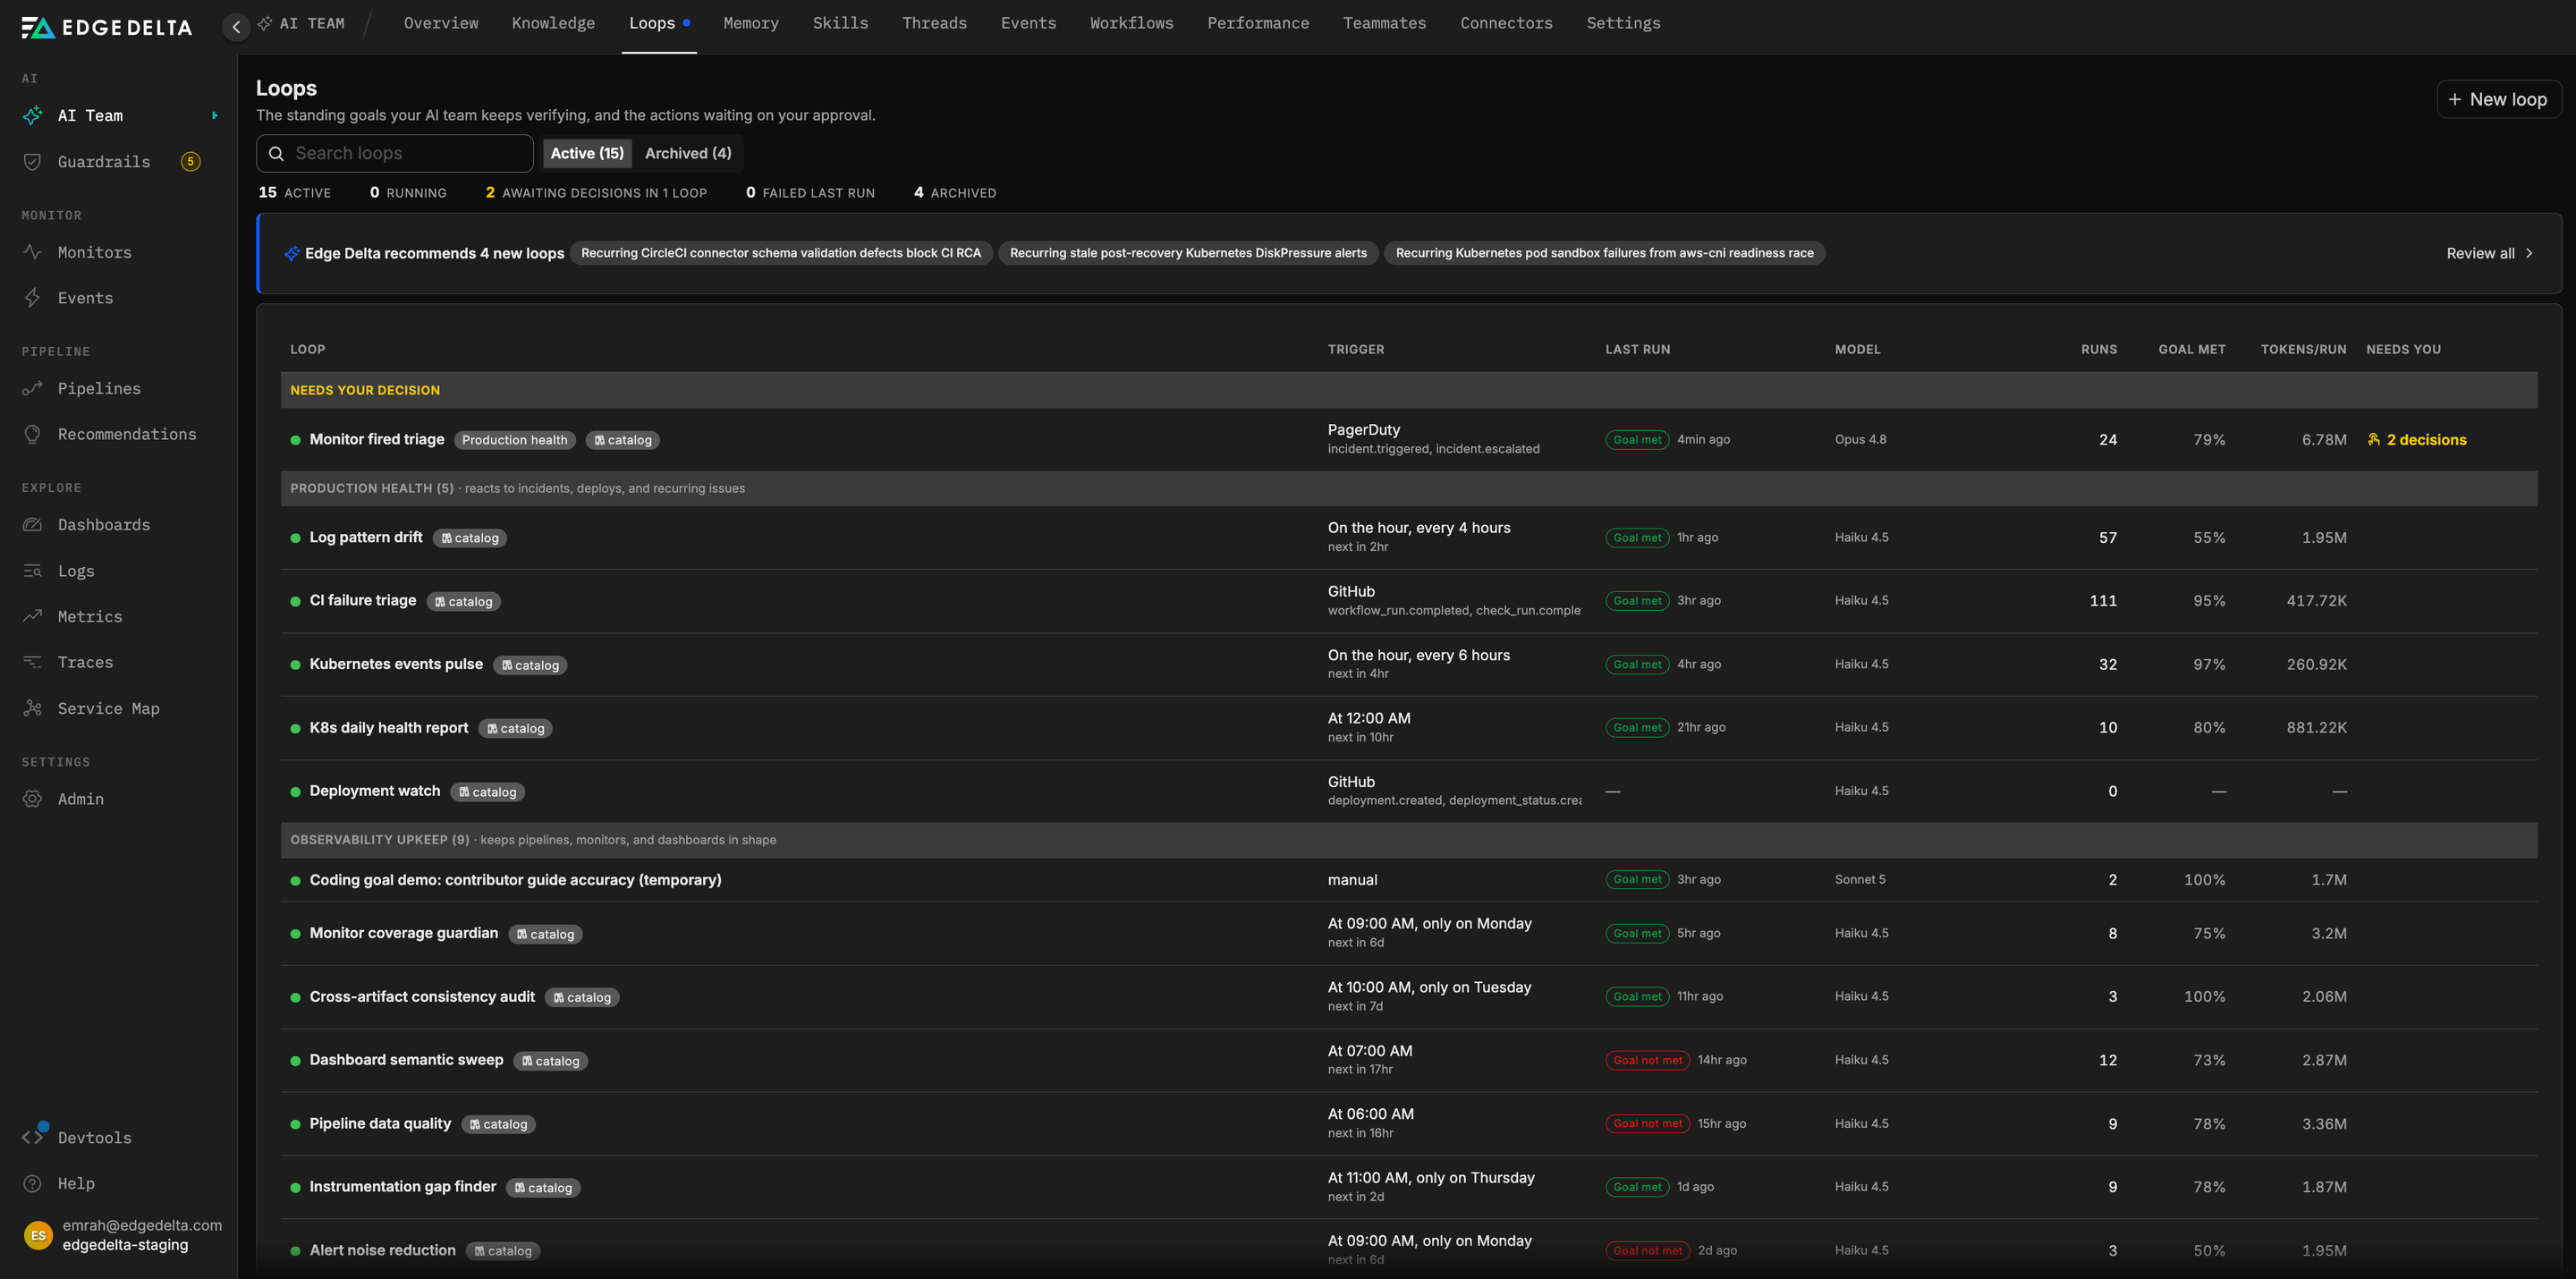
You do not have to write your first loop. Edge Delta ships a catalog of 14 loop templates, and a template activates itself the moment you connect the connector it needs. The catalog is also the clearest picture of what we mean by peacetime operating, so it is worth reading as a list of what we intend to catch.
Six templates belong to the production health class, the loops that react to what your systems and your connectors emit: deployments, CI runs, paged incidents, Kubernetes warning events, and error signatures in your logs. Connect GitHub and Deployment watch starts verifying every deployment healthy within 15 minutes, reporting on the pull request it checked. Connect PagerDuty and every paged incident gets a scoped triage (symptom quantified, blast radius bounded, hypotheses ranked) posted as incident notes while you are still opening your laptop.
Eight belong to observability upkeep, the class I am personally most excited about, because it is the work that never gets scheduled. These loops sweep your estate on a weekly or daily cadence and look for drift: critical services with no monitor, monitors that fire too often, dashboard widgets whose queries return nothing, pipeline streams with quality gaps, services with incident history and no telemetry or runbook, and teammate prompts that could use tuning. Each finding arrives with evidence and a proposal, so the Monday 09:00 coverage sweep hands you a backtested monitor to approve rather than a list of gaps to think about.
A template that needs data you do not have yet is created paused, with the reason spelled out (“0 events in the last 24h, needs 1”). Edge Delta re-checks hourly and activates it when the data arrives.
Loops you start yourself
Beyond the catalog, there are two main ways to start a loop about your own systems.
The first is to type the goal. Click New loop, describe the outcome and the cadence in your own words (“every Friday release train, verify all services in the train are healthy and compare error budgets before and after”), and click Draft loop. Edge Delta drafts the full configuration (the name, the trigger, the success criteria, the skills to follow, the instructions each run receives), explains why it chose that shape (a recurring window calls for a weekly schedule rather than an event trigger, for example), and waits. Nothing runs until you confirm. Later changes work the same way: “check every 30 minutes instead” produces a diff you approve.
The second is to start from an issue. An issue that keeps recurring, or one that looks resolved but was never verified, gets a suggested resolution loop right on the issue page. Its success criteria are the issue’s open recommended actions, re-read before every run, and its cadence follows severity: every 30 minutes for critical, every 2 hours for high, every 4 hours for medium, daily otherwise. Approving an action on the issue starts a re-verification run, and closing the issue completes the loop. Unlike the catalog loops, a resolution loop is bounded: once the issue is verified fixed, it finishes as Goal reached and moves to the Archived view on its own, and if the issue comes back, the same loop resumes. This is the loop that confirms yesterday’s fix held.
Two more origins are worth knowing. A resolved investigation thread can become a loop that re-runs its checks, with the procedure saved as a reusable skill. And a run that finds a condition nothing is watching can propose a new loop, which lands in Suggested loops and waits for you.
Bounded by the guardrails you already set
The metaphor has a limit worth stating. A biological immune system acts without asking, and sometimes it attacks the wrong thing. A loop acts only as far as the Guardrails you configured before loops existed allow it to, and asks for everything beyond that.
Every change a run wants to make is filed as a proposed action carrying its domain (deployments and infrastructure, monitors and incidents, and so on), and the trust gate resolves it against the effective trust level for that domain: your account-wide level, adjusted by any per-domain override, and forced to L0 if you have frozen autonomy. At L0 and L1 the action appears in the report as a recommendation. At L2 the artifact is drafted but not applied. At L3 it waits for a person, and at L4 it executes and you are notified. Two safeguards hold even at L4: an action whose validation failed is queued for approval instead of running, and an action that fails during unattended execution drops back to the queue so someone looks at it.
Actions waiting on you appear in the same Guardrails approval queue as everything else, with a Loop badge, and each one shows why the run proposed it, the predicted effect, the validation result, and exactly what executes when you click Approve. A queued action stays decidable for 72 hours, after which the evidence is considered stale and the next run has to re-propose with fresh data. Execution happens once and is never retried automatically (a half-applied change followed by a second attempt is how you end up with two rollbacks). And approving is not the end of it: after a remediation executes, the loop runs again, because recovery has to show up in the data before the loop treats the problem as handled.
So the immune system works on its own exactly as far as you have let it, per domain. A team that trusts loops with monitors and dashboards but wants a human on every deployment rollback can set that with two overrides, and the loops will behave accordingly without being told.
Why this is what rethink observability means
Observability tooling was designed for the war room. Dashboards to stare at while something is broken, alerts to page you, search to test a hypothesis at 3am. The first wave of AI in this space took the same shape and added speed: an agent that chases hypotheses through your logs faster than you can. We built that too, and it is useful.
Loops put the model to work in the peaceful times, where there is time to gather real evidence, backtest a monitor change before proposing it, sweep every dashboard rather than the one on screen, and remember what was found last week. That is the version of rethink observability we mean. The telemetry is already flowing through Edge Delta, the teammates already reason over it, and loops give them standing goals so that the quiet weeks are when most of the operating gets done, and the incidents that still happen arrive at a system that has been preparing for them.
Wrapping up
The bottleneck moved from writing software to operating it, and most of operating is peacetime upkeep that never gets scheduled. Loops are standing goals your AI Team keeps verifying: 14 come with the product and activate on their own, the rest start from a sentence you type or an issue that keeps returning. Every run is graded by an evaluator that did not perform it, and every change passes through the trust level you already set, account-wide and per domain.
Loops are live today in every Edge Delta organization. Open the Loops page under AI Team to see which catalog loops are already running for you, or activate the agents on a fresh account and connect GitHub to watch the first Deployment watch run come in.