Reduce observability costs and gain total control over your data. Edge Delta processes your data as it's created and gives you the freedom to route it anywhere.
🤖 Meet OnCall AI, our observability copilot that makes troubleshooting easy. Read announcement.

- Home
- Product Overview
- Observability Pipelines
Observability Pipelines
Reduce Spending and Enhance Visibility
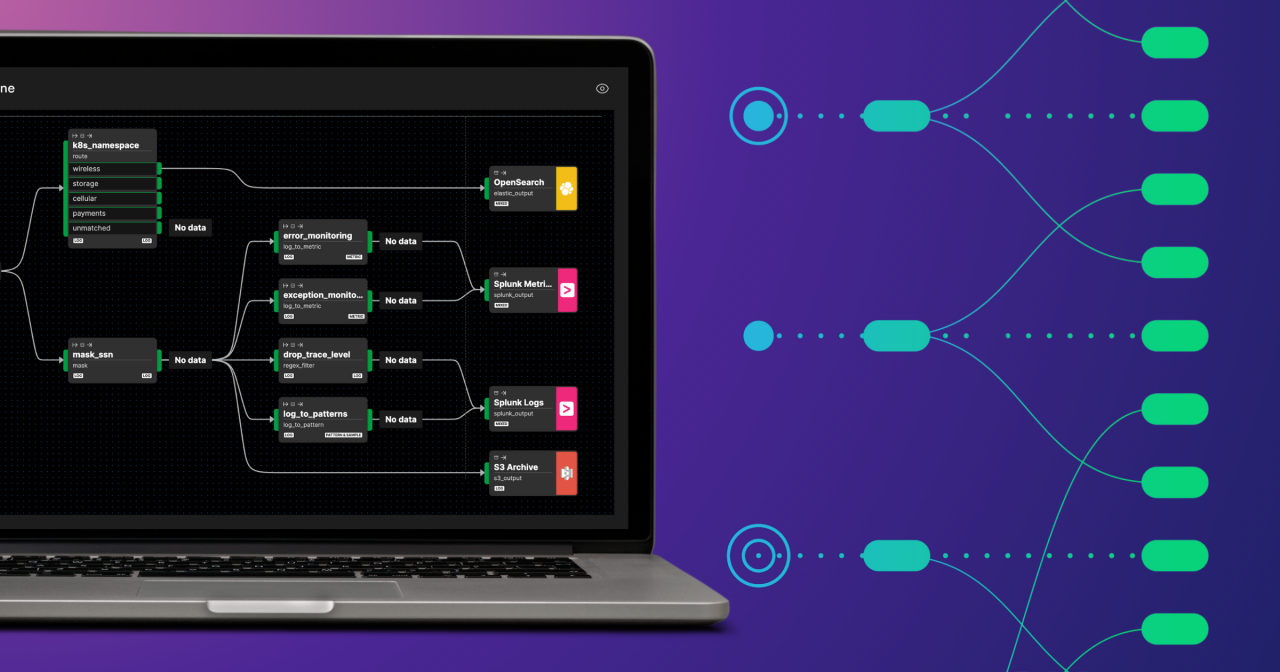
Route different subsets of data to different destinations to optimize costs. Tier data across observability tools, cost-effective log search platforms, and archive storage.
Gain visibility into any amount of data without going over budget. Edge Delta analyzes data upstream, providing insight into logs you don't index raw.
Trim unnecessary fields from your loglines to reduce the verbosity of your data.

Improve Data Quality and Usability
Shape, enrich, and analyze data to maximize data usability and visibility. Edge Delta provides 20+ pre-built processors to help you control your data.
Easily standardize your data format. Edge Delta generates Open Telemetry compatible logs by default. This feature enables you to re-format your log data without changing application code.
Enrich log events with data from other sources. Easily add information to your logs to add context and streamline correlation.
Build and Manage Pipelines Visually
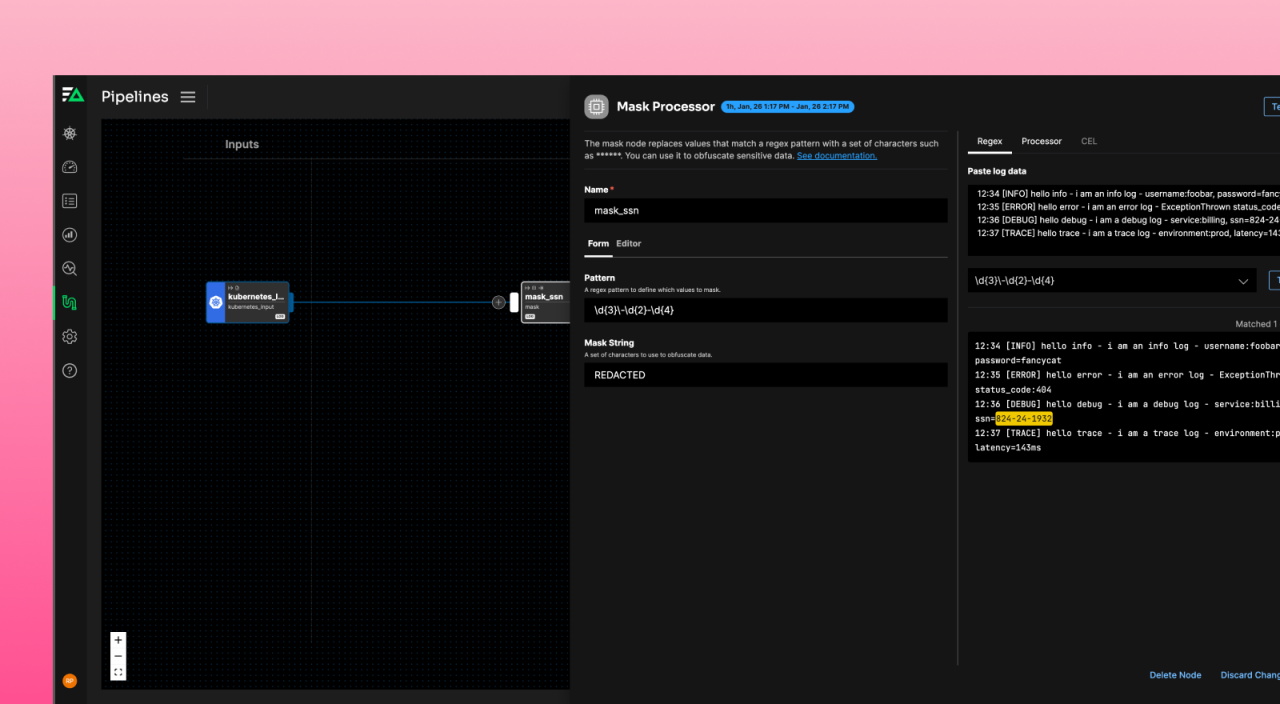
Build, test, and monitor observability pipelines visually – not using complex config files. Edge Delta offers a point-and-click interface to manage observability pipelines.
Test and iterate on your pipelines before deploying to production. Edge Delta provides a “before and after'' of your data to see the impact of each step of the pipeline.
Enable developers to build pipelines self-service. Edge Delta provides granular role-based access control (RBAC). Plus, your team can understand every available processor and learn best practices as they build.
See Edge Delta in Action
Meet with an Edge Delta expert to learn how you can reduce observability TCO.
Fama Reduces Observability Spend by 60%
Frequently Asked Questions
How is Edge Delta different from other observability pipelines?
Edge Delta is different than other observability pipelines providers for a few reasons.
First is our distributed architecture. Edge Delta processes 100% of your log data at the agent level. In other words, there is no central infrastructure bottleneck for data needs to pass through. Stream processing data at the source enables unmatched scalability and performance.
Second is our Visual Pipelines capabilities. We provide a single, point-and-click interface to build, test, and monitor telemetry pipelines. By using Visual Pipelines, you can avoid using complex YAML files and achieve developer self-service.
Third is artificial intelligence running at the agent. Edge Delta uses AI to detect known and unknown anomalies. Now, you can trigger alerts faster – without defining specific alert conditions and thresholds.
What third parties does Edge Delta integrate with?
Edge Delta offers 50+ integrations, including observability providers like:
Datadog
Dynatrace
Elastic
Grafana
New Relic
Splunk
Sumo Logic
…and more
See all integrations here.
How does Edge Delta process log data upstream?
Edge Delta provides a growing number of out-of-the-box processors. These processors help you analyze, shape/transform, and otherwise control data. Here are some of our most popular processor nodes:
Regex Filter streams data through the pipeline that meets the filter criteria.
Log Transform node reshapes log data as it passes through Edge Delta.
Log to Metric node extracts monitoring KPIs from your log data.
Log to Pattern node clusters together similar or recurring log events.
Enrichment node enables you to add relevant information to your logs from third-party sources.
Mask node helps you obfuscate sensitive information and reduce the verbosity of your data.
You can see the full list of processors here.
What’s the performance impact of running Edge Delta’s agents?
The Edge Delta Agent has benchmarks of 2% CPU and 78MB of RAM consumed when processing 1,000 events per second. This makes it one of the most performant agents in the market.
Note: the Edge Delta agent handles log collection and forwarding, data processing, AI/ML anomaly detection, and pattern recognition. Most others only handle log collection and forwarding.
You can read the full agent performance benchmarks here.
Additional Resources

The Edge Delta Observability Architecture
Curious how Edge Delta's architecture works? Learn all about our distributed approach.

How to Reduce Observability Costs
Actionable tips to reduce TCO without losing insight into log data.

Complete Guide to Pipelines
Take a deep dive into observability pipelines and learn how they're used in practice.
Ready to Take the Next Step?
Learn more about our use cases and how we fit into your observability stack.