When Edge Delta began, our founders experienced the challenges of unbounded observability data growth firsthand. They set out to solve these challenges with what we now refer to as “observability pipelines” (sometimes called “telemetry pipelines”).
So, what is an observability pipeline? An observability pipeline is a data management tool that helps you:
- Collect MELT (metrics, events, logs, and traces) data from multiple sources
- Pre-process that data – e.g., transform, enrich, and analyze
- Route that data to multiple destinations, including observability tools, log management platforms, SIEMs, and storage targets
Typically, teams use telemetry pipelines to either reduce observability TCO or improve data quality across teams. While observability pipelines can support all different data types, they’re most commonly used to control large amounts of log data. In the article that follows, we’ll cover the challenges this technology solves at a deeper level, the components of a pipeline, and how it is used in practice.
Challenges in Observability: Why Do Teams Need a Pipeline?
Observability is Becoming Cost-Prohibitive
Log data has grown 5x, on average, over the past three years. We attribute this growth to several factors, including:
- Cloud migrations: Migrations to the public cloud create vast amounts of log data due to the increased scale and complexity of the environment.
- Containerized applications and microservices: Log volumes spike when you adopt microservices due to their temporary nature and the fact that you’re capturing data from thousands of containers versus a few monolithic servers.
- Digital-first customer experiences: As the saying goes, every company is a software company now, and each digital asset creates log data.
- APIs: Data from APIs is critical for fast development cycles of new software applications.
Telemetry data growth is problematic because observability platforms become more expensive as you ingest more data. This dynamic persists across all pricing models:
| Pricing Model | Charge Based On | Outcome |
|---|---|---|
| Data volume-based pricing | Volume of data you ingest and index into the platform. | Costs scale linearly with the volume of data you create. |
| Compute-based pricing | Compute consumption when querying your datasets. | Querying larger datasets drives up compute consumption, leading to more spend. |
| Host or node-based pricing | Number of physical or virtual OS instances you collect data from. | Distributed environments equate to a larger number of hosts and higher costs. |
According to GartnerⓇ, “the cost and complexity associated with managing this data can be more than $10 million/year in large enterprises”1.
Moreover, it’s worth noting that not all data is of equal value. Many teams ingest large quantities of telemetry data that go unused into their observability platform, diminishing the cost-to-value ratio. 84% of DevOps and SRE professionals agree that the ROI of observability has not grown at the same rate as costs.
How Have Teams Tried Reducing Observability Costs?
Until now, teams have adopted different strategies to limit the amount of log data they ingest in their observability platform. Typically, teams will leverage multiple tactics, hoping to capture the data they need while driving down costs. These tactics include the following:
| Event Type | Description |
|---|---|
| Dropping events | 100% of this data type is discarded. |
| Sampling events | 1 out of every N of this data type is delivered, the rest are discarded. |
| Dynamic sampling | Low-volume data of this data type is delivered at 100%. As volume increases, the percentage of dropped data increases. |
| Suppression | No more than N copies of this data type are delivered per unit of time. |
| Parsing + trimming events | Removing unnecessary, unwanted, or overly verbose parts of an event. |
In addition to the strategies listed above, 30% of DevOps and SRE professionals state that they omit data randomly.
Teams have seen different levels of success when using these strategies. However, there is a more significant challenge: data volumes continue to grow. As a result, teams continue discarding a larger volume of data as they scale, introducing risk to their observability practice. Moreover, these strategies force you to foresee which data you’ll need and which you are safe to omit – a difficult task that creates blindspots for your team no matter how accurate you are.
So, what’s the solution to mitigate unbounded data growth? An observability pipeline.
How Does an Observability Pipeline Work?
At a high level, an observability pipeline consists of three components: inputs, processors, and outputs. In this section, I’ll walk through what each component does in a pipeline implementation.
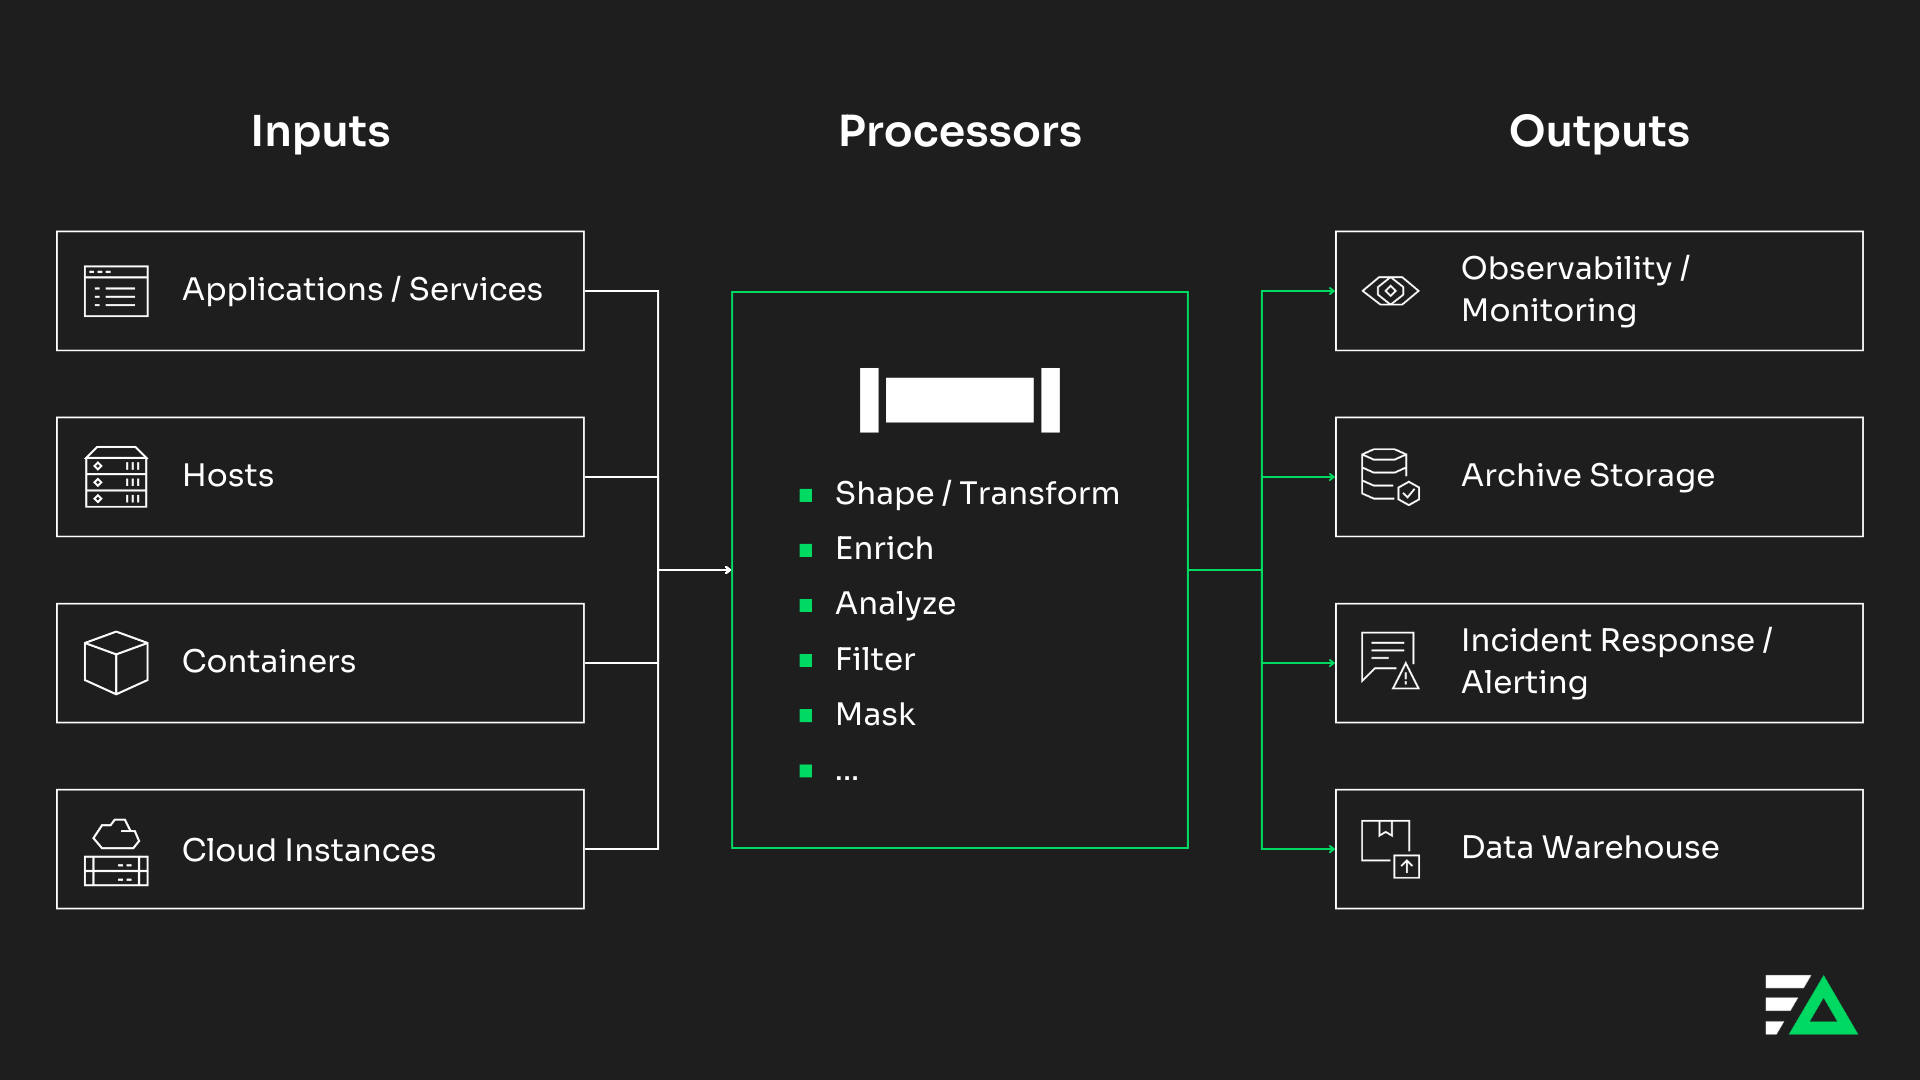
Inputs
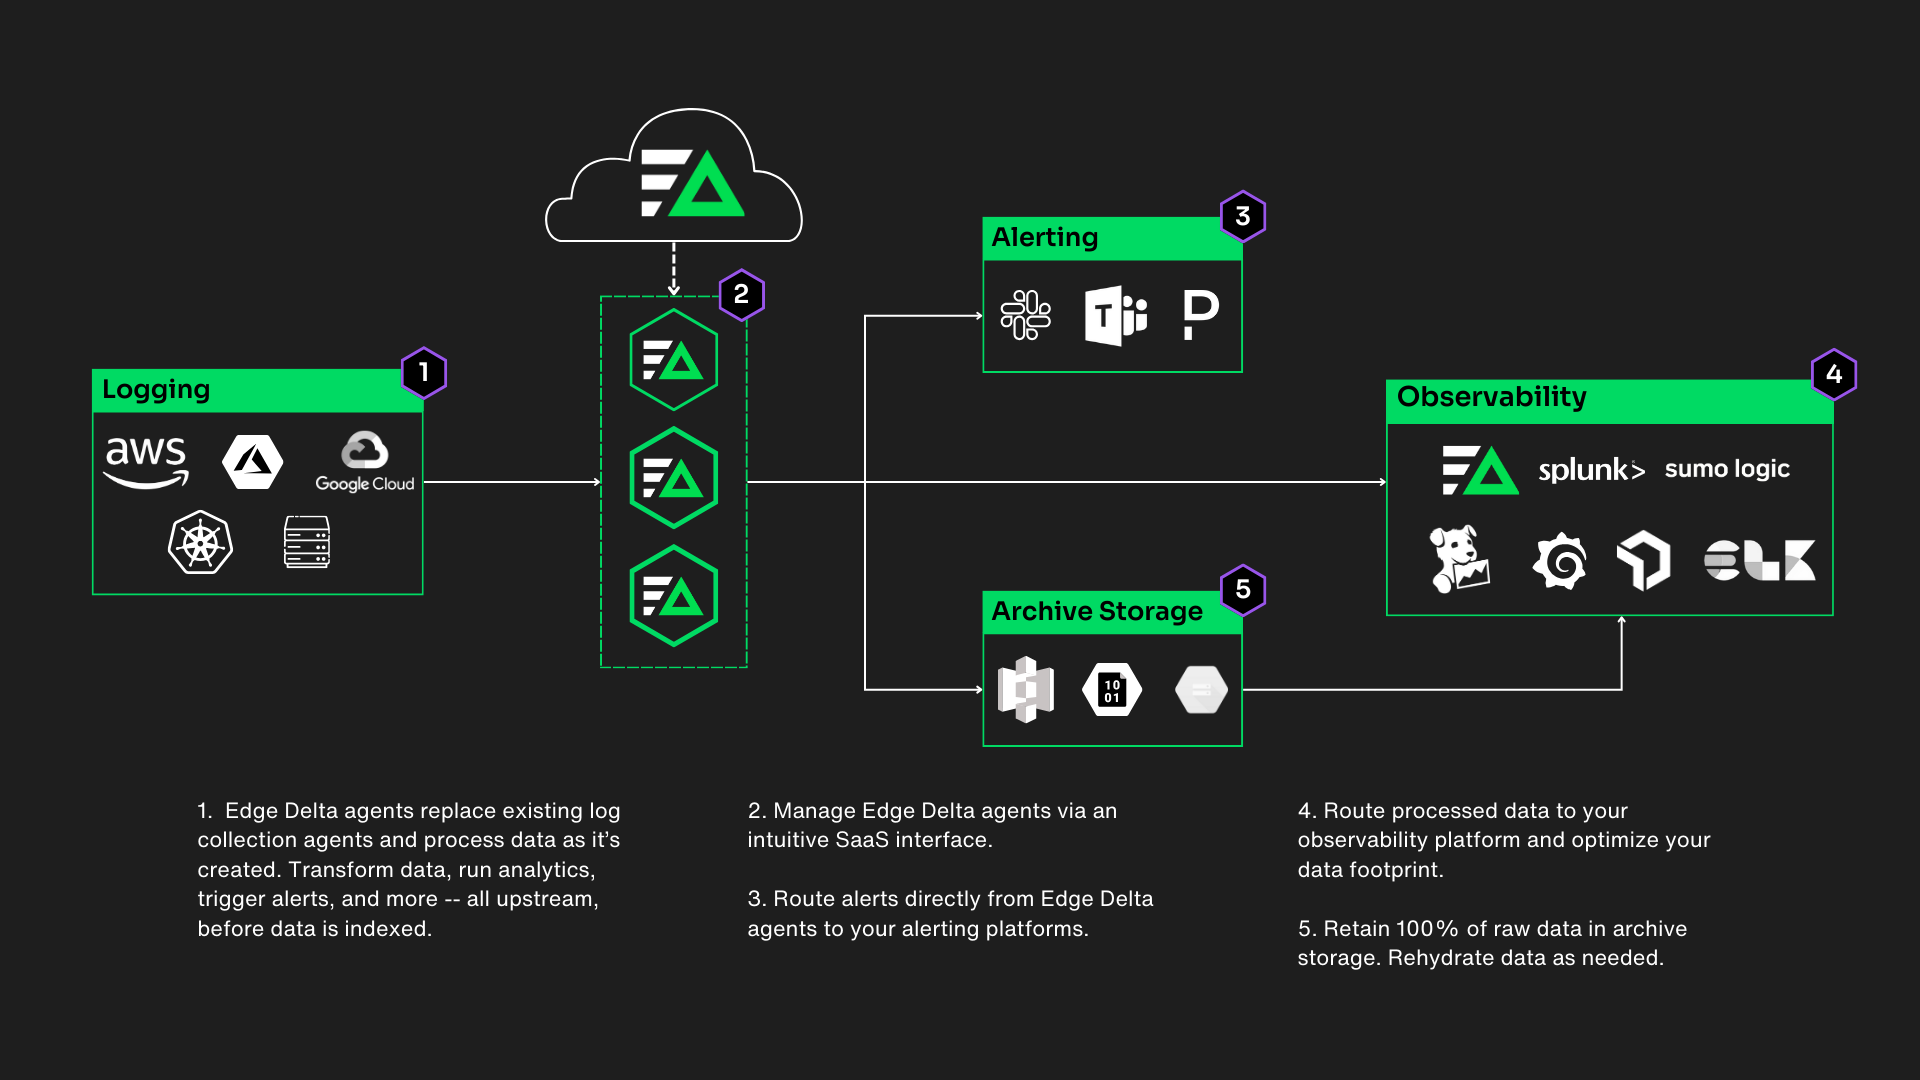
Inputs are typically your computing resources. A telemetry pipeline runs on your compute resources – or as close to where data is created as possible – in place of data collection and forwarding agents. In other words, you would replace a FluentBit agent or a Splunk Universal Forwarder with your observability pipeline agent. As a result, you can consolidate data collection agents and process your data as it’s created at the source.
In some situations, you may not own the resource that is creating telemetry data. For example, you may capture content delivery network (CDN) or load balancer logs. In these situations, you can deploy a hosted agent that collects forwarded data from these resources.
Note: Some vendors run on dedicated hardware or in a vendor-managed cloud. You will continue feeding your pipeline via third-party data collection agents, shippers, and forwarders in these scenarios.
Processors
Processors are the computing functions that handle data processing in your observability pipeline. By using processors, you can reduce the size of your data, reshape or transform it, standardize it, or extract insights. Here are some common processors used in a telemetry pipeline.
- Filter: Passes through only data that meets the filter criteria.
- Shape/Transform: Reshapes or re-formats log data as it passes through your pipeline.
- Log-to-Metric: Extracts metrics from your log data that you can monitor in downstream tooling.
- Log-to-Pattern: Clusters together repetitive or similar loglines into patterns.
- Enrich: Adds relevant information from third-party sources for easier navigation in your observability platform.
- Mask: Obfuscates sensitive information in your log data. You can also use a mask processor to reduce the verbosity of your data.
In essence, pushing data processing upstream gives you more control over the size and format of your data footprint. As a byproduct, you can reduce the cost of observability and monitoring without merely discarding data.
The cost savings you realize depends on how you process the data. If you convert all your logs into metrics or patterns, you can reduce costs by over 90%. However, in practice, your team likely needs access to raw data in some fashion. The most likely outcome is that you’ll use all the processors above on different subsets of data, leading to a 40-60% reduction in total costs.
Outputs
Outputs indicate where you route data after it passes through the telemetry pipeline. Typically, outputs consist of three resources:
- Observability platforms: Ingest processed data into your observability platform to support monitoring and troubleshooting.
- Storage targets: Route a copy of raw data to a lower-cost storage destination to meet compliance requirements or to rehydrate later.
- Alerting tools: Sends alerts directly from your observability pipeline to the platform where your team consumes alerts.
One of the advantages of using an observability pipeline is that you can route data to multiple destinations. In other words, you no longer need a dedicated agent for each observability/analytics platform your team uses.
Multi-vendor routing is most useful for enterprise companies, where different teams use different platforms. For example, perhaps your developers use Datadog, your security team uses Splunk, and your infrastructure team uses Amazon CloudWatch.
Moreover, shipping data to different destinations enables you to support a multi-vendor data tiering strategy. Here, you would determine how your team uses each dataset, dividing them into at least three tiers. From there, you can route the different tiers to unique destinations based on your use case and desired cost efficiencies.
| Data Tier | Use Case | Destination |
|---|---|---|
| Tier 1 | Data that is frequently searched or needed for real-time analytics. | Primary observability platform |
| Tier 2 | Data that you search ad hoc/irregularly. | Lower-cost log search platform |
| Tier 3 | Data that you need for compliance. | Archive storage |
Leveraging a data tiering strategy enables more dramatic cost savings than using processors alone. You can potentially move Tier 2 data to a $0.20 per GB destination.
Areas of Differentiation
While inputs, processors, and outputs are consistent across all telemetry pipelines, a few functionalities can differentiate an observability pipelines provider. In this section, we’ll briefly touch on those capabilities.
Visual Management Pane
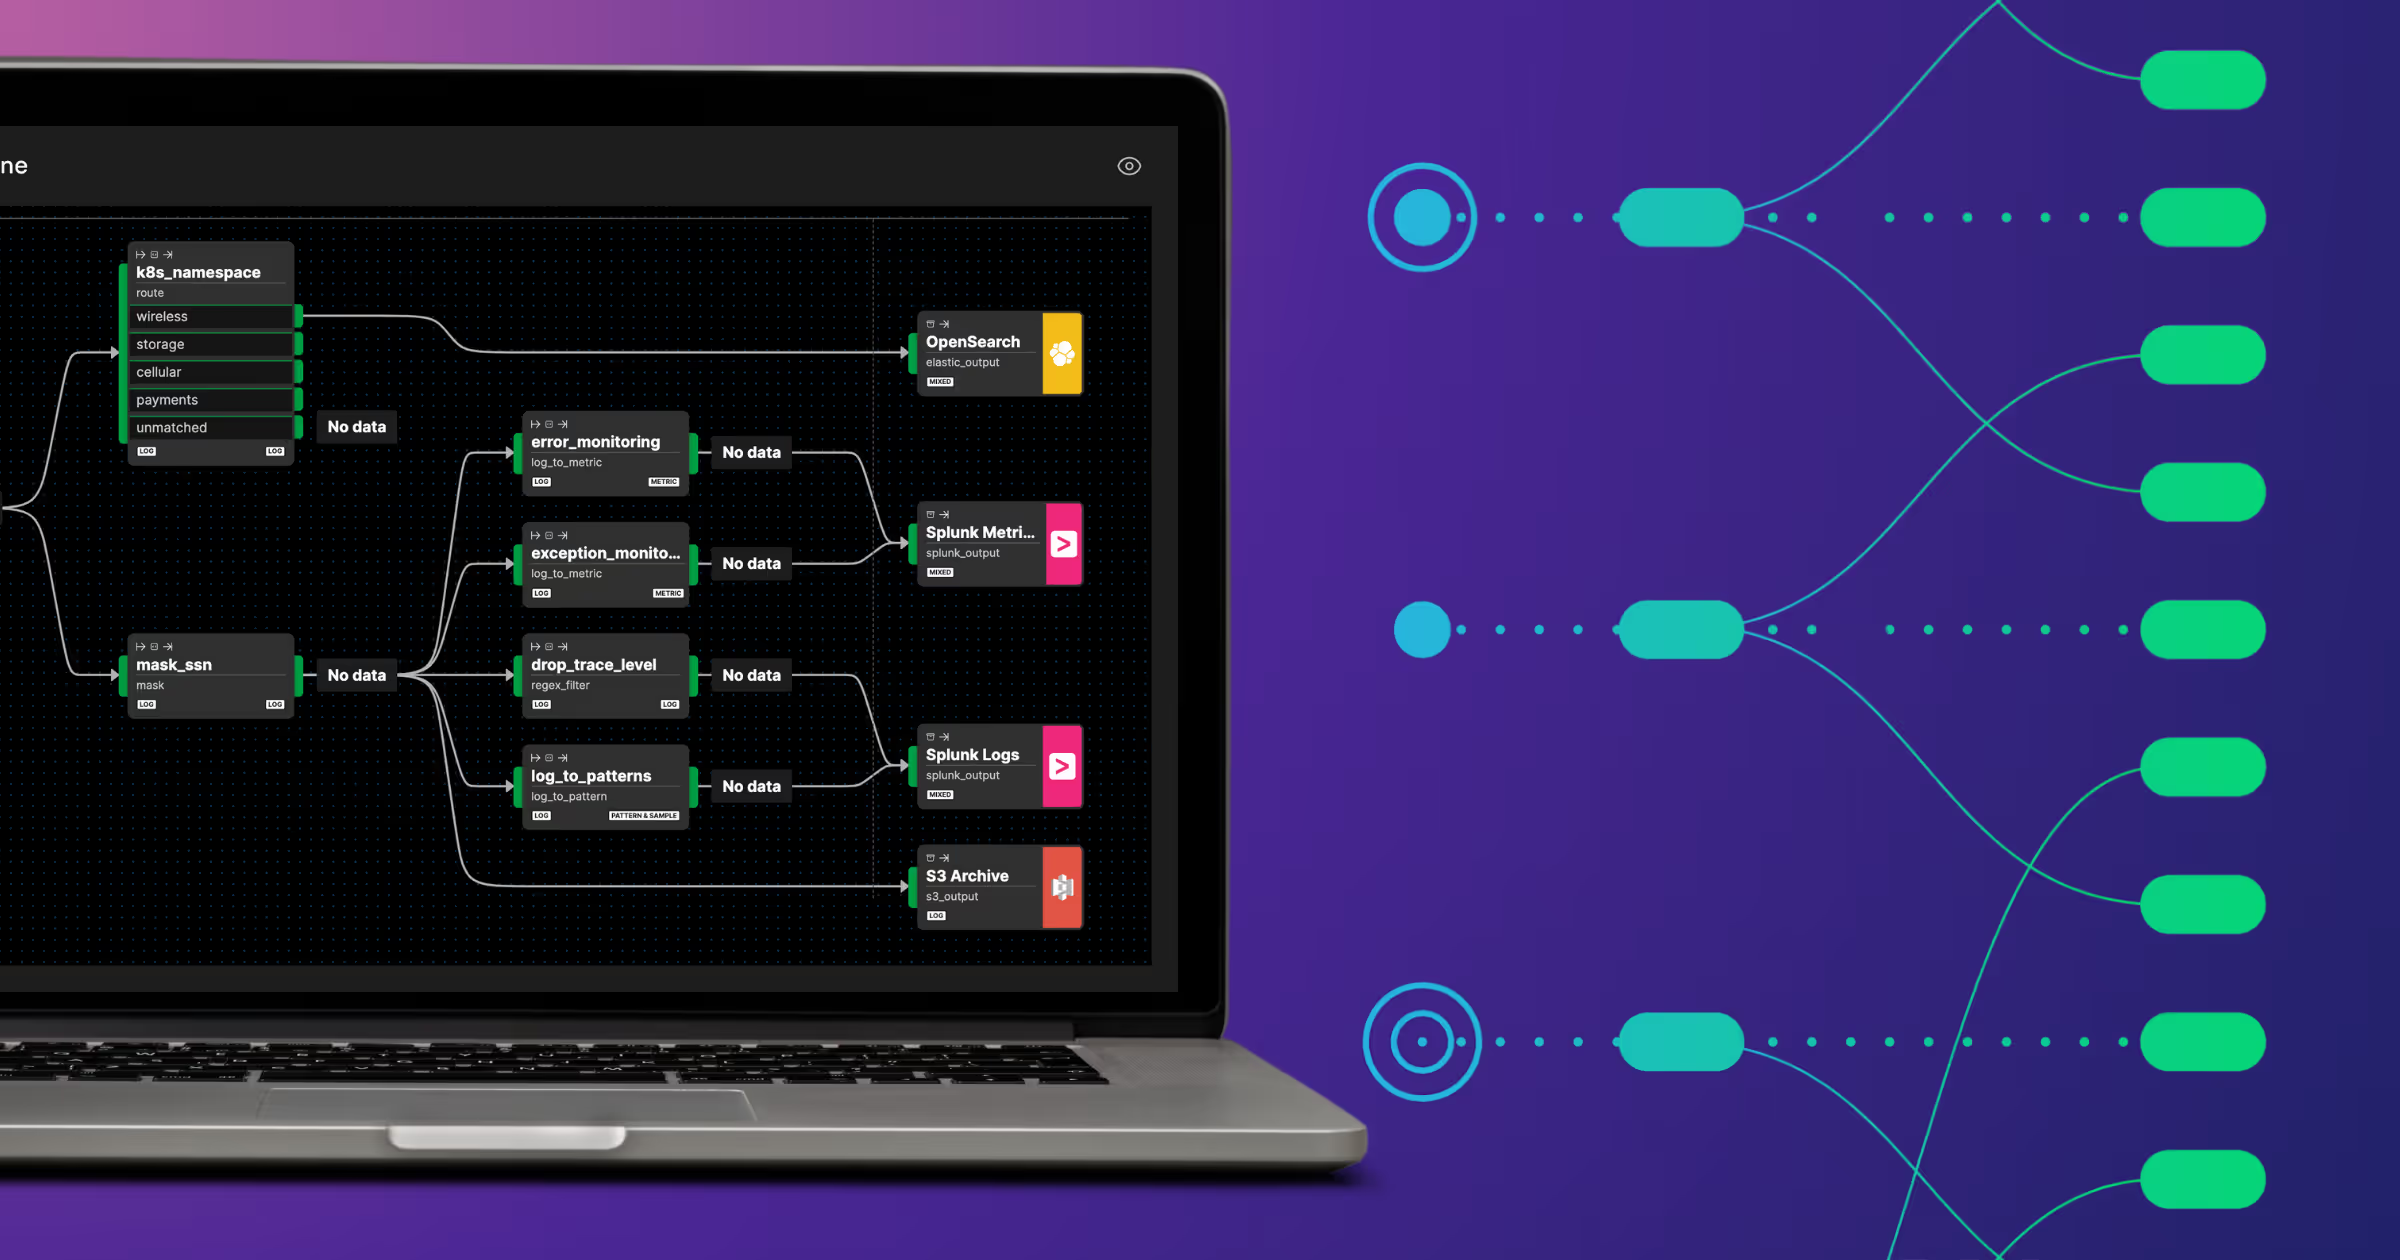
Observability pipelines can distinguish themselves in the market by offering a graphical user interface (GUI) to configure and manage pipelines visually.
Often, users interact with observability pipelines using YAML files alone. While it’s possible to create pipelines using YAML files, this setup becomes complex to manage when you are processing terabytes or petabytes of data daily.
It can be challenging to replicate pipelines across teams or drive self-service across the organization. Therefore, it is a significant advantage to have a visual management pane.
Machine Learning
All observability pipeline providers deliver processors to manipulate data passing through it. One can further differentiate by running analytics and creating real-time insights at the pipeline level.
The advantage of machine learning is that it can help you detect abnormal behaviors that may need to be investigated. By detecting these upstream, you can trigger alerts faster.
Additionally, because it is enabled by machine learning – your team does not have to anticipate the issue and build a custom monitor to alert on it.
Open Telemetry-Native
The market overwhelmingly wants to embrace Open Telemetry (or “OTel”). However, transitioning to Open Telemetry requires cross-functional buy-in and teams to re-instrument application code. Thus, it is difficult to make the transition.
An OTel-native observability pipeline can automatically reshape your data into the Open Telemetry schema. Your team can adopt the open standard for their telemetry data, enabling greater flexibility – all without spending cycles on a complex migration.
Closing Thoughts
Observability pipelines solve an important problem – they make observability cost-effective without impacting the engineering workflow. In other words, they make it possible to contain costs without removing valuable data that may be needed to detect or resolve an incident.
GartnerⓇ predicts that “by 2026, 40% of log telemetry will be processed through a telemetry pipeline product, an increase from less than 10% in 2022”1.
At Edge Delta, we’re proud to be on the cutting edge of this space and help our customers see early returns from observability pipelines.
- Gartner, Innovation Insight: Telemetry Pipelines Elevate the Handling of Operational Data, Published 20 July 2023 https://www.gartner.com/document/4549899?ref=solrAll&refval=385958674& GARTNER is a registered trademark and service mark of Gartner, Inc. and/or its affiliates in the U.S. and internationally and is used herein with permission. All rights reserved.