

As the lead product manager for Edge Delta’s AI Teammates, I’ve watched a lot of AI agents trying to get to the bottom of production issues in the last 6 months, both in our own demos and in the hands of customers. Across all of them, what was consistently clear is that the quality of investigation increases as the agent can do more iteration on observability data. Model quality and prompt engineering matter less than I originally expected (That said, after Claude Opus 4.5 and GPT 5.2, we subjectively saw much better investigations).
That framing matters, because most observability platforms constrain agents in two specific ways, and those constraints compound under incident pressure.
What actually constrains agents
The first constraint is at the API. When the platform only exposes pre-defined tools with fixed return schemas, the agent can only ask the questions those tools were designed to answer. That works for shallow lookups like “what is the error rate on service X in the last hour.” It falls apart the moment the agent needs to ask something the tool designer didn’t anticipate. In that case, the agent has to chain multiple tool calls, apply whatever filtering the tools happen to support, and stitch the partial results back together in context.
The second constraint is the context window. The model holds the data and its own reasoning in the same window, so there is a direct trade-off between how much data the agent pulls in and how much room is left for it to actually think. After a certain point, pulling another thousand rows of logs doesn’t buy you much.
Under incident pressure, these two constraints compound. The agent runs out of room before it runs out of hypotheses to test.
What iteration freedom actually looks like
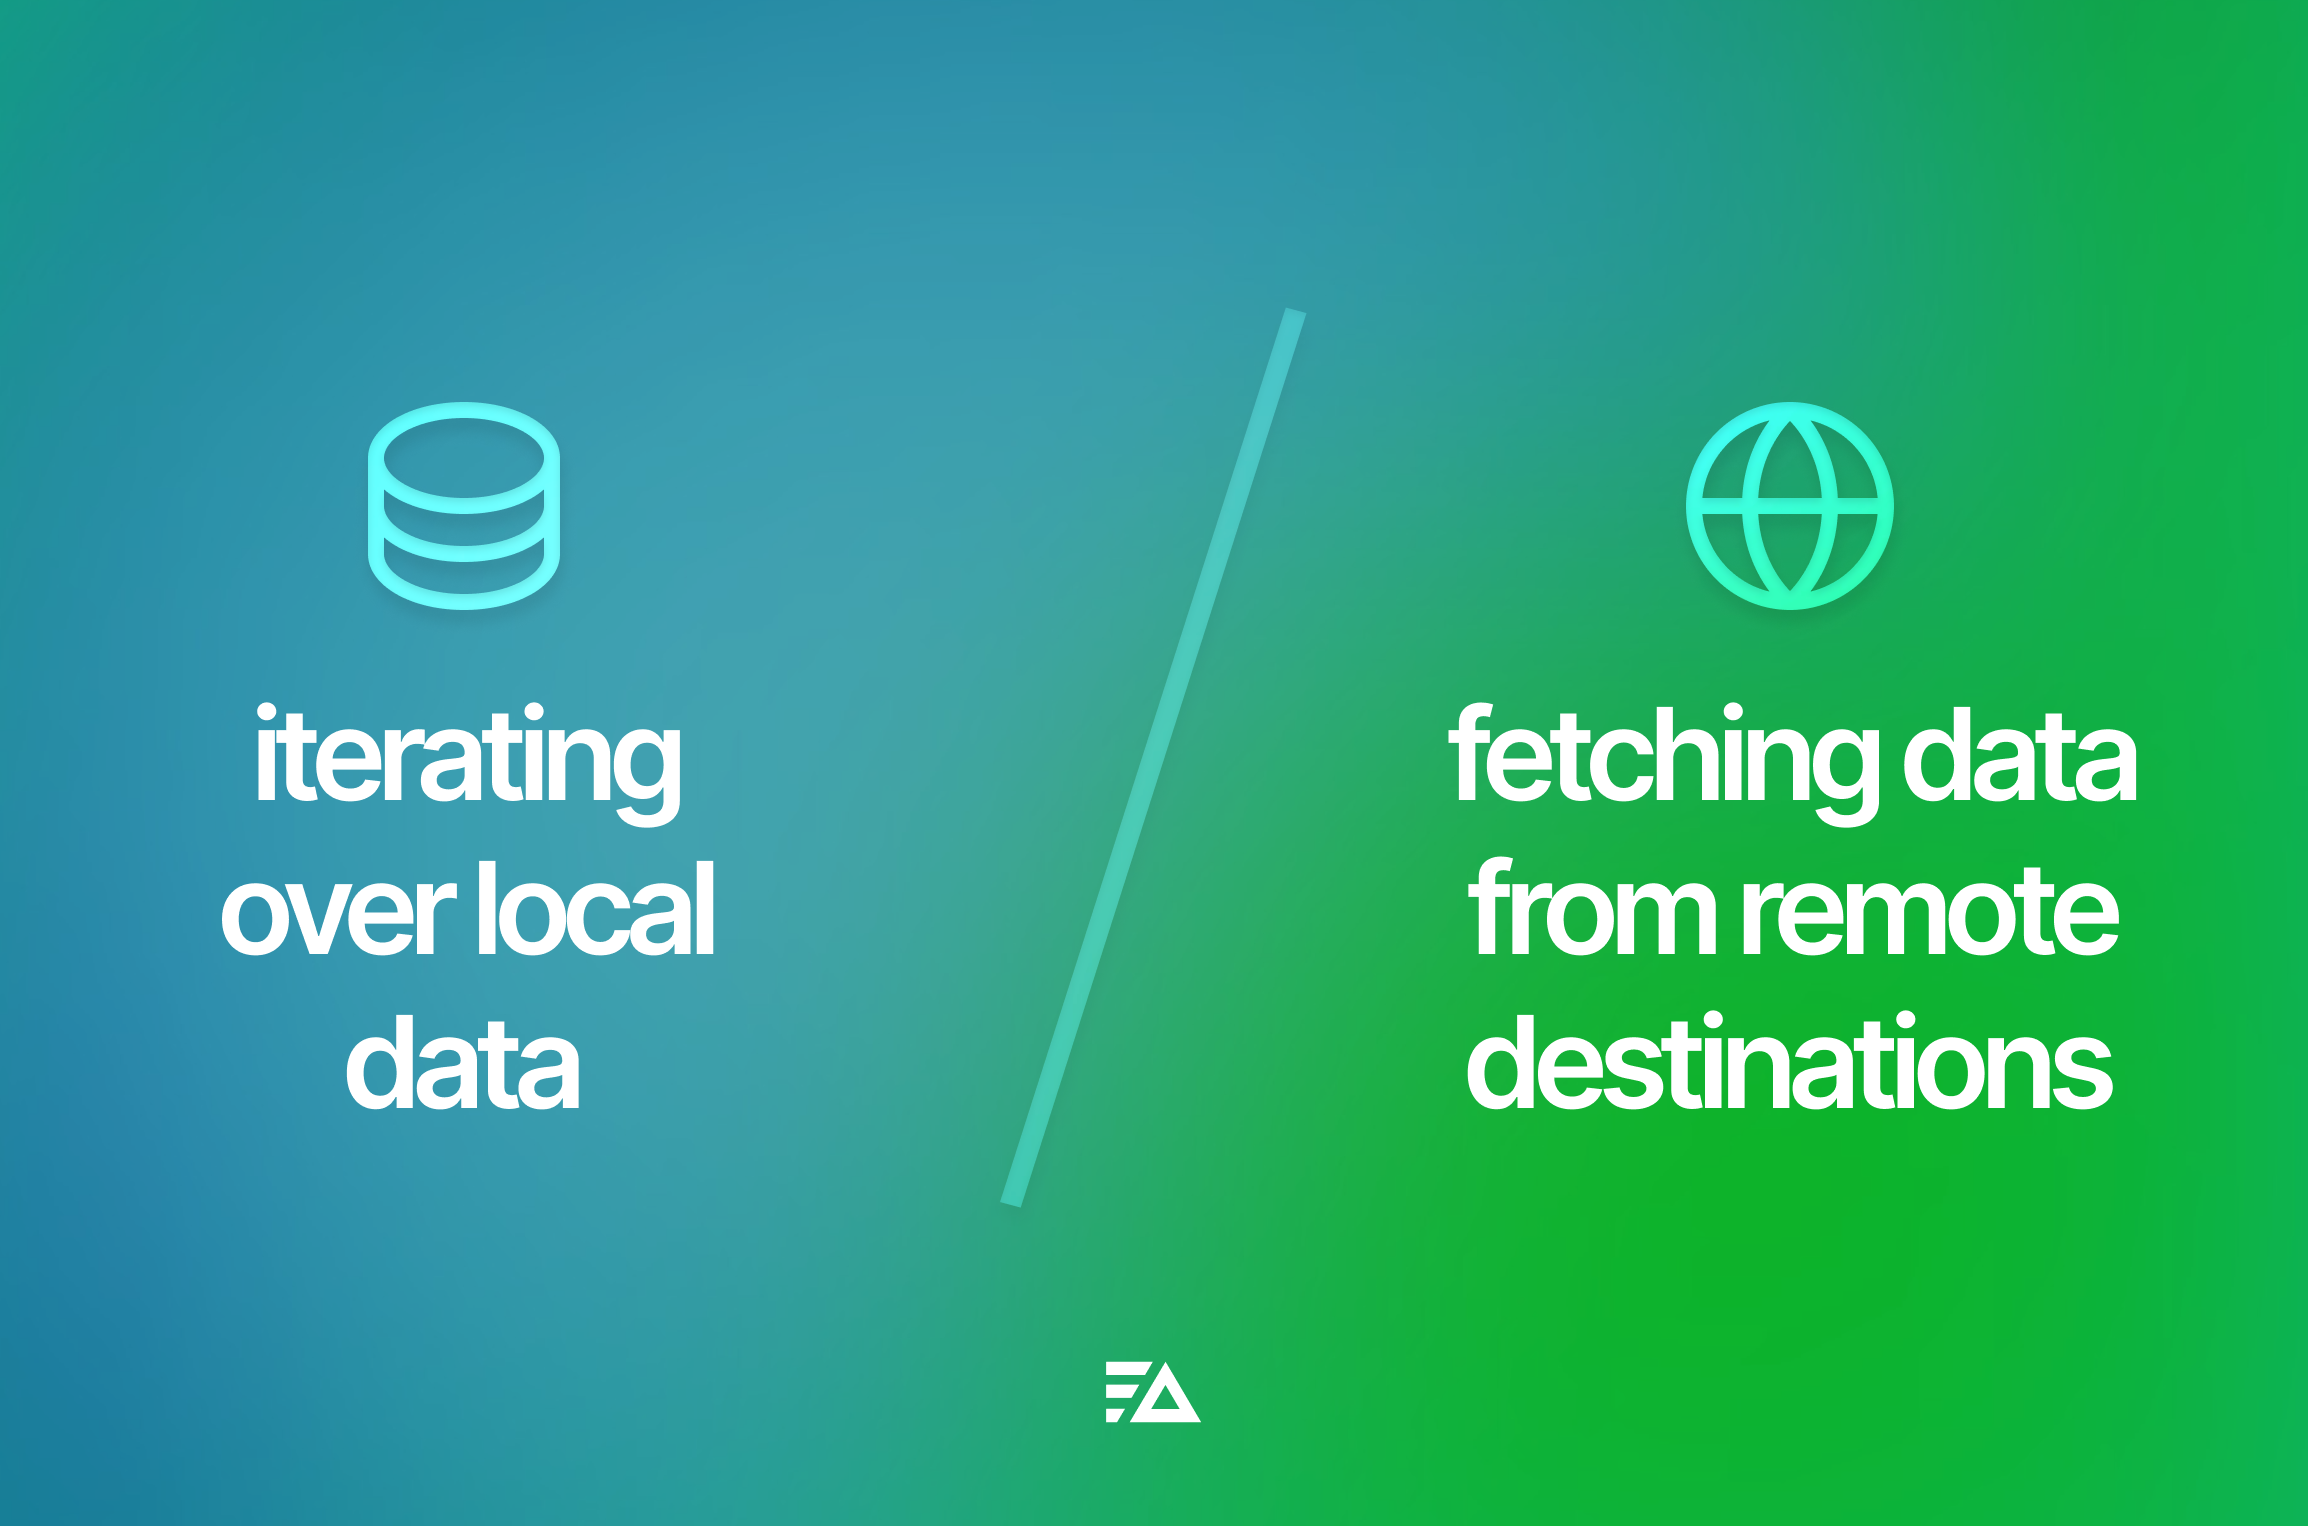
The agents that handle real investigations well have a way around both constraints. They can pull as much raw data as the question needs over the API. And instead of trying to reason about that data inside the context window, they drop it into a sandbox and run code against it there.
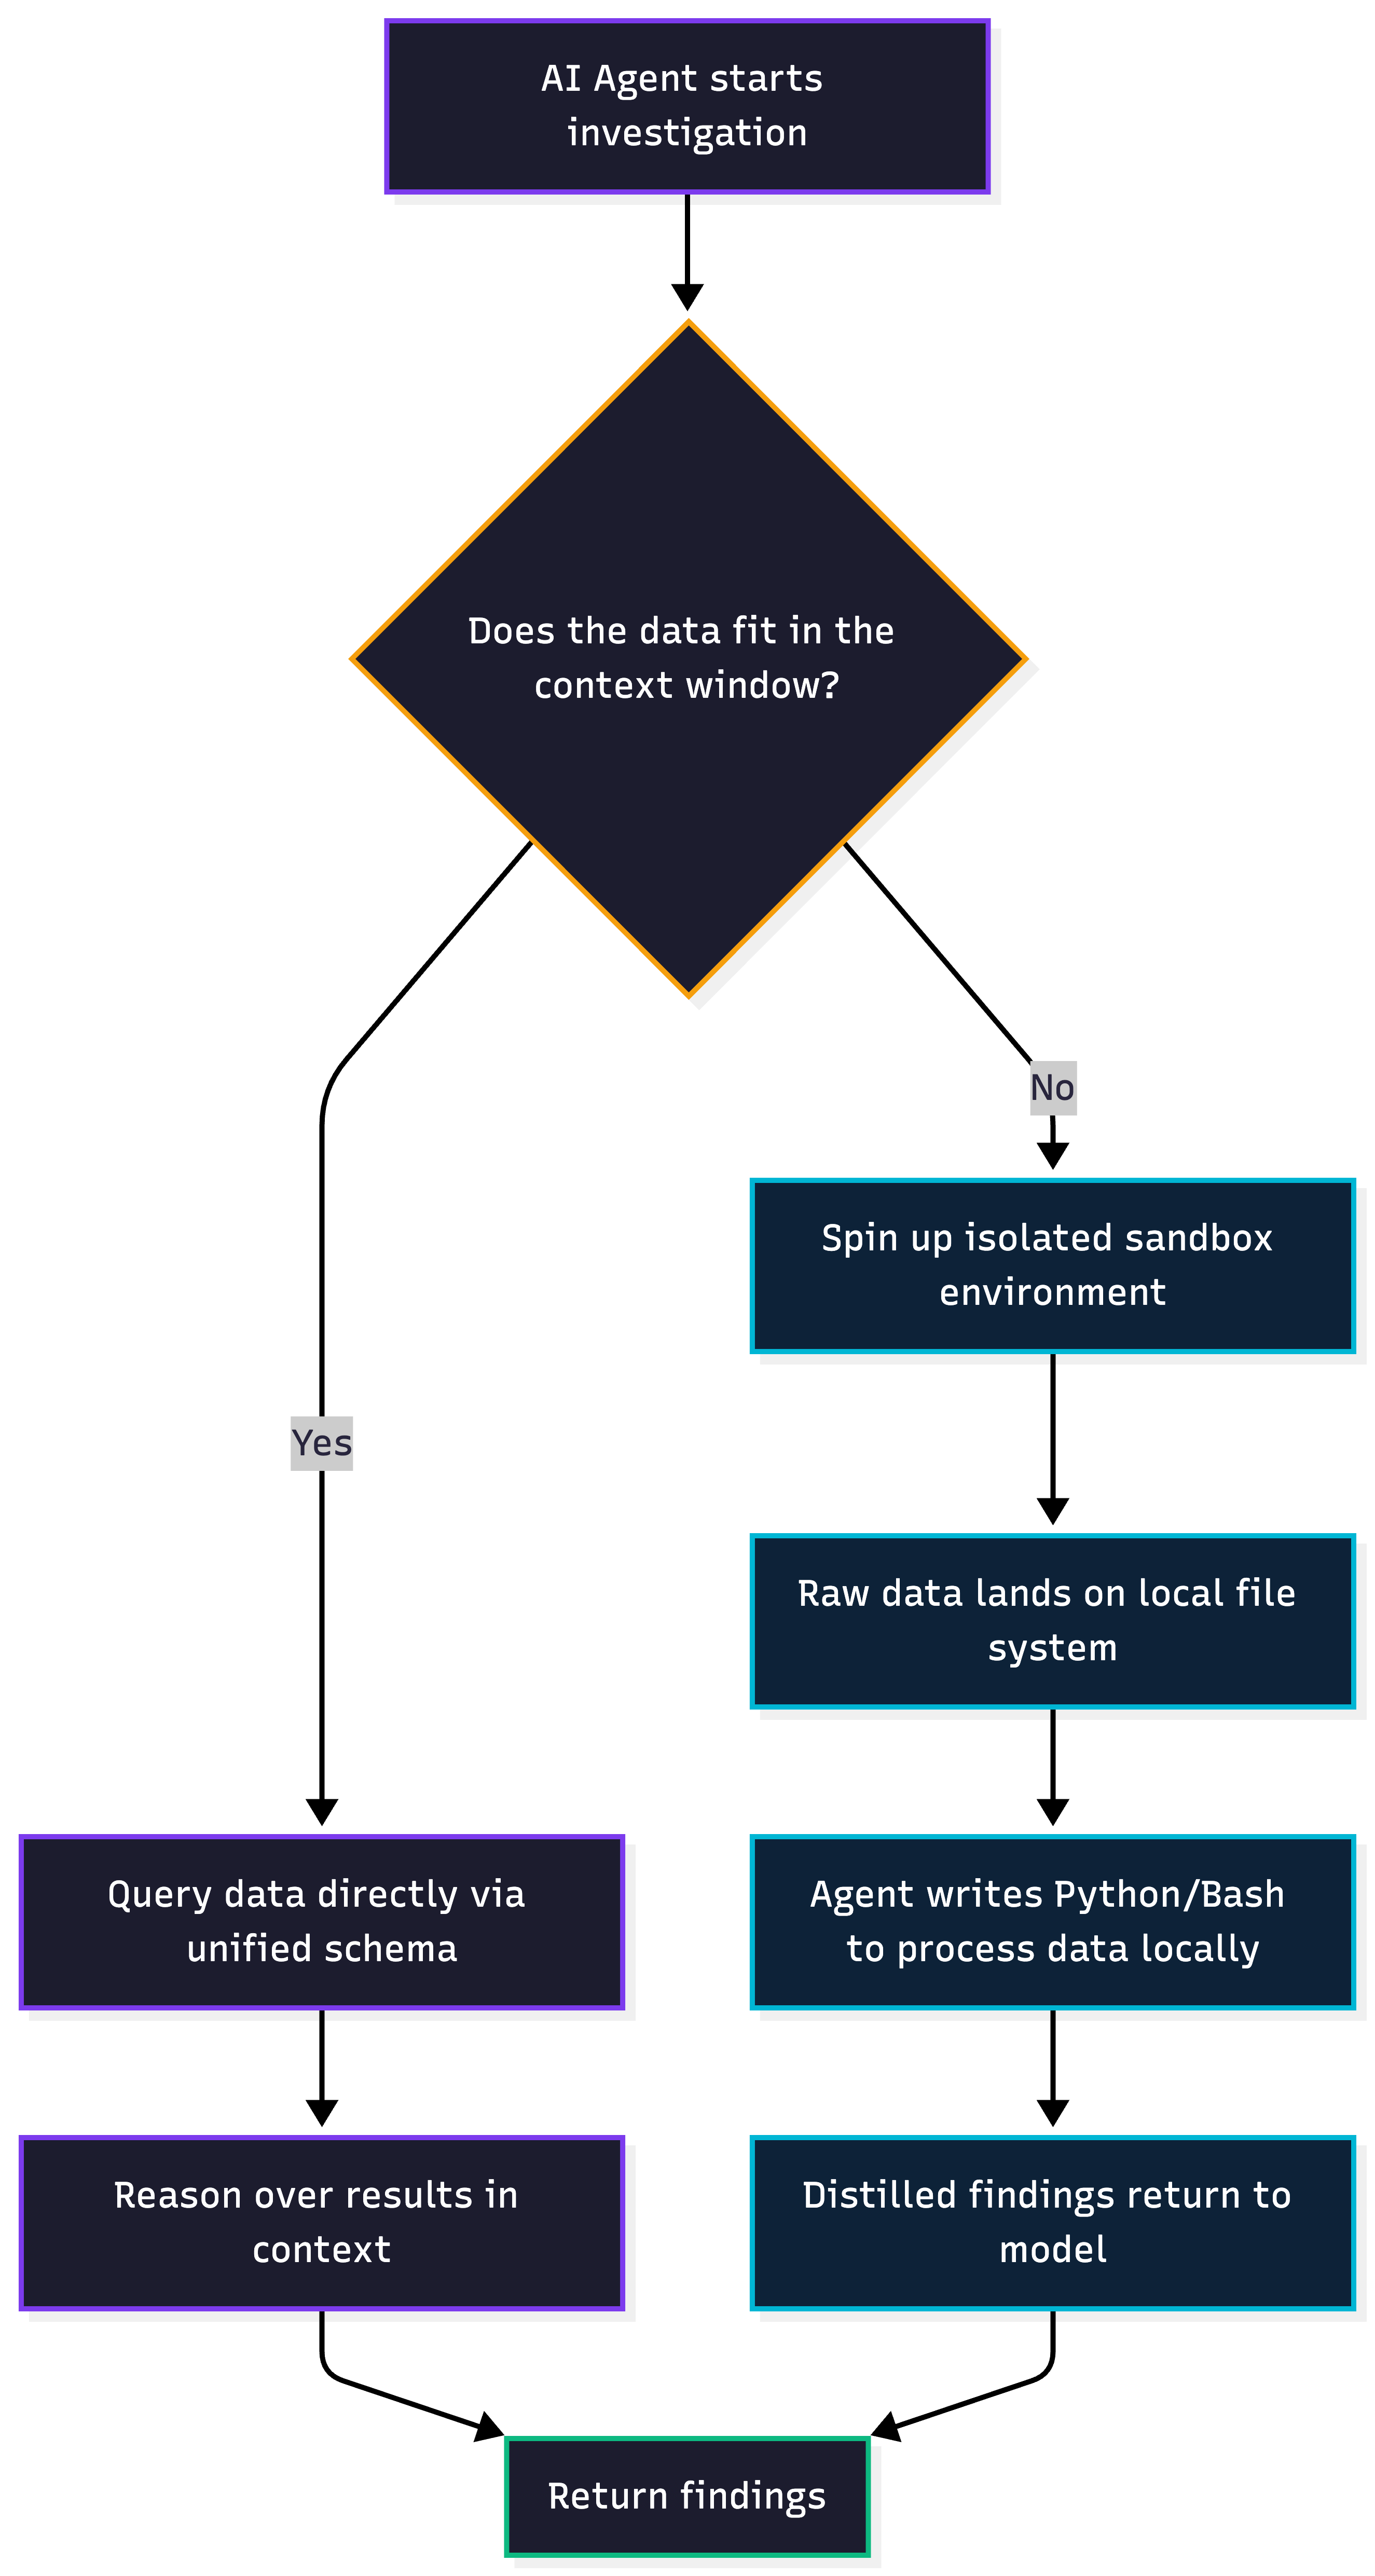
When an investigation on Edge Delta’s AI Team pulls in more data than will fit in the context window, the agent spins up an isolated environment with its own file system. The raw data lands there. The agent then writes Python and Bash against it, grouping by arbitrary fields, computing distributions, correlating patterns across signal types, cloning repositories and grep’ing through full codebases. Only the distilled findings make it back into the model’s context.
The first time I saw this run on a live investigation, it reminded me more of an engineer sitting at a terminal with a local copy of the data, working through hypotheses one at a time, than of a typical AI product. Functionally, that is what it was.
The agent is no longer constrained by whatever return schema a pre-defined tool hands it. It has the same freedom to shape queries that an engineer would. Each sandbox is scoped to a single investigation and deprovisioned when that investigation ends.
Why a unified data model amplifies this
API access and sandbox execution get you most of the way, but a single, consistent data model amplifies both. When metrics, logs, and traces speak the same schema and query language, the agent spends fewer tool calls learning the surface area and fewer retries fixing malformed queries. That leaves more of the budget available for actual iteration.
Compare that to a fragmented setup. Metrics live in one backend behind PromQL, logs in a second backend with its own DSL, and traces in a third behind yet another interface. Each platform has its own field names (service.name in one place, service_name in another, a label in the third). Before the agent can get to work, it has to discover three schemas, learn three query languages, and normalize three different response shapes. Most of that work is overhead, and it comes directly out of the context window.
What does good look like for agentic observability?
If you are evaluating agentic observability for your team, whether it is our product or someone else’s, these are the numbers I would track:
- Tool calls per investigation. Fragmented setups need many more of them.
- Malformed query rate. This drops sharply when there is a single, unified query language.
- Context window utilization. How much of the window is spent on reasoning vs. raw API payloads crowding it out.
- Sandbox offload ratio. How much data is processed locally vs. loaded into the model’s context.
- Human handoff rate. When remediation tools live on the same hub, this typically drops too.
In my experience, the direction is consistent across all five: the more freely the agent can pull and iterate on data, the faster and more reliable the investigation becomes.
Where this comes from for us
Edge Delta started as a telemetry pipeline company. The agents, the schema, the query language, the pipeline engine, and everything downstream of your data was built by the same team. AI Team inherits that data plane relationship, and it took me working with the product for a while before I really appreciated how much that changes what an agent is able to do. The MCP tools are not thin wrappers over someone else’s API. They are primitives of the same platform that defines the schema and runs the pipelines. When even that is not close enough, there is a sandbox.
That is how I would describe Observability 3.0 in practice: the platform that processes your telemetry is the same platform that reasons over it, with enough freedom for agents to actually iterate.


