AI-powered Kubernetes observability
Kubernetes environments are complex and dynamic. Edge Delta connects to your cluster with ease and gives AI Teammates clean, real-time signals to detect issues early, triage accurately, and coordinate fixes before incidents reach customers.
Kubernetes complexity outpaces traditional monitoring
Kubernetes environments are dynamic by design, and traditional monitoring can't keep up. Sending all telemetry to a centralized platform before analysis is slow, expensive, and creates:
Muddled Visibility
Too much telemetry data obfuscates the issues within your Kubernetes environment. Many Kubernetes components generate logs, leaving you drowning in a sea of data.
High Costs
Collecting and sending every piece of telemetry data to a centralized platform for processing and analysis is a surefire way to explode your observability bill.
Weak Performance
The “centralize-then-analyze” approach introduces significant delays between data creation and insight generation, wasting time when troubleshooting production issues.
AI teammates, built for Kubernetes scale
Edge Delta processes Kubernetes telemetry at the source, giving AI Teammates a real-time, high-fidelity signal to work from. The SRE Teammate triages pod failures and node anomalies. When issues point to application code, the Software Engineer Teammate gets the same rich context to help diagnose and fix the root cause.
Out-of-the-Box Dashboards
AI Teammates pull from pre-built golden signal dashboards the moment they're deployed, and your team can build custom dashboards and alerts to monitor the Kubernetes metrics that matter most.
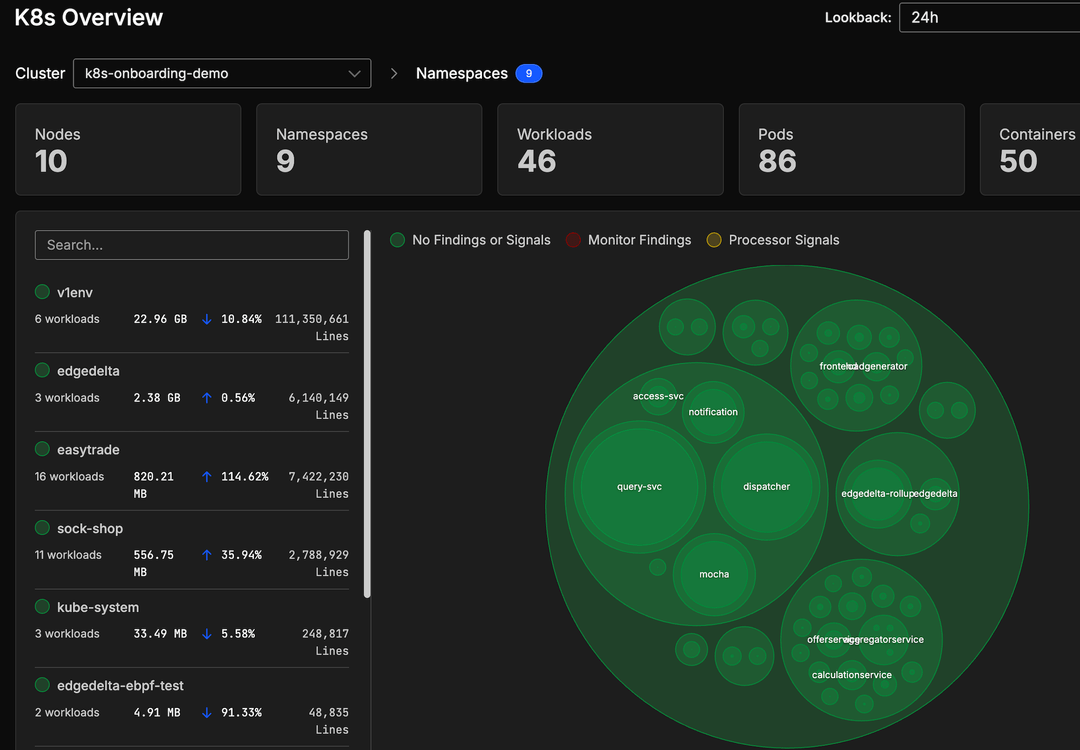
Deep Environment Visibility
AI Teammates drill into individual namespaces, workloads, and pods to pinpoint exactly where an issue originated, giving your team precise context without manual investigation.
Sub-Second Query Performance
AI Teammates query Kubernetes event data in sub-seconds, surfacing the relevant logs the moment an incident starts, so nothing is missed while the investigation is underway.
Ready to take the next step?
See how the AI SRE Teammate handles Kubernetes incidents from detection to resolution.
“This is not just about doing what you used to do in the past, and doing it a little bit better. This is a new way to see this world of how we collect and manage our observability pipelines.”
Ben Kus, CTO, Box
Join Engineering Teams That Are Embracing AI
It only takes a couple of minutes to start running AI Teammates in production.