


In modern cloud-native environments, understanding how applications perform under stress is critical for maintaining system reliability and delivering a consistent user experience. At Edge Delta, we build and operate large-scale distributed systems that process petabytes of observability and security data daily. Operating at this scale requires us to thoroughly test our services under various load conditions to ensure they meet performance expectations.
Today, we’re open-sourcing our Kubernetes HTTP Traffic Load Testing Tool, a utility we’ve developed and refined to benchmark services running in Kubernetes environments. This tool has become an essential part of our performance testing and capacity planning processes, and we’re excited to share it with the wider community.
The Challenge: Load Testing at Scale in Kubernetes
Properly load testing applications running in Kubernetes presents several unique challenges:
- Realistic traffic patterns – Real-world traffic rarely arrives at a constant rate. Instead, it fluctuates with peaks and valleys that stress systems in different ways.
- Resource monitoring – Capturing accurate CPU, memory, and network metrics across distributed components during load testing requires specialized tooling that integrates directly with the Kubernetes API.
- Multi-service environment – Modern applications often consist of multiple interconnected services that must be tested holistically.
- Result analysis – Raw performance data is only useful when presented in a way that helps identify bottlenecks and optimization opportunities.
Our Kubernetes Load Testing Tool was designed explicitly with these challenges in mind. It is built to thoroughly test multi-service environments by simulating realistic traffic patterns at scale — all while capturing detailed performance metrics and presenting them through clear, visual reporting.
Introducing Our Kubernetes HTTP Traffic Load Testing Tool
Our load-testing utility combines the power of K6 (a modern load testing tool) with Kubernetes-native resource monitoring and comprehensive reporting. The tool runs as a Kubernetes job with three specialized containers:
- Resource Monitoring Container – Tracks CPU and memory usage across all pods in the targeted deployment throughout the test duration
- K6 Load Testing Container – Generates HTTP traffic following a four-phase pattern that simulates increasing load
- Report Generator Container – Produces detailed HTML reports that visualize both performance metrics and resource utilization
This multi-container approach allows us to correlate traffic load with resource consumption patterns, providing insights that wouldn’t be possible with standard load testing tools.
Key Features
Progressive Load Tiers
Rather than hitting services with constant traffic, our tool implements a progressive, four-phase testing approach:
- Low Traffic Phase – Establishes a baseline with minimal load
- Medium Traffic Phase – Increases to moderate traffic levels
- High Traffic Phase – Applies significant load to stress the system
- Peak Traffic Phase – Ramps up to maximum load before gradually decreasing
This pattern helps identify the point at which services begin to degrade, providing early warning signals before complete failure occurs.
Resource Utilization Tracking
Our load testing tool monitors CPU and memory consumption throughout the testing process, creating a comprehensive view of how resource usage correlates with traffic load. This data is crucial for:
- Setting appropriate resource requests and limits
- Identifying memory leaks under sustained load
- Understanding scaling thresholds
- Planning capacity for expected traffic patterns
Integrated HTML Reporting
After completion, the tool generates a detailed HTML report featuring:
- Performance metrics for each traffic tier
- Visualizations depicting resource utilization over time
- Comparisons of response times across different scenarios
- Summary statistics for quick analysis
The report can be accessed directly or uploaded to S3 with Slack notifications when complete.
Using the Tool
Getting started with our load-testing utility is straightforward. First, clone the repository and set up the necessary permissions:
git clone https://github.com/edgedelta/k8s-traffic-bench.gitchmod +x setup-load-test-prereqs.sh run-load-test.sh./setup-load-test-prereqs.sh default # Replace 'default' with your target namespaceThen run a basic test against your service:
./run-load-test.sh --targets "http://my-service:8080" --watchThe tool accepts multiple configuration options, including:
- Custom VU (Virtual User) counts for each traffic tier
- Test durations
- Target deployments to monitor
- Namespace configuration
- Output destinations (including S3 and Slack)
Real-World Use Cases
At Edge Delta, we use this tool in several ways:
Performance Regression Testing
Before deploying major updates, we run standardized load tests against our services and compare results with previous baselines. This approach has caught several performance regressions before they reached production.
To demonstrate, we fed our Edge Delta agent with roughly 1 million traces over a 30 minute period using our load testing tool, and added the resulting resource utilization visualizations below:
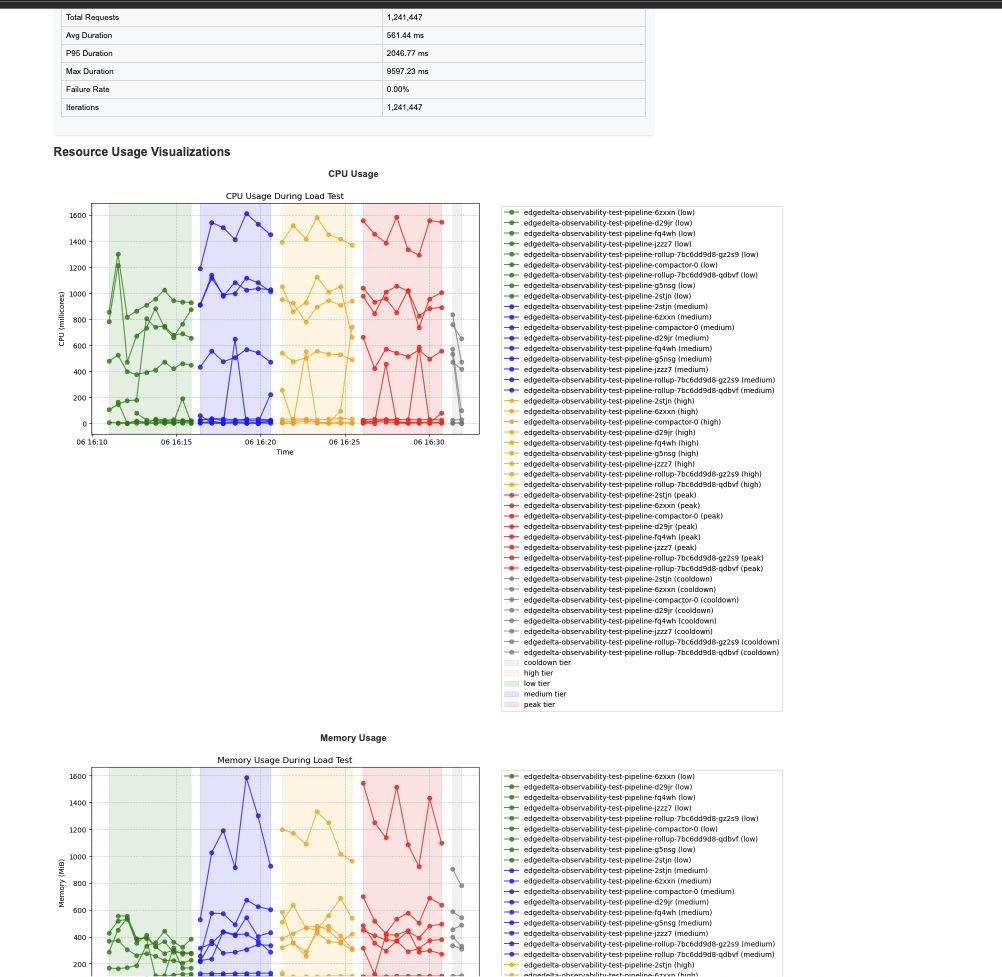
Trace statistics summary table, paired with two graphs visualizing CPU usage and Memory usage across each load phase.
Capacity Planning
By testing different load patterns that match expected traffic growth, we can accurately predict when we’ll need to scale our infrastructure, helping avoid both over-provisioning and unexpected capacity issues.
Architecture Validation
When evaluating architectural changes, the detailed resource metrics provided by our tool help validate whether proposed modifications actually improve efficiency under real-world conditions.
Bottleneck Identification
The correlation between traffic patterns and resource usage often reveals bottlenecks that wouldn’t be apparent from application logs or basic monitoring alone.
Technical Deep Dive
Under the hood, the tool works by:
- Creating a Kubernetes job with three containers sharing an empty directory volume
- Monitoring resources by periodically querying the Kubernetes API for metrics
- Generating traffic using K6 with a customizable script
- Producing reports by processing the collected data into visualizations
The containerized approach ensures consistent execution across different environments while leveraging Kubernetes’ scheduling capabilities.
By default, the tool captures:
- HTTP response times (average, p95, max)
- Error rates
- CPU usage by pod
- Memory consumption by pod
- Correlation between traffic tiers and resource patterns
Contributing and Customization
We’ve designed the tool to be easily customizable for different testing needs. The most common customizations include:
- Modifying the K6 script to add custom headers or authentication
- Adjusting traffic patterns for specific use cases
- Adding new metrics to the resource monitoring component
- Extending the reporting with additional visualizations
We welcome community contributions and feedback. The project is available under the MIT License, making it freely available for both commercial and non-commercial use.
Better Testing, More Reliable Services
Thorough load testing is essential for building reliable systems that operate efficiently at scale. Our Kubernetes HTTP Traffic Load Testing Tool has become an integral part of our development and operations workflow at Edge Delta, helping us identify and resolve performance issues before they impact our customers.
By open-sourcing this tool, we hope to contribute to the broader Kubernetes ecosystem and help other teams implement more effective load testing practices. As with any performance testing, the insights gained are only valuable if they lead to concrete improvements — and having the right tools is the first step in that process.Try out the k8s-traffic-bench tool today, and let us know how it helps improve your services’ performance and reliability.


