
Database queries are fundamental to application performance, and even a few slow queries can cause significant latency that degrades the user experience. However, many legacy databases lack native monitoring capabilities, which forces teams to write custom scripts that periodically collect information like query execution times and success rates. This manual approach leads to fragmented visibility across workflows and can be challenging to scale with net-new infrastructure components.
With Edge Delta’s Exec Input Source node, teams can automatically run local executables that poll databases and collect the responses, centralizing the results into unified data streams within Edge Delta Telemetry Pipelines. This scalable approach to database monitoring enables teams to gain full insight into their database infrastructure, making it easier to identify and remediate performance issues.
Note — the Exec Input Source node only works in environments where the agent can access and run scripts locally, like on Linux and Windows hosts. Our Kubernetes agent image is lightweight and doesn’t support this functionality out of the box.
Real-World Example: Identifying Slow-Running MySQL Queries
Let’s walk through a brief example to demonstrate how the Exec Input Source node works. We’ll be running MySQL on an Ubuntu-based Linux machine hosted on an Amazon EC2 instance, where the Edge Delta agent is already installed.
Our goal is to monitor the database for long-running queries that may be affecting overall database performance. We can do this by adding the Exec Input Source node to our Telemetry Pipeline, which will execute a script to poll the database periodically and capture long-running queries as log items. These logs can then be forwarded to any downstream destination — including Edge Delta’s Observability platform — for further analysis.
Step 1: Update Our Package List
Before we proceed, let’s confirm that our package list is up-to-date by running the following commands:
sudo apt updatesudo apt upgradeStep 2: Install a MySQL Server
Once our system is updated, we’ll install our MySQL server on our Linux machine:
#Install MySQL
sudo apt install mysql-server
sudo service mysql status
#Connect MySQL
sudo mysql#Exit MySQL
exit;#Set MySQL root password
sudo mysql
ALTER USER 'root'@'localhost' IDENTIFIED WITH mysql_native_password BY 'password';
exit;#Secure MySQL
sudo mysql_secure_installation#Renable Socket Authentication
mysql -u root -p
ALTER USER 'root'@'localhost' IDENTIFIED WITH auth_socket;
exit;#Create User
CREATE USER 'testuser1'@'localhost' IDENTIFIED WITH mysql_native_password BY 'Password123!!';#Grant Privileges
GRANT CREATE, ALTER, DROP, INSERT, UPDATE, INDEX, DELETE, SELECT, REFERENCES, RELOAD on *.* TO 'testuser1'@'localhost' WITH GRANT OPTION;#Make Super User
GRANT ALL PRIVILEGES ON *.* TO 'testuser1'@'localhost' WITH GRANT OPTION;#Refresh privileges in MySQL
flush privileges;
exit;#Validate User
mysql -u testuser1 -p
exit;#Create Database
mysql -u testuser1 -p
CREATE DATABASE testdb;
SHOW CREATE DATABASE testdb;
exit;#Create Table
mysql -u testuser1 -p
USE testdb;
SHOW TABLES;
CREATE TABLE testtable(
id int NOT NULL AUTO_INCREMENT,
description varchar(255),
PRIMARY KEY (id)
);
SHOW TABLES;
exit;#Insert Test Record
mysql -u testuser1 -p
USE testdb;
INSERT INTO testtable(description) VALUES (UNIX_TIMESTAMP(NOW()));
SELECT * FROM testtable
exit;We now have a new MySQL server that’s running a database called testdb, within which the testtable table lives.
Step 3: Create a MySQL Script
We can now create a script to poll the database and capture any long-running queries by querying the information_schema.PROCESSLIST table, which stores information about currently active threads within the MySQL server.
Let’s first create the file that will contain this query script:
mkdir -p /var/scripts
nano mysql-longrunning.sh
Then, let’s create the script that the Edge Delta agent will run:
#!/bin/bash
# MySQL login details
MYSQL_USER="testuser1"
MYSQL_PASSWORD="Password123!!"
query="SELECT JSON_OBJECT('ID',ID,'USER',USER,'HOST',HOST,'DB',DB,'COMMAND',COMMAND,'TIME',TIME,'STATE',STATE,'INFO',INFO) FROM information_schema.PROCESSLIST WHERE COMMAND != 'Sleep' AND TIME > 5;"
database="mysql"
mysql -u "$MYSQL_USER" -p"$MYSQL_PASSWORD" "$database" -e "$query"
Note: This query returns the results as a JSON object, which greatly simplifies the following pipeline processing steps.
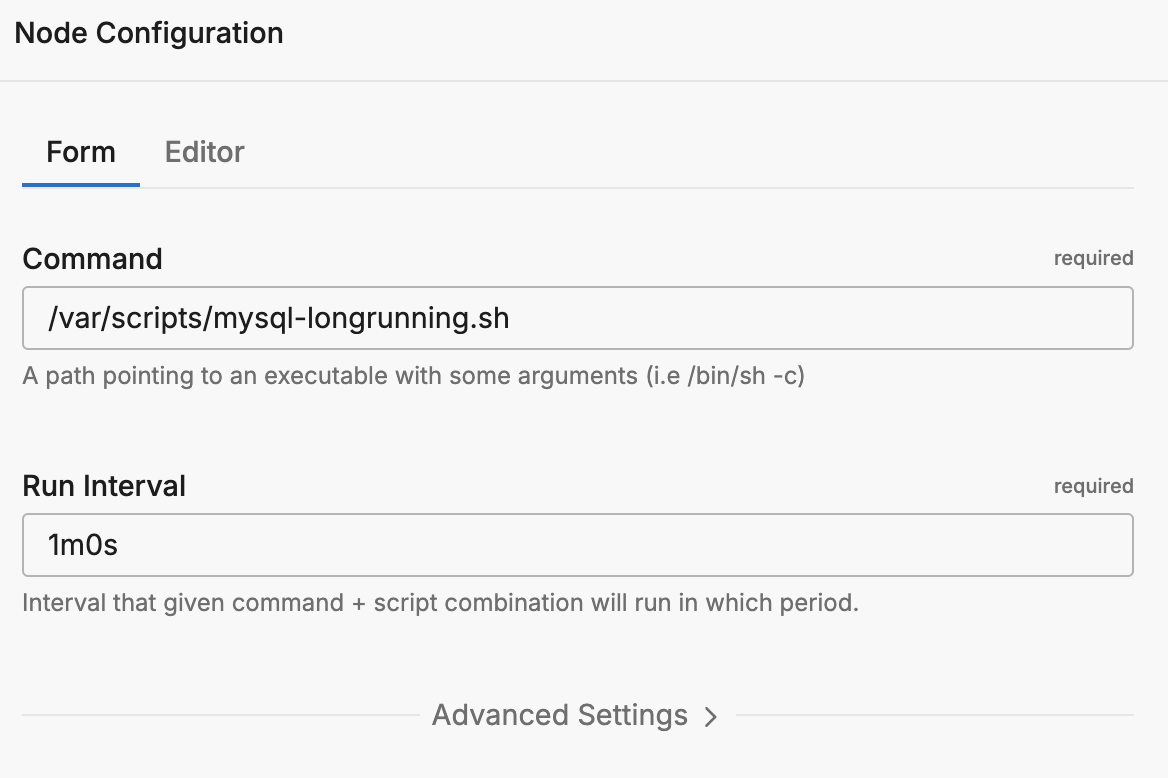
The Exec Input Source node allows us to periodically run the mysql-longrunning.sh script to capture those long-running queries, turn each query into a log item, and send it through the pipeline for processing and routing. Below is the corresponding node configuration, which specifies that the script should run every minute:
Step 4: Create an example MySQL query
To test the node’s configuration, let’s use the following command to run an intentionally long query on our testdb database:
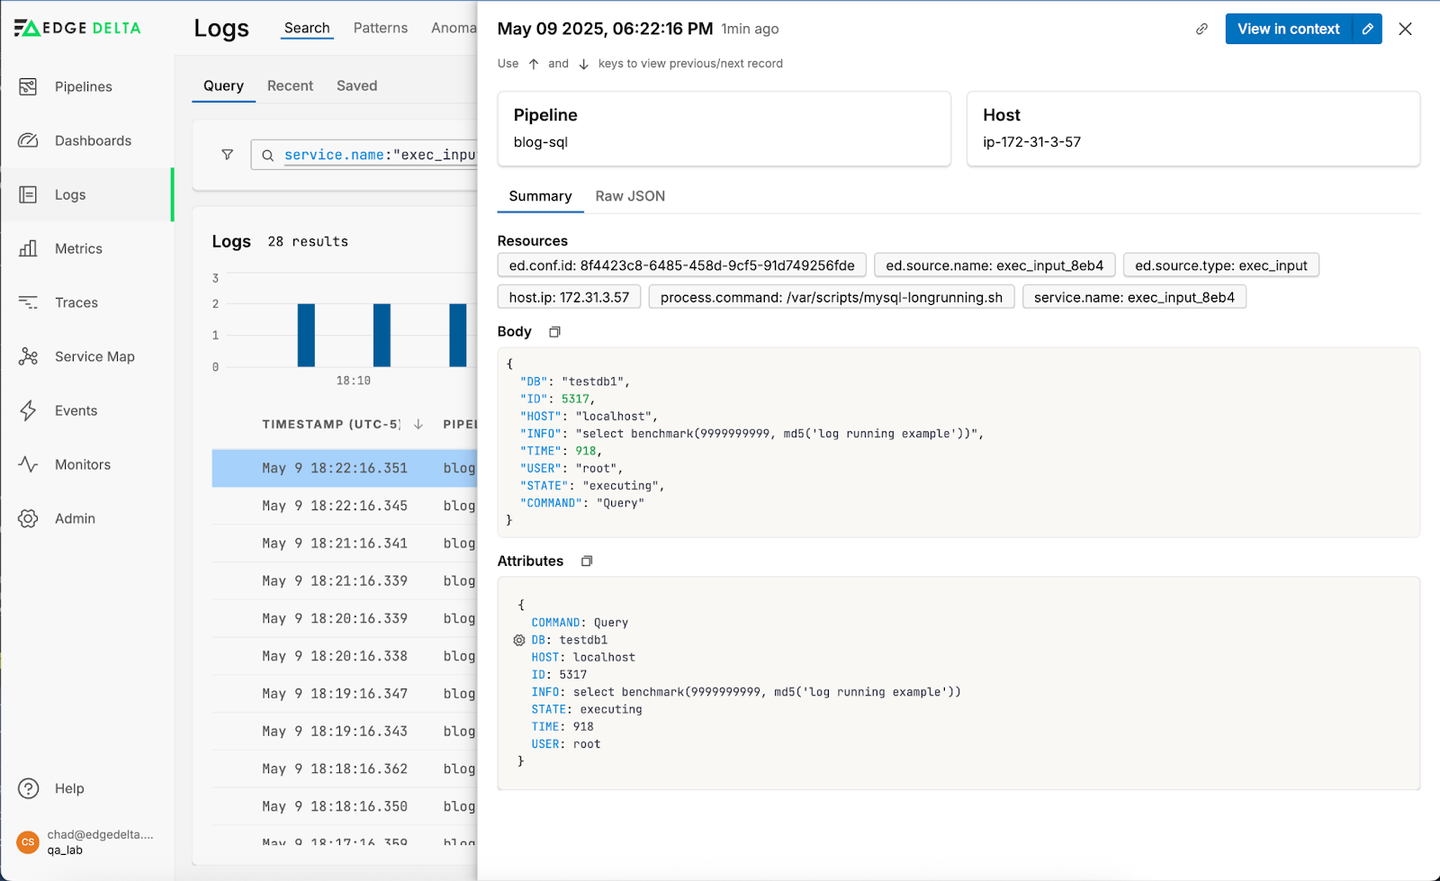
mysql -h localhost testdb -e "select benchmark(9999999999, md5('log running example'));"As our agent runs the mysql-longrunning.sh script, it hits the information_schema.PROCESSLIST table and captures this long-running query. To prepare this data for downstream use, we’ll need to apply a few different processing steps — each of which is detailed below.
Step 5: Process Data Within an Edge Delta Telemetry Pipeline
Once the query-based logs from the Exec Input Source node enter the pipeline, they are parsed and filtered appropriately to extract the relevant information and remove noise pre-index.
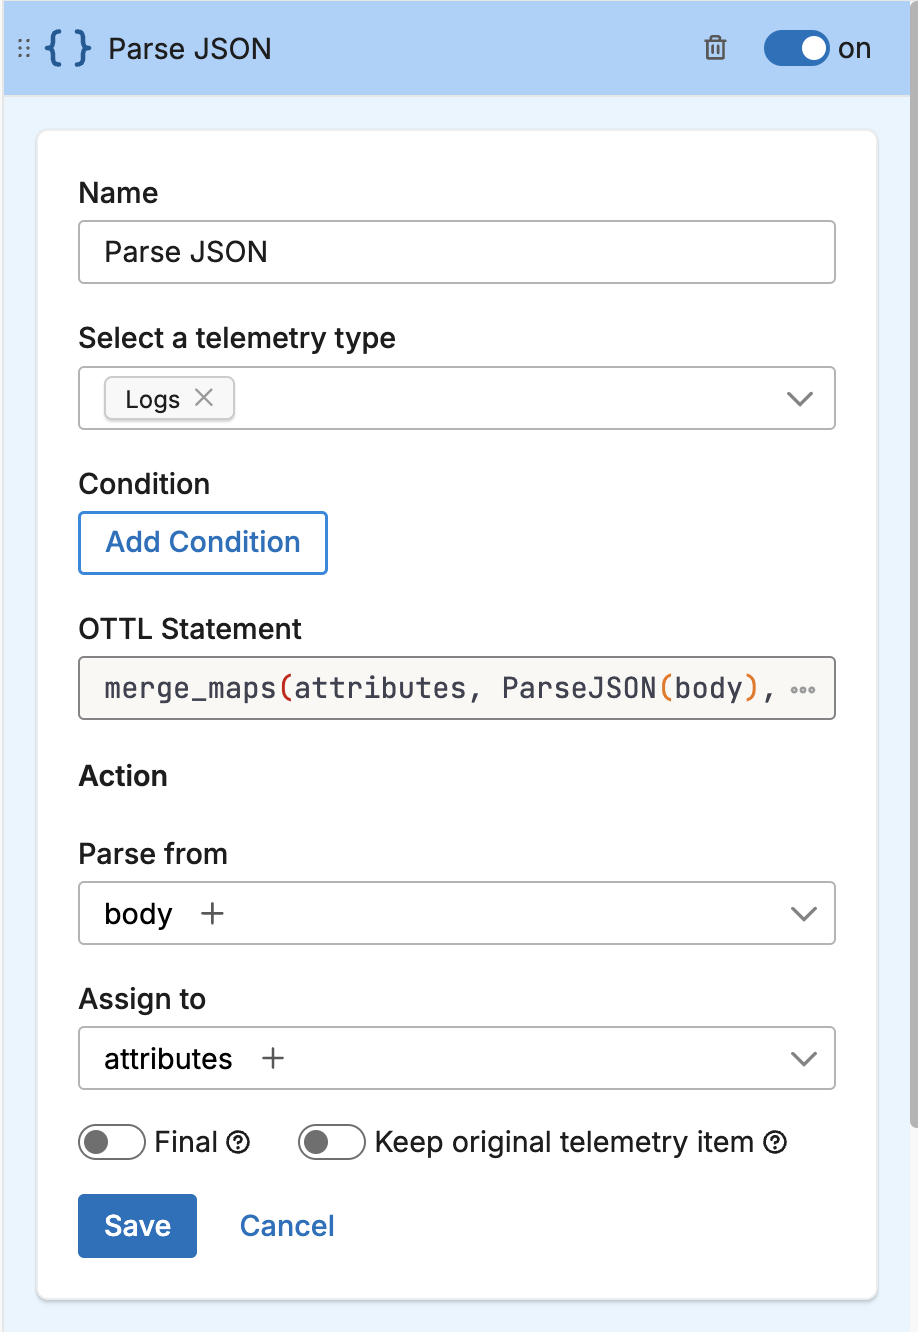
First, the data enters the Parse JSON processor, which breaks up each JSON log item into structured attributes:
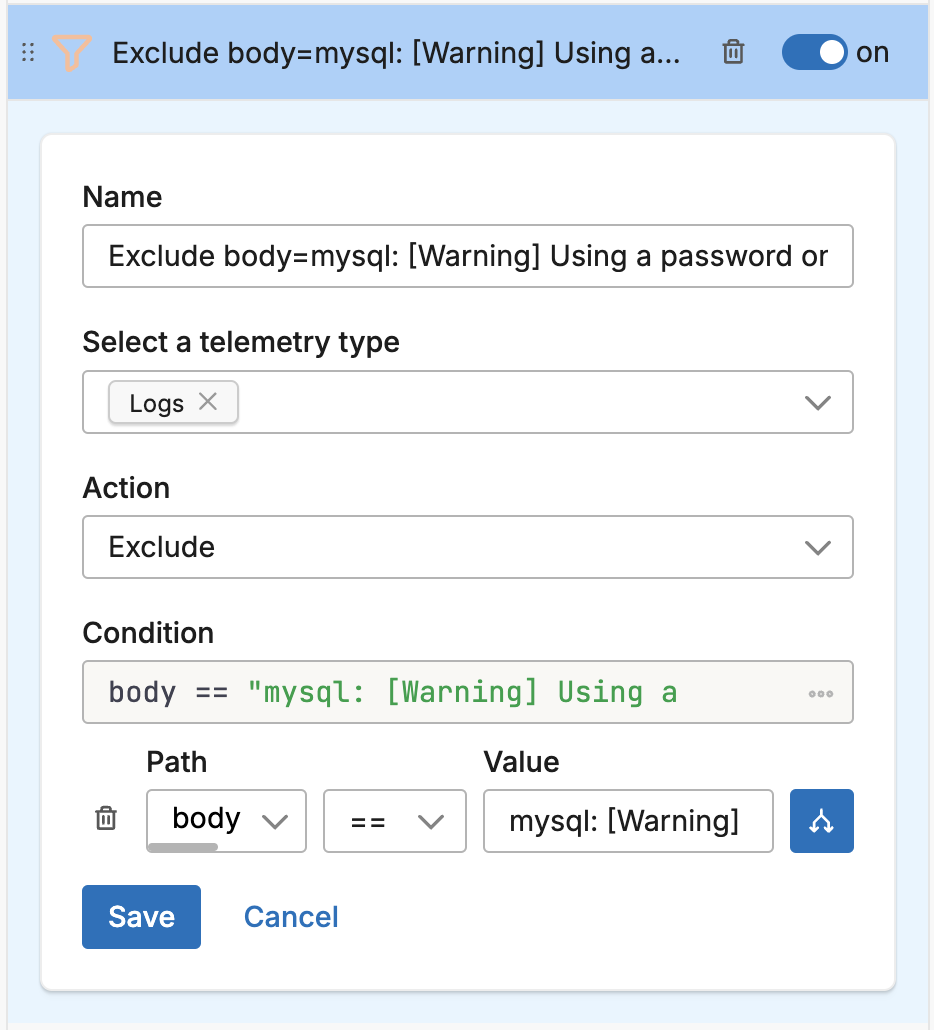
Next, the pipeline drops any unnecessary logs that aren’t related to the long-running query. First, it removes the logs capturing the warning message MySQL automatically generates when using a password in a CLI command (which isn’t relevant for the scope of this example):
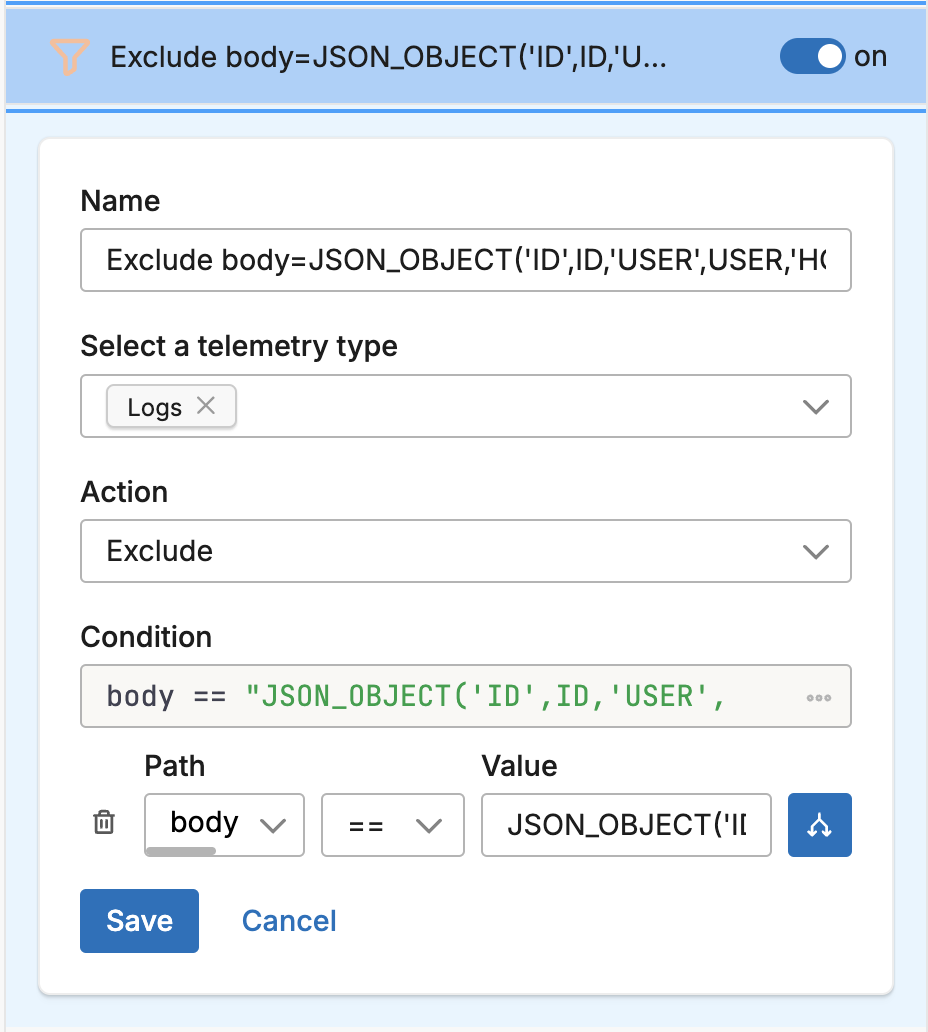
Since the Exec Input Source node also captures the original query run in the mysql-longrunning.sh script, we’ll remove that, as well:
Finally, the remaining log items are sent into Edge Delta’s Observability Platform, with relevant information like query command, execution time, and associated database stored directly within the logs’ attributes.
From here, we can construct dashboards to visualize query health — and configure monitors to automatically alert us when an abnormal number of long-running queries are detected.
Wrapping Up
A successful observability strategy requires visibility into every component of your system — even those that are traditionally difficult to monitor.
With Edge Delta’s Exec Input Source node, teams can automate the collection of telemetry data from databases, which typically lack native observability support. This means that existing scripts — which have historically been executed via cron jobs — can be seamlessly integrated into Telemetry Pipelines, enabling teams to effortlessly monitor query execution times as part of a holistic monitoring strategy that can easily scale to accommodate new database infrastructure.
This one-time, low-lift effort to modernize and centralize data collection with Edge Delta leads to significant long-term benefits, allowing organizations to quickly move from fragmented local insights to centralized, actionable observability.
Check out our Playground to see the Exec Input Source node in action.