

Grafana, Kibana, and Prometheus are essential monitoring and observability tools that power today’s data-driven organizations. Each of them offers unique features while sharing some common functionalities.
Whether visualizing data with Grafana, analyzing logs with Kibana, or collecting metrics with Prometheus, the choice of tool can impact your ability to diagnose issues, optimize performance, and make informed decisions.
Learning which tool best suits your organization’s requirements is crucial. In many cases, you can use these tools in a complementary fashion. This article will delve into each tool to help you choose the right setup for your needs.
Similarities and Comparisons of Grafana vs. Kibana vs. Prometheus
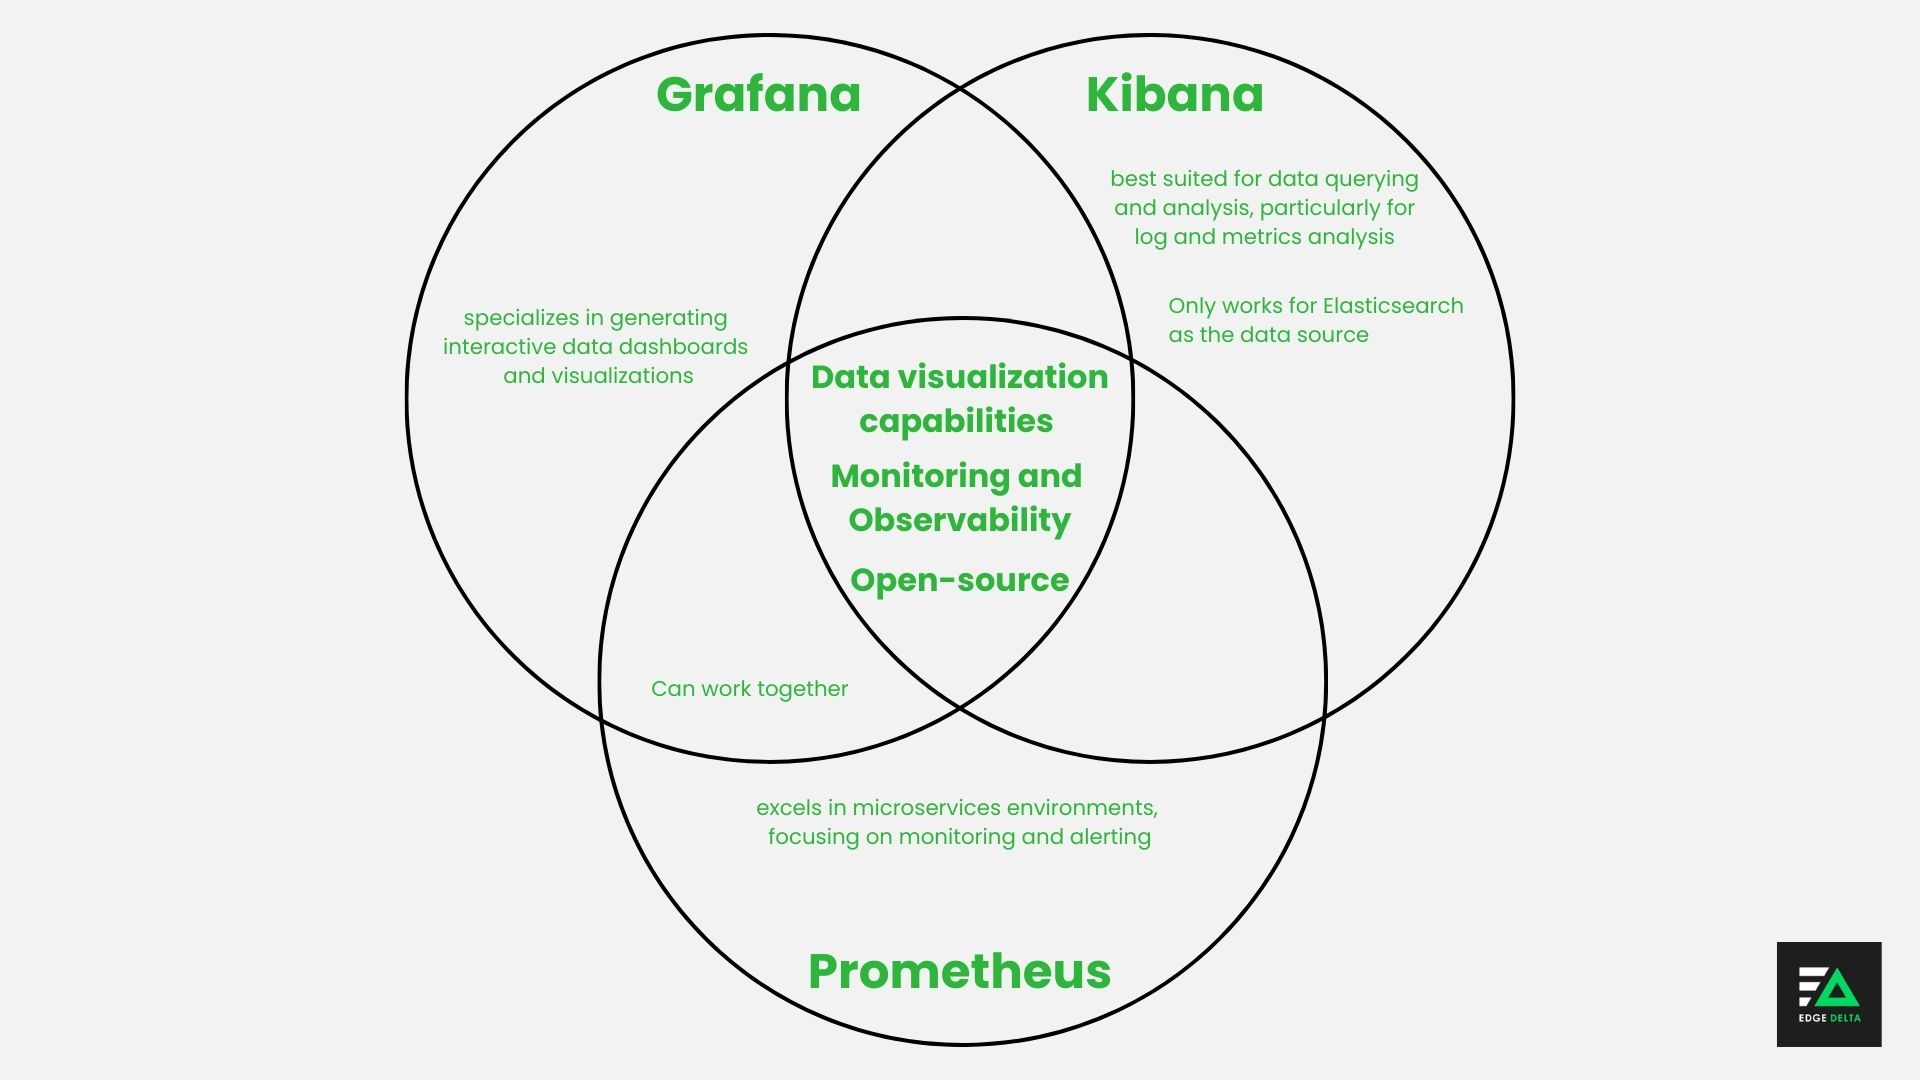
All three tools are open-source projects designed for monitoring and observability. Grafana, Kibana, and Prometheus help users understand system behaviors, anomalies, and potential issues within the infrastructure and facilitate real-time monitoring.
The three platforms can also integrate various data sources to facilitate comprehensive data collection, analysis, and visualization.
Among the three options, Grafana and Kibana have the most similarities. These tools have individually unique, but equally notable data visualization capabilities. Grafana and Kibana allow users to create interactive dashboards, reports, and other visualization types like charts, histograms, and more.
Meanwhile, Prometheus specializes is a monitoring and alerting toolkit that can be integrated with another visualization layer. Prometheus and Grafana work particularly well together, due to Grafana’s out-of-the-box support. Prometheus data can be visualized through Grafana, offering various visualization options.
This article analyzed each tool based on a set of key measures, namely:
- Setup and installation
- Configuration
- Architecture
- Use case/Purpose
- Data source compatibility
- Visualization Options
- Integration with External Tools
- Alerting Capabilities
- Data Querying Abilities
Read on to break down these qualities further as the article goes in-depth for each tool.
Grafana – Best for Generating Interactive Data Dashboards and Visualizations
Grafana is a notable open-source platform with over 20 million users worldwide. It’s often referred to as a visualization suite as it allows users to create unified dashboards with charts and graphs from various data sources. These telemetry visualizations aid in data interpretation and analysis, providing insights into data trends, anomalies, and performance metrics.
Grafana dashboards are also perfect for collaboration, enabling sharing within teams. Sharing helps facilitate reliable and consistent decision-making and troubleshooting. This quality also promotes a culture of data accessibility and collaboration across teams and organizations.
Grafana Setup, Installation, and Configuration
You can install Grafana in-house or access it via Grafana Cloud. The latter is the easiest way to get Grafana up and running with a minimal installation process. When installing it, you must deploy the Grafana server components and configure data sources through the web interface or configuration files.
Users can configure Grafana through its web interface or by editing configuration files. Configuration options include defining data sources, creating dashboards, setting up alerts, managing users and permissions, and customizing visualization settings.
Grafana Architecture
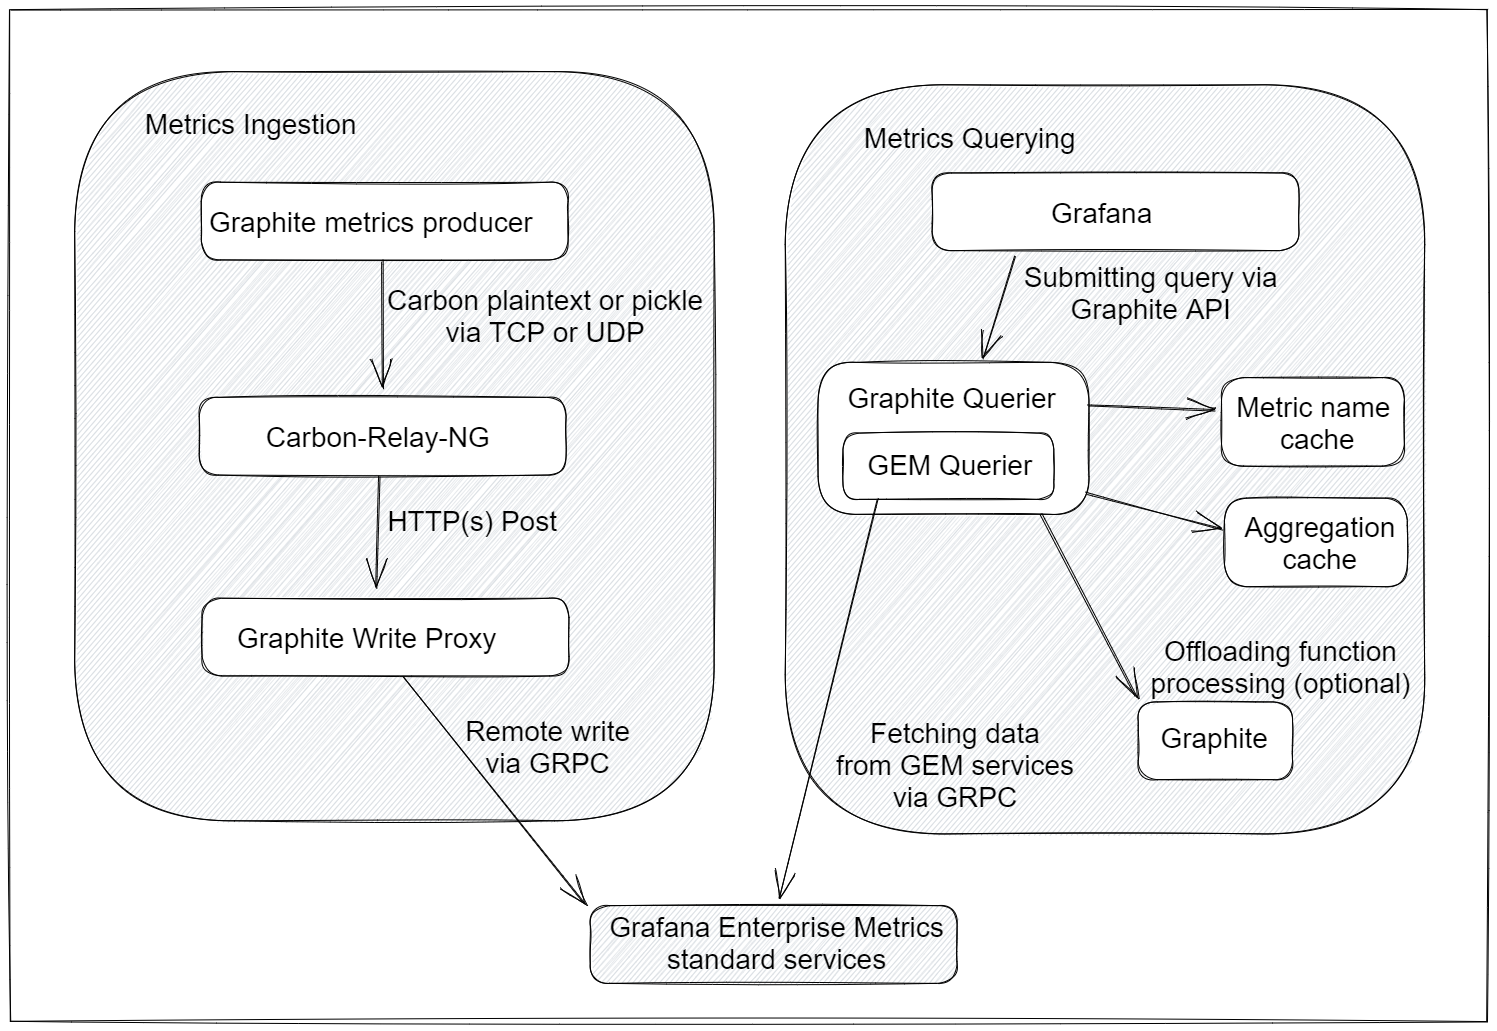
Image source: Grafana
Grafana’s architecture revolves around its Graphite integration. Graphite is a popular time-series database that facilitates efficient data management and querying.
The Graphite Proxy serves as a vital link between Grafana and Graphite. It enables smooth data exchange and extends the capabilities of the Graphite query language.
Metrics ingestion involves components like Carbon-relay-NG, which efficiently transfers data to the Graphite write proxy for processing. This component ensures smooth data flow into the Graphite database and enhances ingestion efficiency. For metrics querying, Grafana provides tools like the Graphite Querier, which allows users to extract insights from data stored in Graphite.
Grafana Alerting, Integrations, and Data Source Compatibility
Grafana alerts facilitate real-time system monitoring and swift responses to potential issues. It centralizes alerts from various sources. With multi-dimensional alerts, users can monitor specific system components closely, while advanced routing ensures notifications reach the right people promptly. Grafana users can also receive notifications via email, Slack, or other channels for alerts.
When it comes to integrations, Grafana offers a wide range of data sources:
- Custom APIs
- Log aggregators (e.g., Loki)
- Relational databases (e.g., MySQL, PostgreSQL)
- Cloud monitoring services (e.g., AWS CloudWatch)
- Time-series databases (e.g., Prometheus, Graphite)
Monitoring usually involves various components, such as exporters, scrapers, databases, and visualization tools. Grafana Integrations simplifies this by providing ready-made setups that can be deployed with minimal effort.
Kibana – Best for Log Querying and Analysis
Elastic introduced Kibana in 2019. It’s often called Elastic Kibana and has 12,561 users worldwide. It’s widely used for data visualization and reporting and forms a key component of the Elastic Stack, Elasticsearch, and Logstash.
Kibana is primarily used for data visualization, reporting, and analytics. Its versatility makes it suitable for various use cases, including:
- Monitoring
- Compliance auditing
- Log and metrics analysis
- Application performance monitoring
Users can also utilize Kibana for security analysis to visualize potential security breaches. This quality allows users to enable protective threat detection and response.
For teams that need this analysis to run continuously without manual queries, a Security Engineer Teammate can work alongside Kibana to surface threats proactively from the same log streams.
Kibana supports effective data querying capabilities through its dedicated query language, KQL (Kibana Query Language). KQL enables users to write concise search queries to filter and analyze data, facilitating efficient data exploration and analysis within Kibana’s interface.
Kibana Setup, Installation, and Configuration
You can download and install Kibana on Linux, Darwin, and Windows platforms. Installation involves downloading the appropriate package, extracting the files, and starting the Kibana server. Compatibility with specific versions of Elasticsearch is crucial for proper integration and optimal performance.
To configure Kibana, you need to edit the kibana.yml file. Its location varies depending on how Kibana was installed. You can change settings like host, port, SSL, and more. Use environment variables for configuration. After making changes, restart Kibana to apply them.
Kibana Architecture
Kibana is the frontend interface in the Elastic Stack architecture. It interacts with Elasticsearch to fetch and present data. It’s usually deployed alongside Elasticsearch and Logstash. Kibana emphasizes data visualization and user interaction.
It offers various services, such as:
- Data tutorials
- Kibana Core API
- Security features
- Reporting integration
- Visualization deployment
Kibana Alerting, Integrations, and Data Source Compatibility
Kibana allows users to create custom alerts based on index and metric thresholds. Alerts can be received through emails, Slack notifications, or integration with other third-party tools.
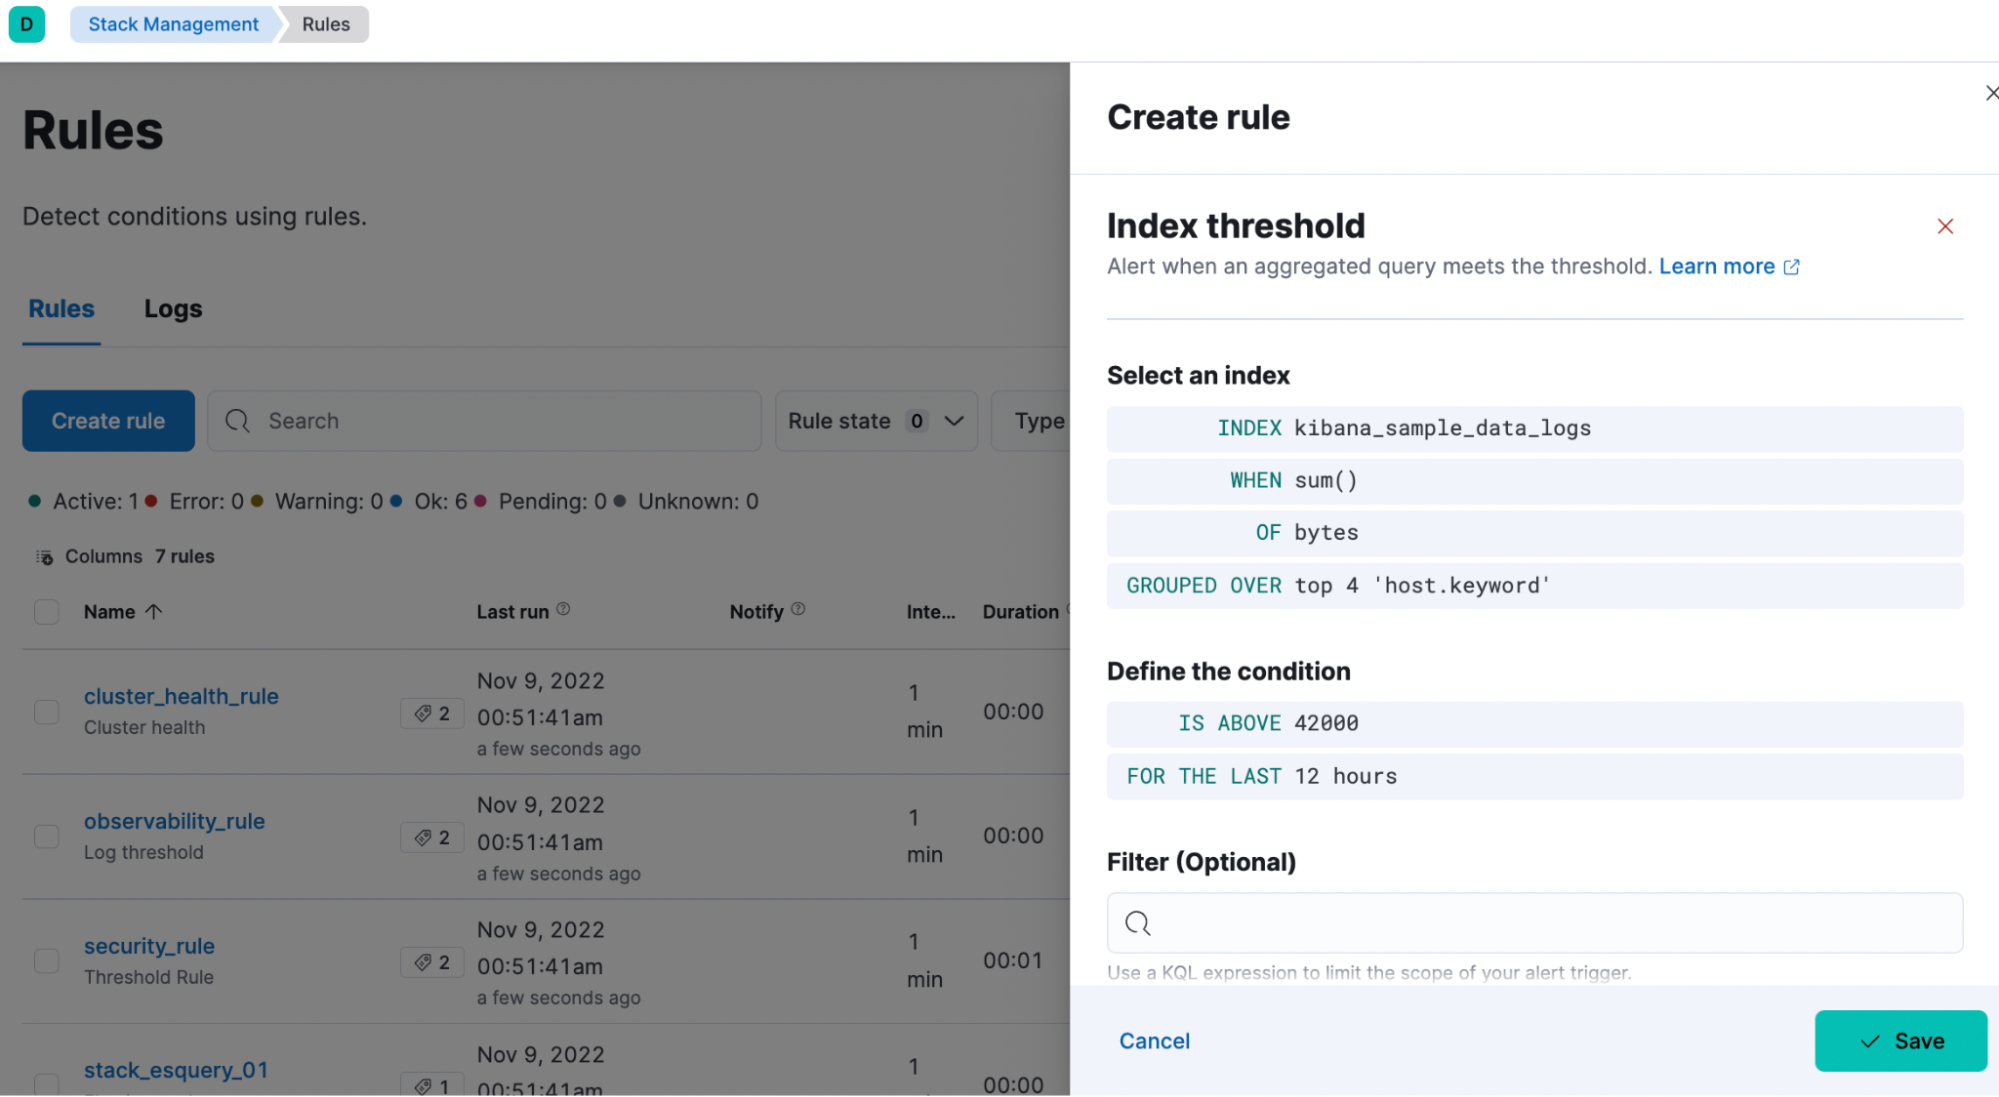
Image source: Elastic
In Kibana alerts, rules consist of conditions, schedules, and actions. Alerts are created upon condition detection, and actions are triggered per alert, facilitating individualized responses.
Kibana integrates only with Elasticsearch for data retrieval and indexing. Still, it supports integration with various workplace tools like incident management systems and notification tools.
The platform also offers extensive integration capabilities. It allows users to connect and collect data from various sources like:
- Applications
- Security activities
- Content repositories
- Cloud-native infrastructure
These integrations come with pre-built dashboards for quick analysis, providing end-to-end visibility within seconds. Users can also use the same data for endpoint protection against ransomware and malware.
Kibana also supports unstructured and semi-structured data, making it suitable for diverse analytics requirements. It can ingest and visualize data from various sources compatible with the Elastic Stack, including Elasticsearch and Logstash.
Prometheus – Best for Microservices Environments
Prometheus was originally developed by SoundCloud in 2012 to help the company meet its metrics and monitoring needs. Shortly after, Prometheus was released as an open-source monitoring tool. Over a decade since Prometheus’ launch, it has become one of the most prominent tools worldwide, with nearly 10,000 customers.
Today, Prometheus is an independent project under the Cloud Native Computing Foundation. The platform is suitable for collecting and storing numerical time series data. It excels in microservices environments with its machine-centric monitoring and monitoring of dynamic service-oriented architectures.
Prometheus’ multi-dimensional data collection and querying capabilities make it a reliable tool for diagnosing production issues. Grafana provides out-of-the-box support to visualize metrics from Prometheus.
Prometheus Setup, Installation, and Configuration
If your computer system meets the minimum requirements to install Prometheus, you can easily set up, install, and configure it. Simply download Prometheus for your computer’s operating system and unzip the file. Then, you go into the Prometheus folder and start setting up and configuring.
The overall process of setting up, installing, and configuring Prometheus is straightforward and not overly complicated. Prometheus follows a standalone architecture, eliminating dependencies on distributed storage or remote services.
Prometheus Architecture
Prometheus features an efficient architecture designed for simplicity and scalability. Its core is the Prometheus server, efficiently collecting metrics from diverse targets.
Then, Prometheus stores them in a time series database, while the Exporters facilitate integration with various systems, transforming and exposing metrics in Prometheus-compatible formats.
Its architecture is complemented by components like the Pushgateway for swift job monitoring, the Alertmanager for timely alert handling, and Service Discovery for automated target detection.
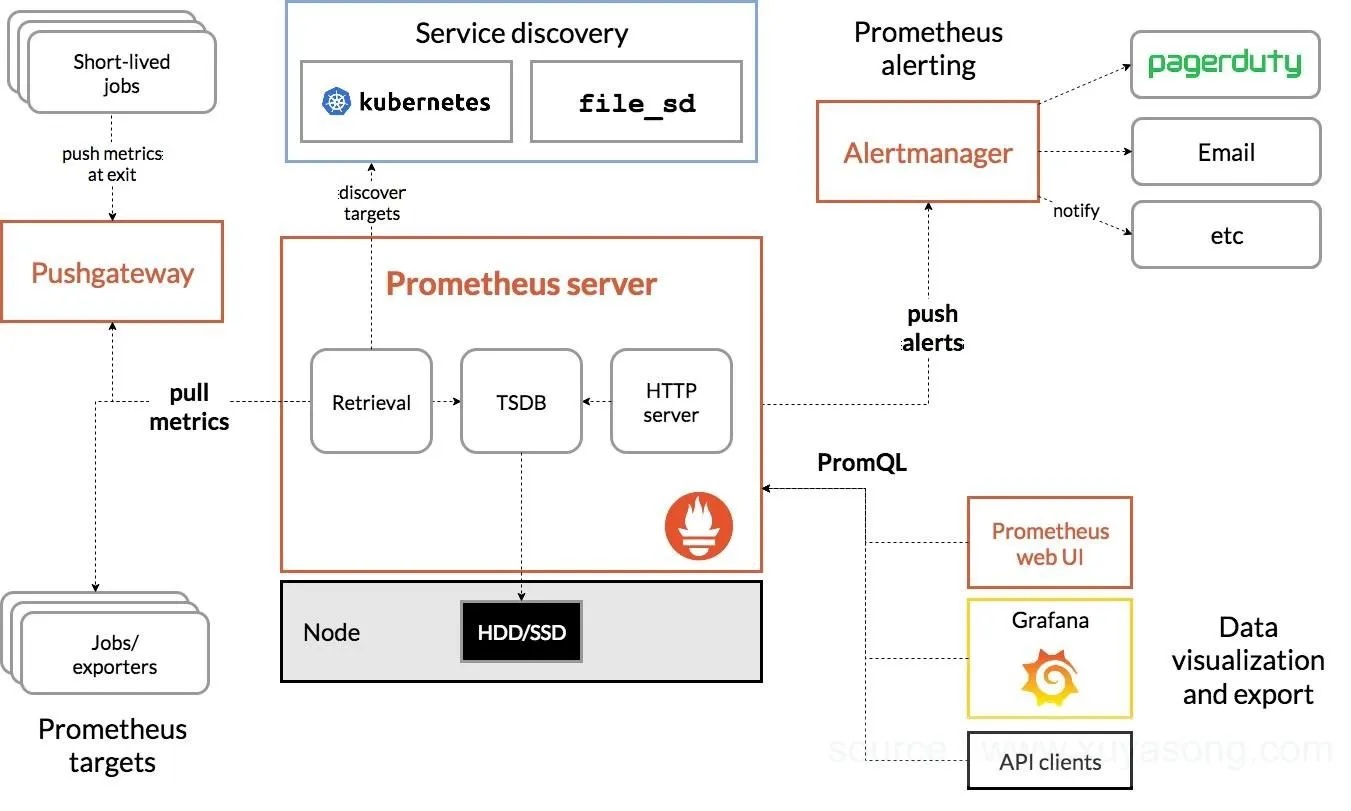
Image source: Medium
There are also optional components in Prometheus’ architecture. For instance, Grafana helps enhance visualization capabilities.
Prometheus Alerting, Integrations, and Data Source Compatibility
The Alertmanager manages Prometheus’ alerting capabilities. It handles alerts sent by client applications like the Prometheus server and performs tasks like deduplication, grouping, and routing alerts to appropriate receivers such as email or PagerDuty.
Core concepts implemented by the Alertmanager include:
- Grouping: Alerts of a similar nature can be grouped into a single notification. It’s helpful during larger outages when multiple systems fail simultaneously.
- Inhibition: This feature suppresses notifications for certain alerts if specific other alerts are already firing, preventing unnecessary notifications for unrelated issues.
- Silences: Temporarily mutes alerts for a given time. It’s configured based on matchers, determining which alerts to silence.
- Client behavior: Specifies requirements for interacting with the Alertmanager, mainly relevant to advanced use cases.
- High Availability: Supports clustering for high availability configurations, ensuring resilience in case of failures.
Prometheus integrates natively with various systems and applications, allowing comprehensive monitoring across diverse environments.
The platform is also a primary data source for monitoring and collecting time series data from instrumented systems and applications. It supports compatibility with various data formats and integrates with Grafana for visualization. Grafana uses Prometheus’s metric data to create customizable dashboards and visualizations.
Final Verdict
Grafana, Kibana, and Prometheus are indispensable tools for data visualization, analysis, monitoring, and observability in modern IT environments. These tools have unique qualities that make them suitable for specific situations.
While Grafana and Kibana focus on visualization and analytics, Prometheus specializes in monitoring and alerting. Together, they form a powerful stack for comprehensive data-driven insights and decision-making.
The final verdict depends on specific use cases, requirements, and familiarity with underlying technologies. Teams can extend any of these stacks with Edge Delta’s SRE Teammate, which connects monitoring data to active incident response — automatically correlating signals across tools to surface root cause.
FAQs on Grafana vs. Kibana vs. Prometheus
Which is better Kibana or Grafana?
Kibana and Grafana both excel in data visualization. Choosing which is better depends on your organization’s specific data analysis and visualization needs.
What is the difference between Grafana and Prometheus?
Grafana mainly focuses on data visualization, while Prometheus is centered on data acquisition. The two platforms work well together, with Prometheus as a Grafana data source.
What is the difference between Kibana and Prometheus?
Kibana is a tool for data visualization and analyzing log data and metrics from Elasticsearch. On the other hand, Prometheus is a monitoring and alerting toolkit designed for applications and infrastructure.

