Organizations are always working to gain stronger control over their telemetry data volume growth, and pipelines have emerged as a key enabler. Gartner predicts that “by 2026, 40% of log telemetry will be processed through a telemetry pipeline product.”
Effective telemetry pipeline solutions enable organizations to gather, enhance, process, and direct data to various destinations. This approach empowers organizations to manage their data effectively, cutting down on ingestion and storage costs.
And from the outside, it can sometimes appear as if adopting any type of telemetry pipeline will be enough to manage the spiraling complexity and costs of managing observability and security data.
However, the amount of value you extract is dependent on the particular pipeline being used, as the underlying architecture matters a lot.
Complex pipeline architectures might be functionable but they are not all suited to handle telemetry data at scale. Additionally, maintenance costs on certain pipeline models can add up, which negatively impacts their value.
Differences in pipeline architectures
Organizations have their pick of various pipeline architectures to maintain high functionality when handling large volumes of telemetry data. For instance, one of the most widely-used tools is Kafka, which employs a “centralize-then-analyze” method by gathering data from multiple sources and centralizing it before processing.
Closer to home, next-generation pipelines — like Edge Delta’s Telemetry Pipelines — are a novel approach to telemetry pipeline architectures, providing more flexibility and efficiency compared to traditional centralized cloud models. By beginning processing directly within the user’s environment, closer to the data sources, transformation and routing tasks become significantly less resource-intensive, and serve as a cost-effective alternative to traditional pipeline architectures.
It’s almost always better to show than tell, though. So we at Edge Delta conducted an experiment with granular transparency by testing four distinct pipelines that leverage popular data collection and aggregation tools to determine which performed optimally from a cost-perspective.
Spoiler: Edge Delta’s Telemetry Pipelines emerge as the clear winner, and you can download our white paper to see exactly why, but below are the pipelines we tested and how we ran our experiment and resulting analysis.
Pipeline architectures we tested
For simplicity’s sake, we experimented with the performance on only the most common pipeline functionality: transforming logs into metrics via log aggregation. Logs were converted to metrics via regular expressions.
Each pipeline was hosted in AWS — on EC2 instances, specifically — and Amazon Cloudwatch and Amazon S3 were used for querying and storing logs, respectively.

The pipeline architectures we compared were:
OpenTelemetry Collector

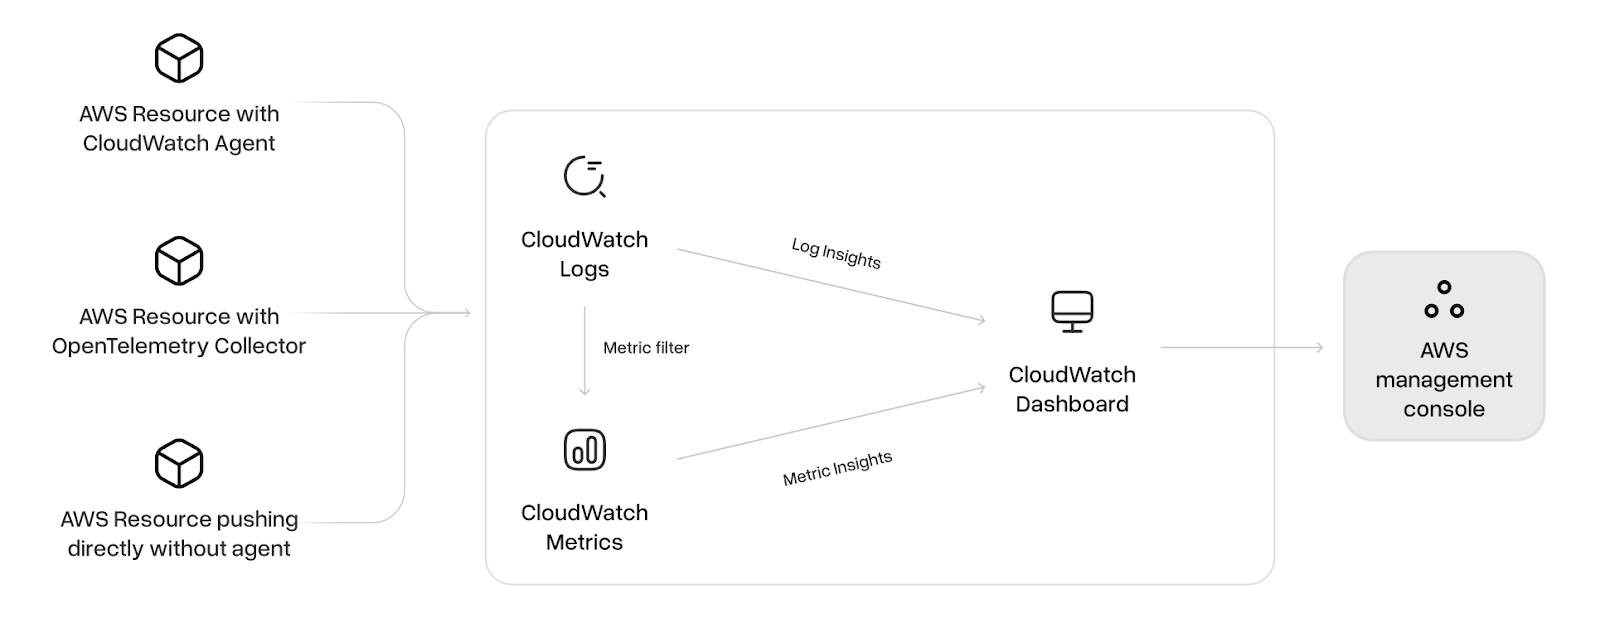
In this instance, logs are collected from the source using OpenTelemetry Collector and exported directly into Amazon CloudWatch Logs. The OpenTelemetry Collector gathers synthetic logs and sends them in batches to the designated destination.
Kafka Middleware

In this pipeline, logs are gathered using the OpenTelemetry Collector and sent outside the customer’s environment to a designated Kafka topic. From there, the logs are consumed, transformed into metrics using ksqlDB, and forwarded to CloudWatch Metrics.
For hosting Kafka, we utilized Confluent, a third-party cloud-hosted provider known for its cost-effective solutions. The primary distinction between this setup and the previous architecture lies in how metrics are handled: here, the Kafka connector aggregates logs internally and directly pushes the generated metrics to CloudWatch Metrics, unlike the earlier approach where metrics were created on demand during log queries.
Edge Analytics

In this configuration, an Edge Delta fleet operates directly within the customer’s environment, at the source of log generation. The agents in the fleet monitor logs, apply regex patterns, and convert the logs into metrics. These metrics are then sent directly to S3 and CloudWatch Metrics.
For querying logs on a 10-minute window scale every minute, we followed the same approach as the previous pipeline, utilizing the GetMetricStatistics API to query metrics directly from CloudWatch Metrics. This method reduces both computational overhead and costs compared to generating metrics on demand, while also eliminating the need for Kafka as a middleware solution in the pipeline.
End-to-End Edge

This setup goes beyond the previous pipeline by completely eliminating the use of CloudWatch Metrics. Instead, the agent fleet processes log streams at the edge, deriving metrics locally and sending them directly to the Edge Delta backend. With metrics being generated and retained within the Edge Delta environment, there is no need to execute query jobs from external sources.
How we tested the pipelines
To evaluate each of these pipelines, we performed a 30-minute experiment in a newly provisioned Kubernetes cluster. Each pipeline and test configuration was assigned its own separate cluster. And each pipeline was hosted in a simulated Kubernetes environment by setting up a K3s cluster on a single Amazon EC2 c5.4xlarge machine. We generated synthetic Apache access logs using flog.
Two distinct test cases were conducted to assess the cost-effectiveness of each pipeline:
1) 1 terabyte of log throughput per day with 5 metrics to query
2) 1 terabyte of log throughput per day with 20 metrics to query.
Results
The outcome of our experiment uncovered significant differences in total cost of ownership (TCO) across the evaluated telemetry pipeline architectures, particularly under high-volume data ingestion scenarios.
Specifically, the cost distribution revealed that data ingestion and processing operations constitute the bulk of expenses in traditional pipelines, and that next-generation pipelines perform far and away better.
To see the full results for each pipeline type and its corresponding cost breakdown, and learn how traditional telemetry pipelines are becoming increasingly inefficient, download our white paper.


