As organizations scale to handle increasing volumes of observability data, accurately tracking the log-generating sources within their environments becomes extremely challenging. This is a huge problem — in-depth knowledge of these sources is critical, especially in the context of working with observability pipelines. Without it, pipeline inputs cannot be configured or modified correctly on a log-generating source level, and as a result, any environment-generated telemetry data will not be properly collected, processed, or routed.
Simply put, this knowledge is vital for maintaining full visibility into your environments. Users must remain vigilant by keeping track of the log-generating sources within their systems and configuring their pipelines accordingly.
Previous solutions required users to add high-level sources (Kubernetes, for example) as pipeline inputs, then specify for the agent exactly which log-generating sources (pods or namespaces, for example) it should monitor.
The issue?
Constructing these configurations is extremely cumbersome! Users waste time investigating their own environment to identify which sources need to be tracked, and once finished must give that information to the agent manually.
That’s why we built Auto Source Detection. With it, Edge Delta has completely automated the source detection process, simplifying the pipeline configuration and development experience. Users can now easily see their collection of log-generating sources within their high-level source, enabling them to isolate and aggregate logs generated from the deployment all the way down to the pod level.
Continue reading to learn more about how this new feature works, and what it means for the future of your Edge Delta Observability Pipelines.
What’s New?
Here is a high-level breakdown of the new release:
- Automatic Source Detection embedded directly into the agent fleet creation flow
- User-driven choice on which sources to track
- Support for Kubernetes, Linux, and MacOS environments
How Does it Work?
Let’s walk through a simple example of how Auto Source Detection works in practice. We will deploy an agent fleet within a demo Kubernetes cluster, as shown below:
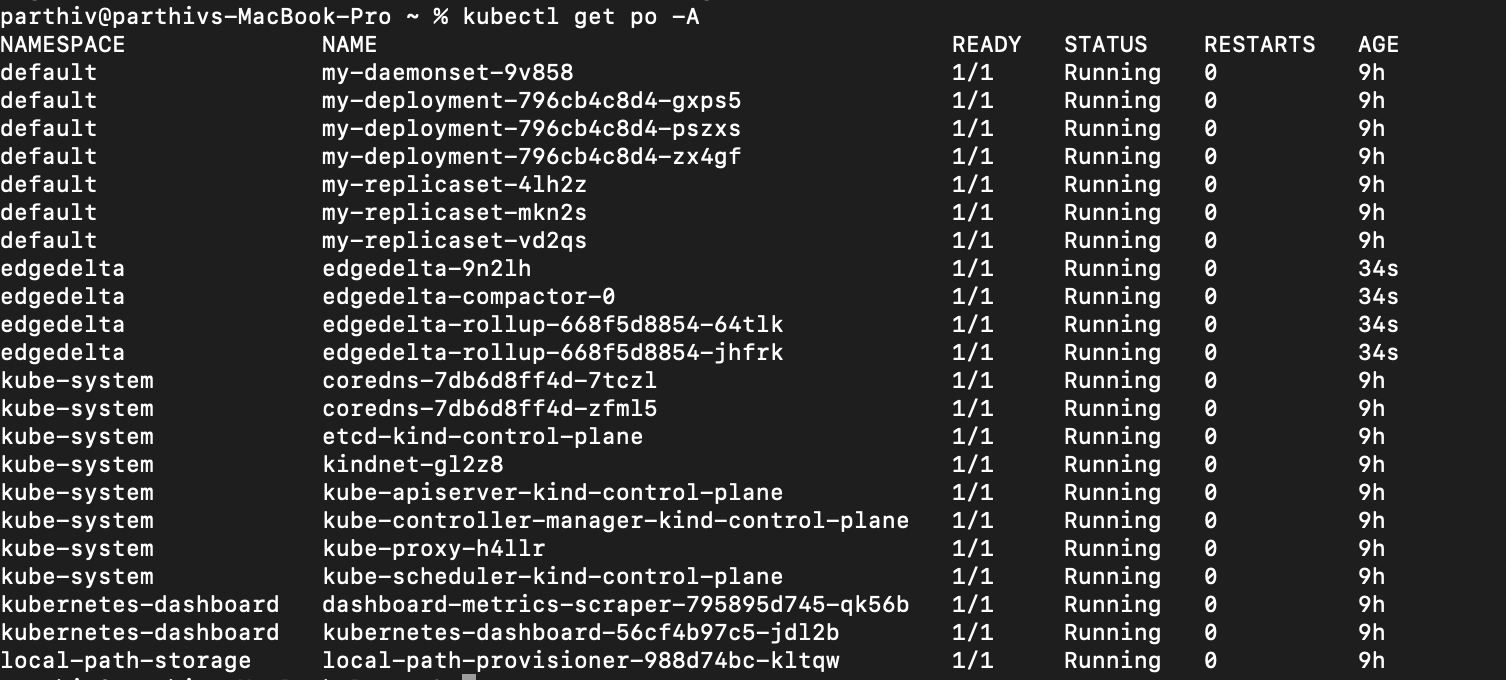
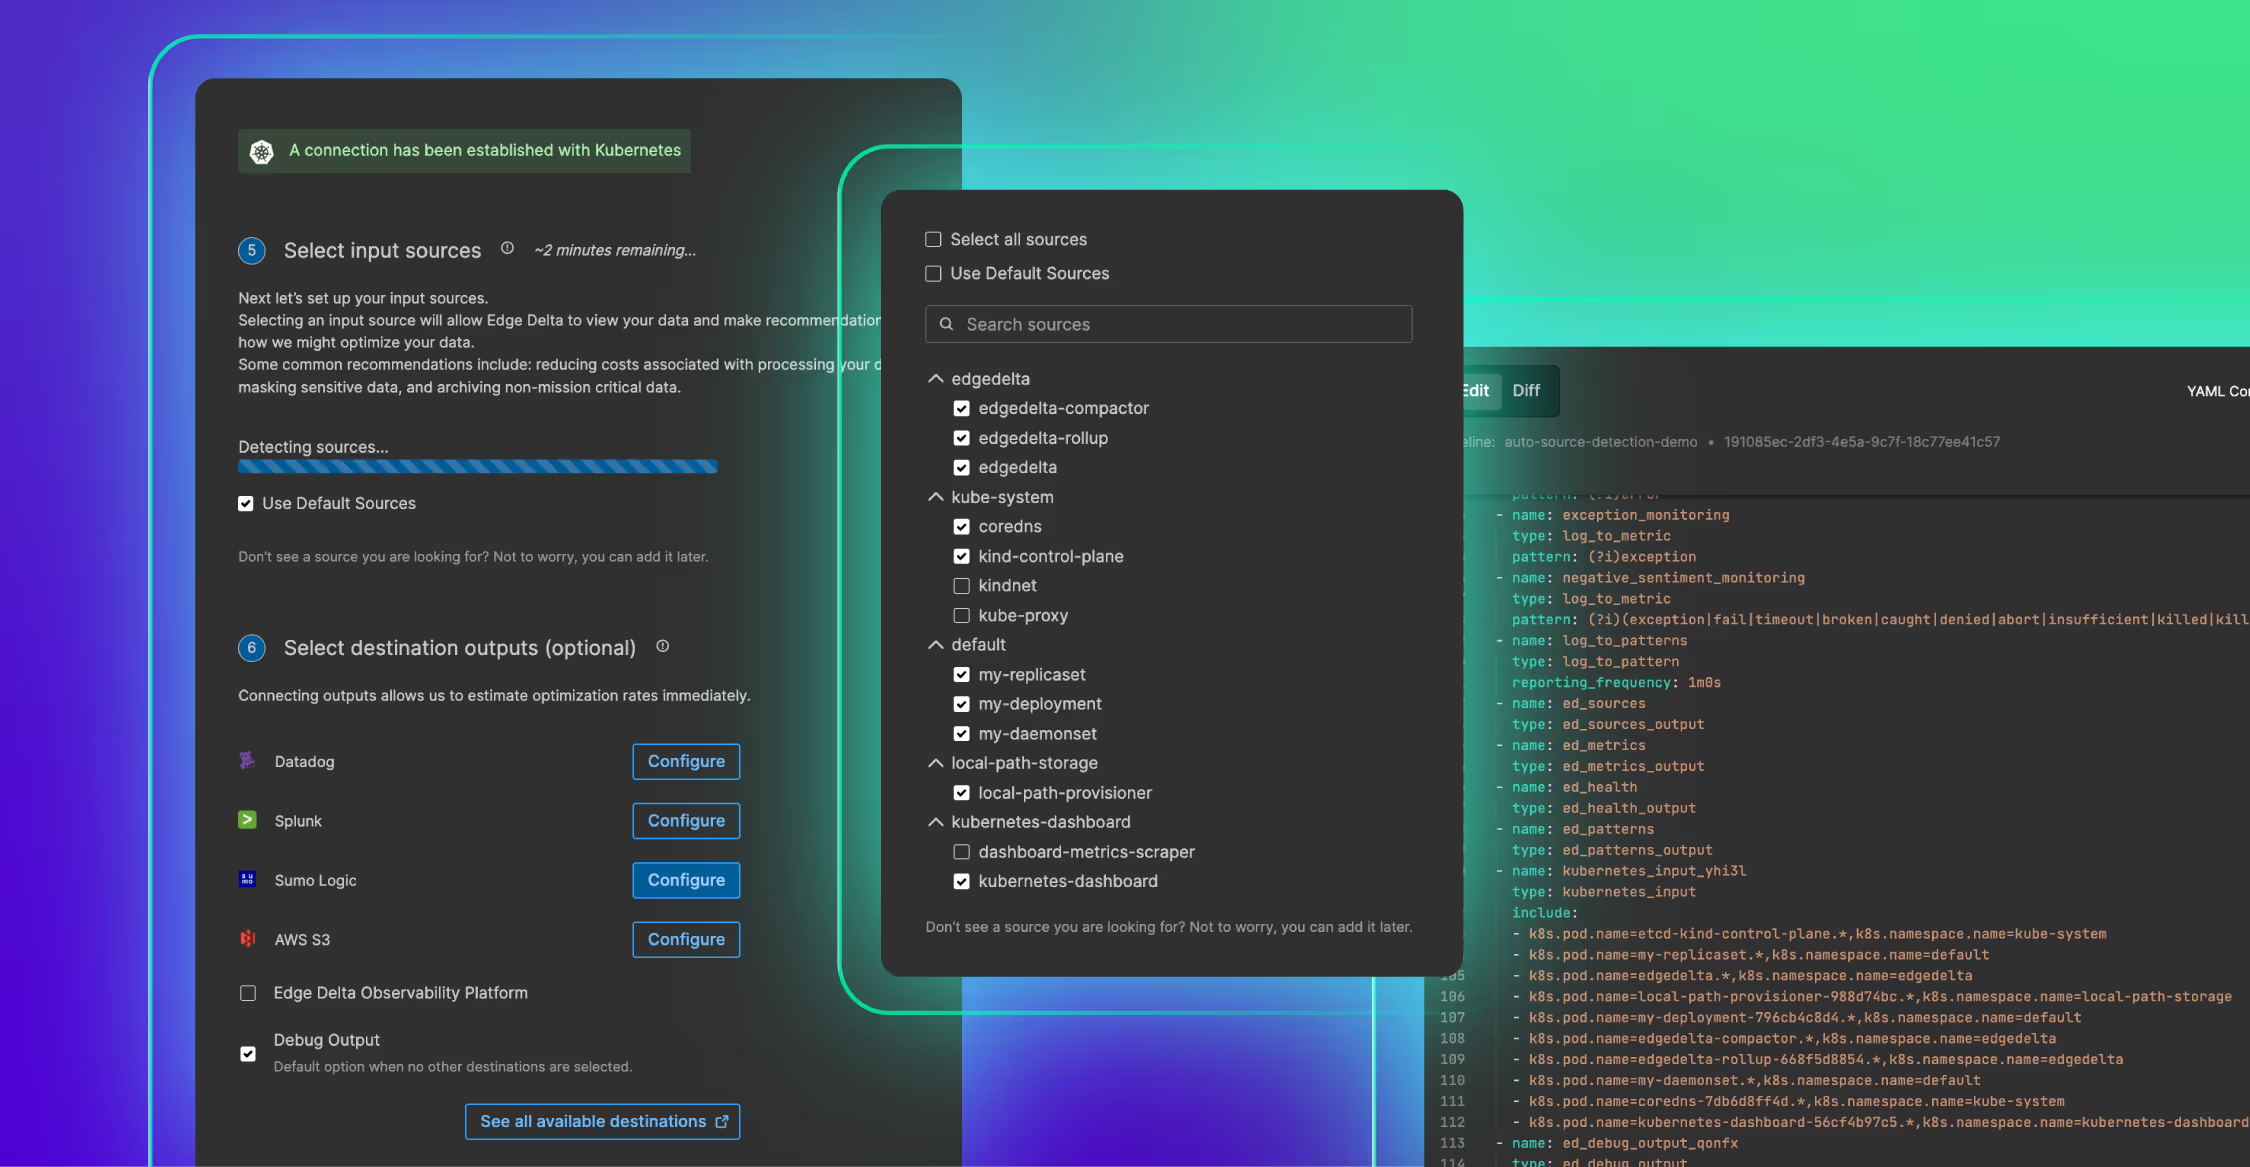
After its heartbeat is verified, the Edge Delta agent fleet combs through the user environment, tracking each log-generating source.
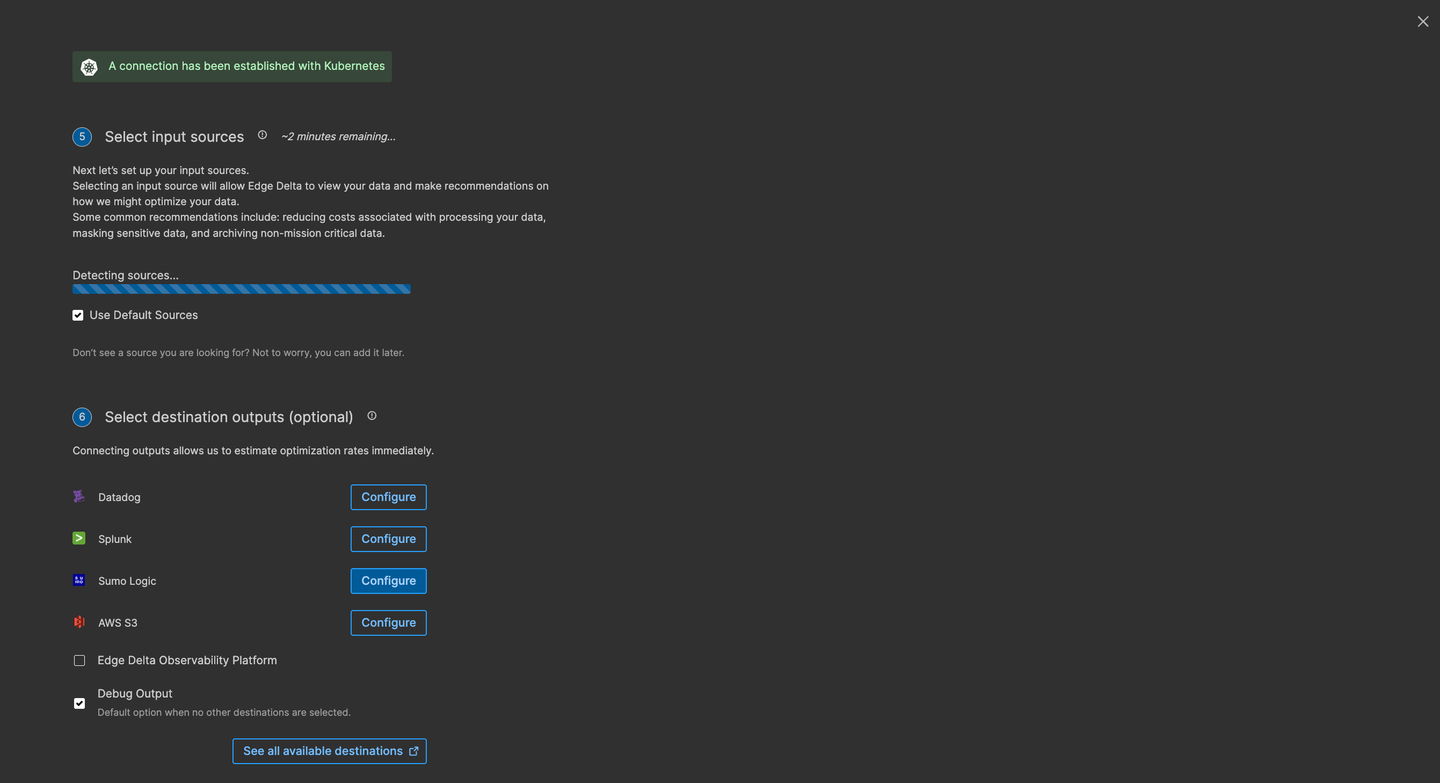
Once finished, the user is presented with a source mapping visualization, including all discovered sources and any parent-child source relationships.

And that’s it!
After deploying the agent fleet, users can choose which sources to include as pipeline inputs, and the fleet will automatically adjust to interact only with the data originating from those sources.
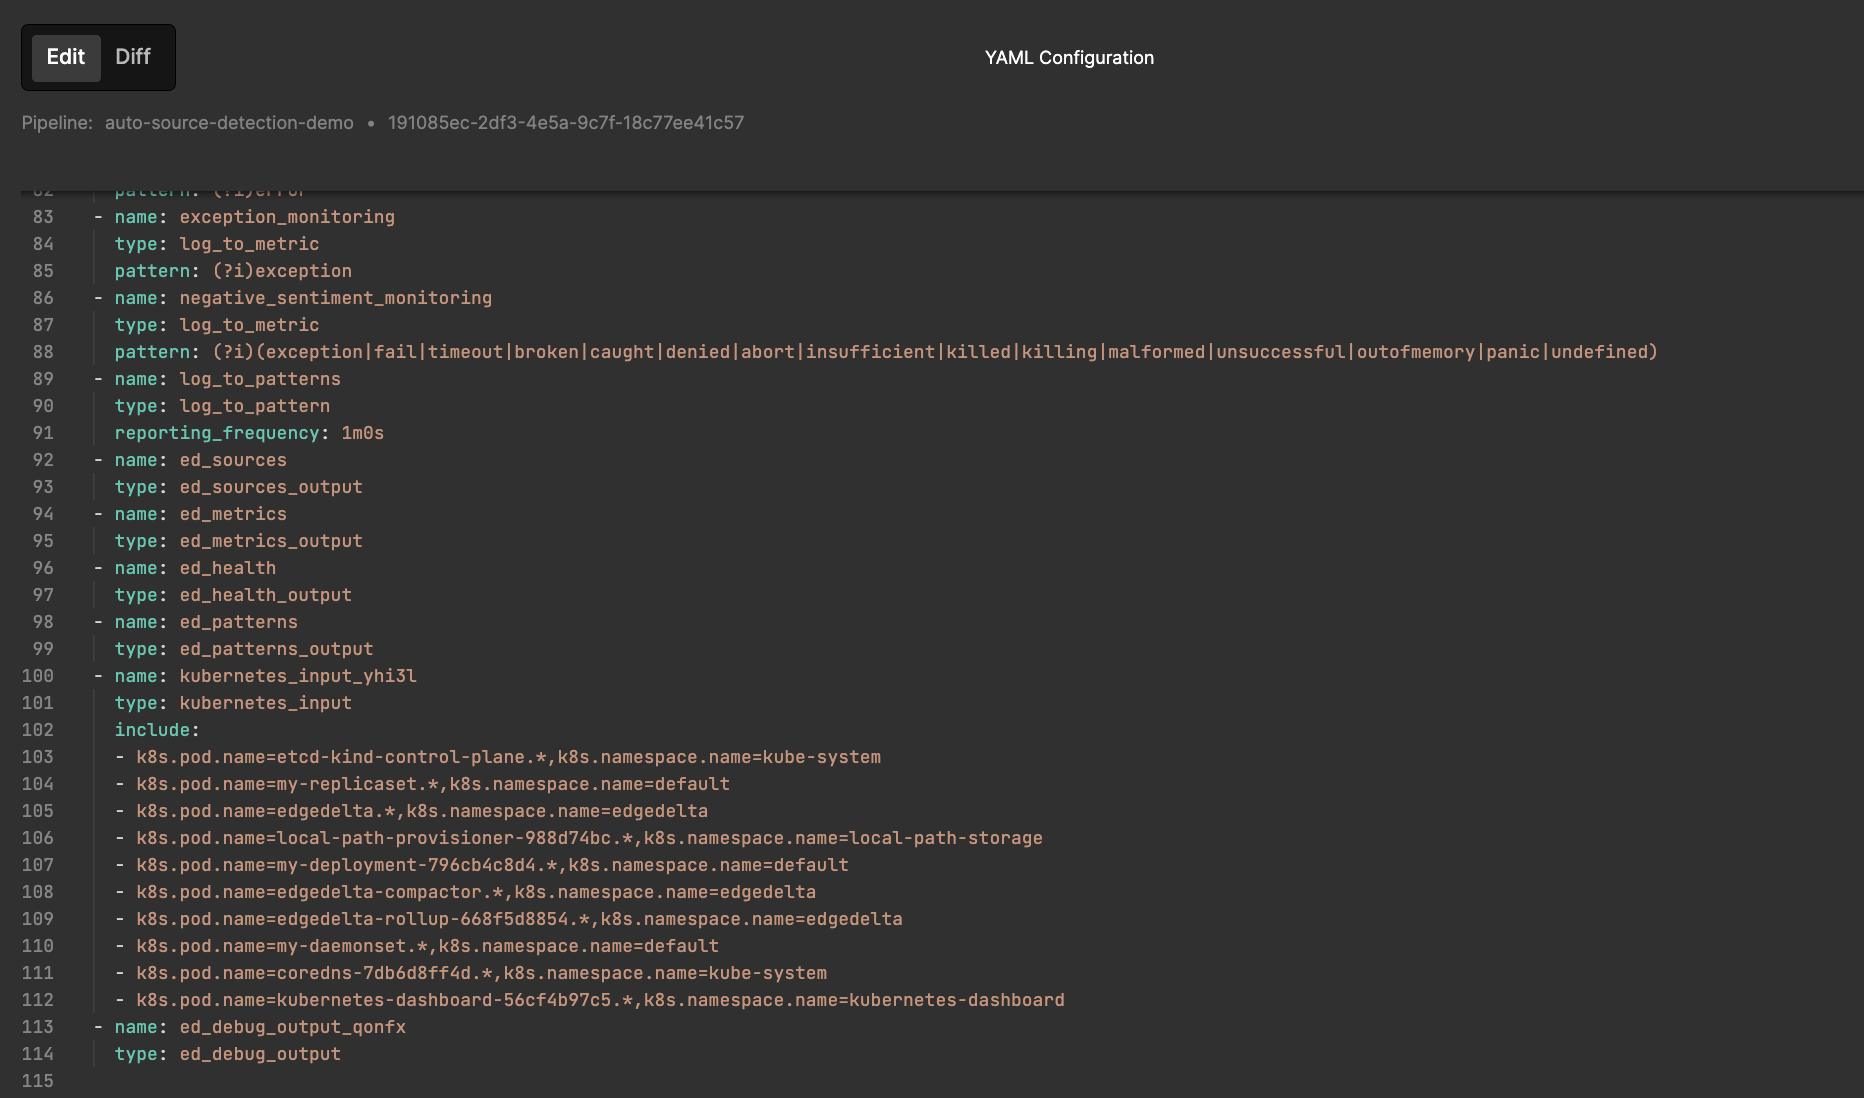
**And with that, a fully functioning Edge Delta Observability Pipeline is up and running! The user can now take a step back and let Edge Delta extract value from their telemetry data through pattern creation, anomaly detection, and much more.
As always, it will present the user with data optimization recommendations for the different input sources, including masking data, archiving non-critical data, and more. Additionally, users can modify their pipeline once it is created in a variety of different ways, including adding any other sources which weren’t originally tracked.
Supported Environments
Source detection is supported for multiple input types including the Kubernetes, Linux, and MacOS environments. During deployment, the user can select which environment to deploy within, and the agent fleet will present them with the appropriate sources.
Getting Started
Auto Source Detection is now live in the Edge Delta environment. Give it a try!

