Check Point Software Technologies offers an extensive platform of cybersecurity solutions, dedicated to protecting corporate enterprises and governments.
As part of its threat-prevention solutions, Check Point generates firewall logs, which then can be exported to various SIEM applications — such as Splunk, LogRhythm, Arcsight, RSA, and more — for further analysis.
What is the Check Point Pipeline Pack?
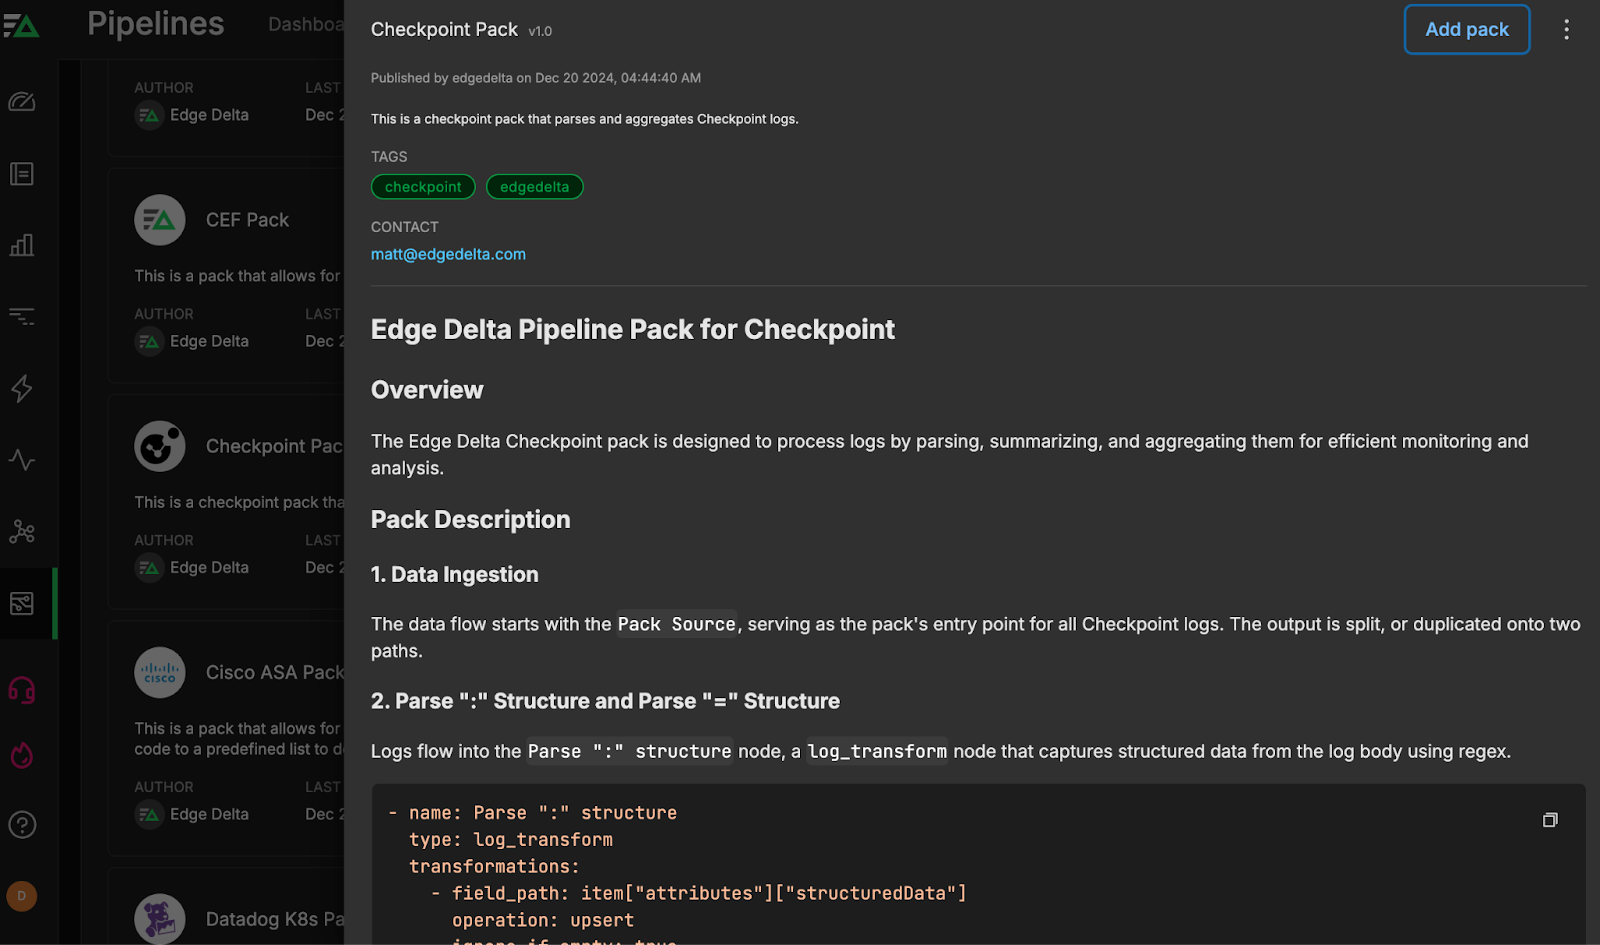
For security teams already using the cybersecurity platform, Edge Delta offers a Check Point Pipeline Pack for Telemetry Pipelines to strengthen and quicken monitoring and threat analysis.
This pre-built collection of processors is specifically designed for Check Point firewall logs. With efficiency in mind, the pack automatically parses, summarizes, and transforms them so they can then be routed, via Edge Delta’s Telemetry Pipelines, to any downstream destination for deeper investigations or simple storage.
Edge Delta Telemetry Pipelines handle logs, metrics, traces, and events data. By processing telemetry data as it’s created at the source, you gain expansive control over your data at far lower costs.
In this post, we’ll talk about how the Check Point Pack operates, and the benefits you’ll get once it’s implemented.
How Does the Check Point Pack Work?
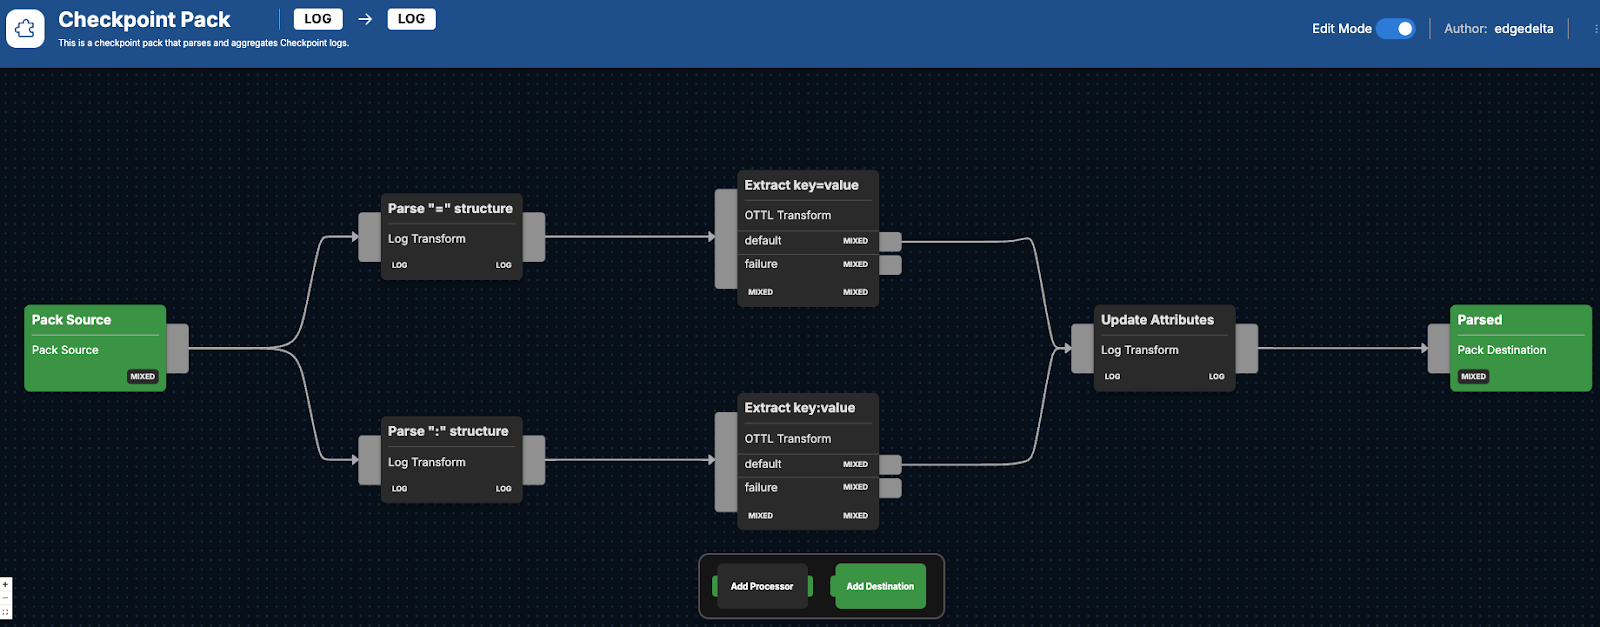
The Check Point Pack includes a number of processors to improve the usability of the data being generated by Check Point’s firewalls. Part of this process includes consolidating log data into only the most critical elements for more efficient analysis. The data is also transformed via an Observability Telemetry Transformation Language (OTTL) node, which helps with extracting data-driven insights. Finally, the logs are run through context-specific transformations, such as data cleanup. Below we’ll look at the sequential processors the logs are run through and what you can expect.
Data Parsing
After Check Point firewall log data begins flowing into the Check Point Pack, it will run the raw logs through two separate nodes:
Parse ":" structureCaptures key-value pairs, which assists in identifying specific actions that were recorded from the log body using a regex filter. This operation is defined as follows:
- name: Parse ":" structure type: log_transform transformations: - field_path: item["attributes"]["structuredData"] operation: upsert ignore_if_empty: true value: regex_capture(item["body"], "^.*?[(?P<log>action:.+)]").log
Parse "=" structure
Takes key-value pairs separated by equal signs within the log entries, and prepares them for additional processing:
- name: Parse "=" structure
  type: log_transform
  transformations:
    - field_path: item["attributes"]["structuredData"]
      operation: upsert
      value: regex_capture(item["body"], "^.*? (?P<log>time=.+)").log
OpenTelemetry Transformations
The Check Point logs are then run through two different types of OTTL transformations, depending on which of the two routes they initially followed during the initial parsing process.
Logs that were initially run through the Parse ":" structure node move through the Extract key:value node, which uses OTTL to switch key-value pairs into a usable format for eventual analysis:
- name: Extract key:value
  type: ottl_transform
  statements: merge_maps(attributes, EDXParseKeyValue(attributes["structuredData"], ":", "|", true), "upsert")
Meanwhile, any logs that were initially run through the Parse "=" structure node will be sent through their own OTTL transform node to ensure any attributes are converted into a structured data format:
- name: Extract key=value type: ottl_transform statements: merge_maps(attributes, EDXParseKeyValue(attributes["structuredData"], "=", "|", true), "upsert")
In both cases, any logs that cannot be transformed are then removed, preventing unnecessary duplication and increased efficiency on the pipeline journey.
Updated Attributes
Next, both sets of remaining processed logs merge through the Update Attributes node, a final transformation node for context-specific transformations that involves:
- Timestamp conversion: Changes time attributes into a consistent Unix millisecond format
- Structured data cleanup: Removes intermediate structured data fields post-extraction
- Host assignment: Sets the host field using the origin, defaulting to “unknown”
At the very end of the Check Point Pack process, all remaining processed logs exit through the Parsed node, and can then be routed to any final destination for continued inspection.
Check Point Pack in Practice
You can find the Check Point Pack by navigating to the Pipelines section within Edge Delta, and then clicking on “Knowledge,” and then “Packs.” Then, scroll through our list of packs — which are organized alphabetically — until you find the Check Point Pack. Once you do, click “Add to pipeline” and select the pipeline you’d like to install the pack on. If you don’t already have a pipeline setup, you’ll need to create one first.
Once you’ve added the pack to a pipeline, you can hop into the Visual Pipelines builder. From there, you can drag and drop your connection from the initial Check Point Logs source to the pack. Finally, you’ll need to add your eventual Destination(s) in Visual Pipelines, and once added, you can easily drag and drop new connections to send the processed data from the pack into them.
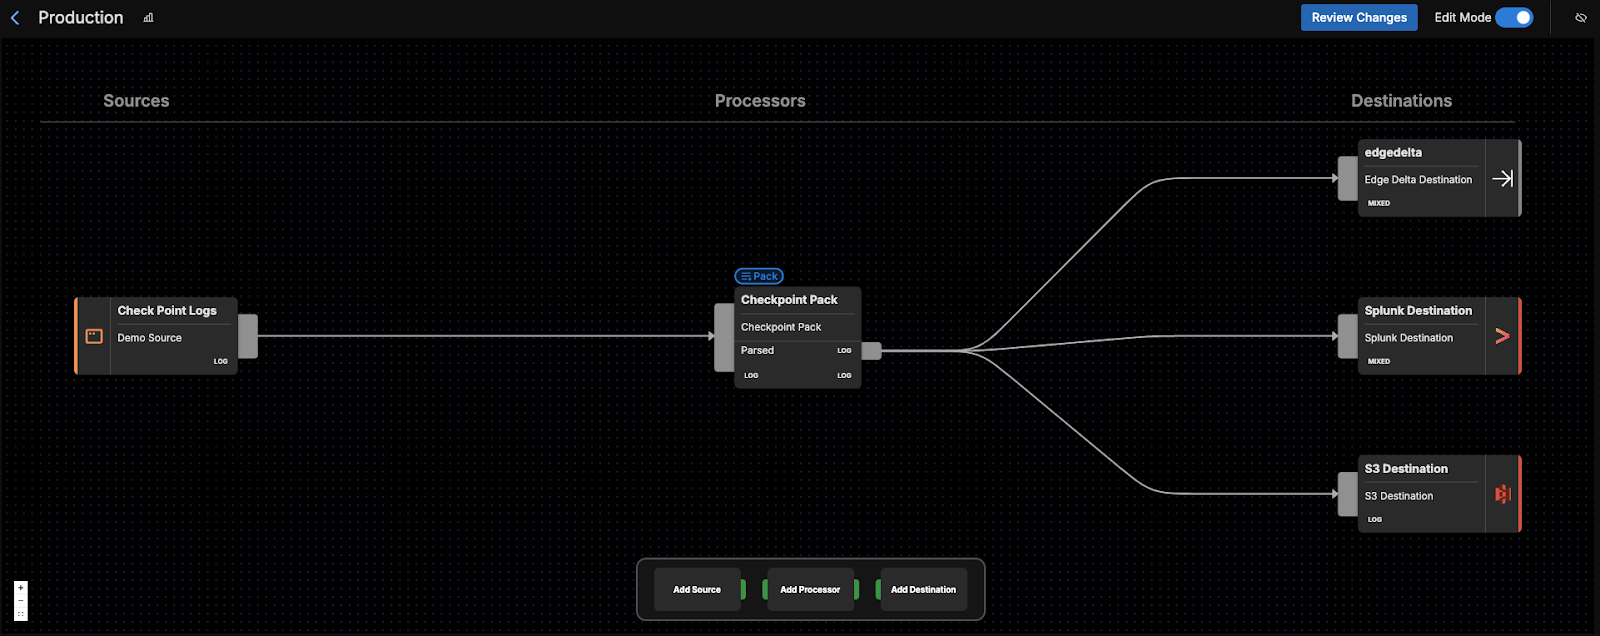
For instance, you can route your processed Check Point logs to a SIEM or other platform like Splunk or Microsoft Sentinel for further investigation. You could also ship them to S3 for archival storage and compliance purposes. Edge Delta is also another good choice for a Destination, where any processed logs can be monitored in real time for quick remediation.
Getting Started
Ready to see it in action? Visit our pipeline sandbox to try it out for free! Already an Edge Delta Customer? Check out our packs list and add the Check Point Pack to any running pipeline.


