

At Edge Delta, we believe observability should be seamless, scalable, and cost efficient — without drowning teams in excess data.
That’s why we’re excited to announce that Edge Delta Telemetry Pipelines now natively support Dynatrace — including its cutting-edge Grail technology — as a destination for all log, metric, and trace data. This integration allows teams to intelligently collect, pre-process, and optimize telemetry data before it reaches Dynatrace, ensuring that only the most valuable data is ingested in the optimal format to enhance downstream monitoring and analysis.
Best of Both Worlds
Before joining Edge Delta I spent eight years working at Dynatrace, and have seen first hand how powerful the platform can be. A prime example of this is Dynatrace’s Grail technology – a causal data lakehouse product that leverages parallel processing to help teams increase query performance and strengthen telemetry data monitoring and analysis.
At the same time, I’ve also seen how quickly data volumes can spiral out of control without an efficient management strategy, and how that minimizes much of what makes Dynatrace valuable.
That’s why I’m excited about this new Edge Delta integration. Pairing Edge Delta’s end-to-end Telemetry Pipelines with Dynatrace results in control and visibility over your telemetry data, along with powerful insights. As organizations scale, and the sheer volume of logs, metrics, and traces lead to higher ingestion costs and unnecessary noise, Edge Delta’s pipeline architecture can help:
1) Reduce ingestion costs by filtering, aggregating, and summarizing logs at the source.
2) Enhance signal clarity by structuring logs before they reach Grail for more efficient querying.
3) Surface anomalies earlier by detecting patterns and outliers before they reach downstream systems.
With Edge Delta and Dynatrace Grail together, teams get faster, more efficient log analytics — without data overload.
How It Works
Edge Delta sits upstream of your observability stack, processing data closer to the source, before it reaches Dynatrace. With this integration, Dynatrace users can:
?Aggregate or filter out low value datasets to reduce noise and costs.
? Route logs, metrics, and traces directly to Dynatrace Grail in a clean, optimized format.
? Transform and enrich telemetry data before ingestion, enhancing query performance and strengthening insight quality.
? Leverage Edge Delta’s pattern detection to surface issues before they impact users.
Let’s walk through a short example to demonstrate the power of pre-processing with Edge Delta.
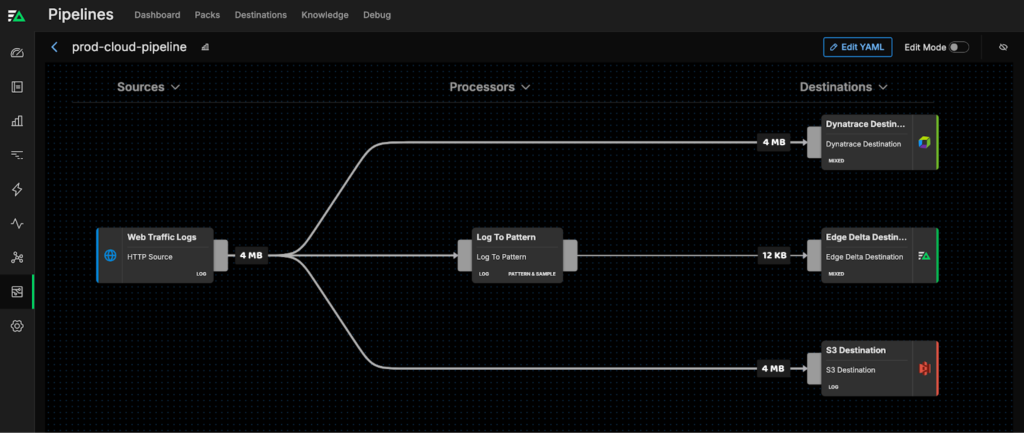
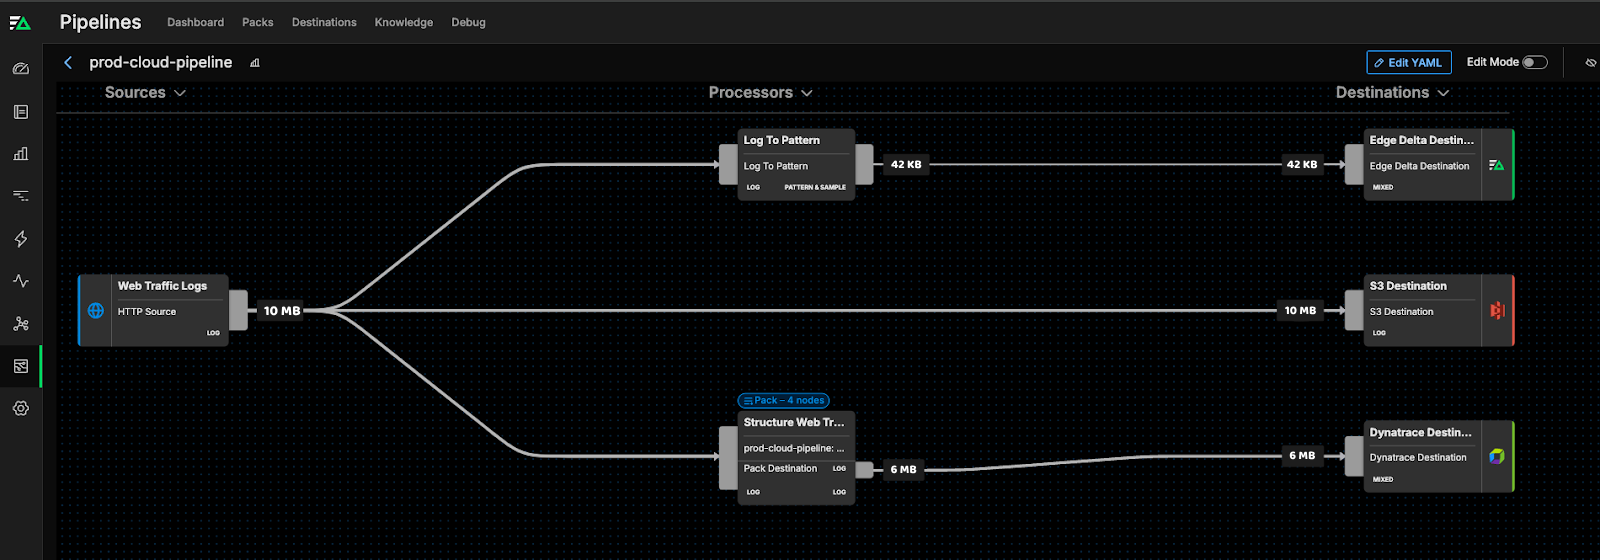
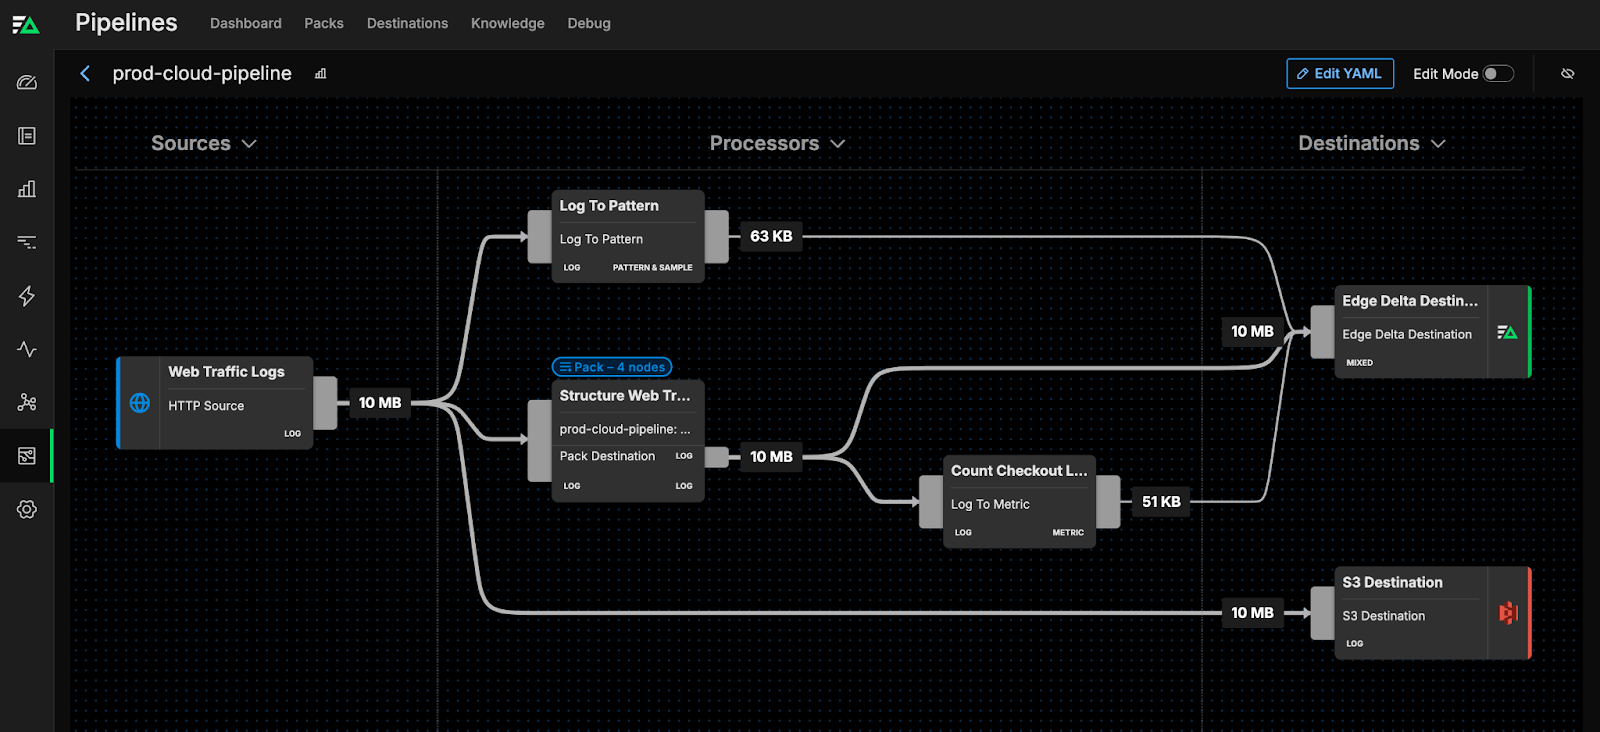
Here we have a lightweight demo pipeline configured to ship synthetic web traffic logs via HTTPS into a newly spun up Dynatrace account. Additionally, pattern data is being sent into Edge Delta’s backend via our log to pattern node, while a full copy of all raw data is shipped into an S3 bucket for archival.
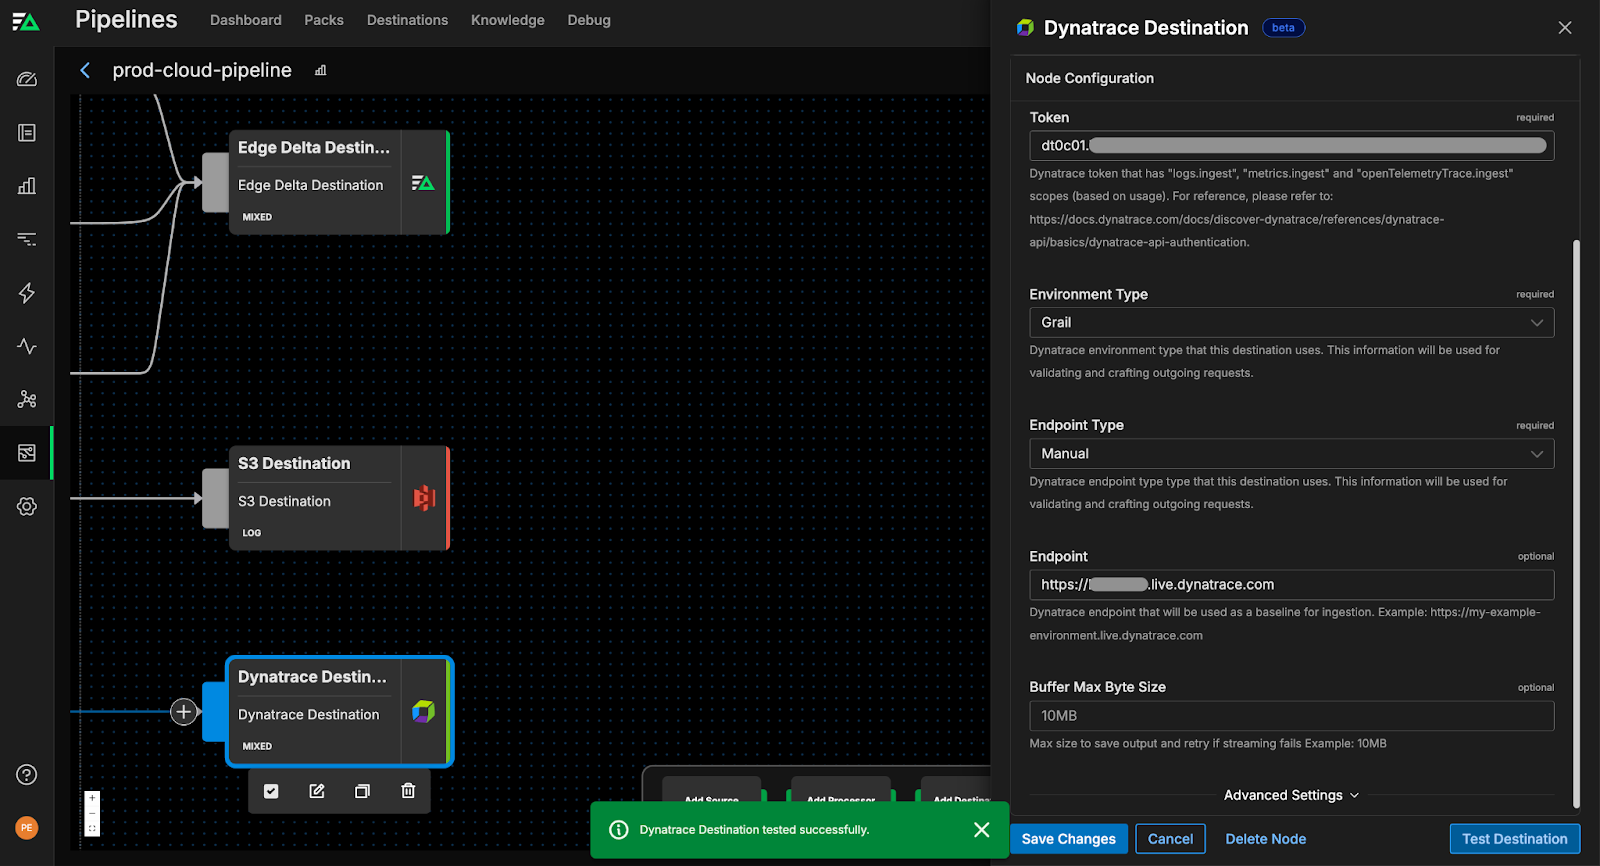
Configuring a Dynatrace Destination in our Visual Pipeline Builder interface is straightforward — simply add your auth token, specify environment and endpoint type, and link your Dynatrace endpoint all within the Dynatrace Destination node. Once added, you can also easily test the connection to confirm it’s working smoothly:
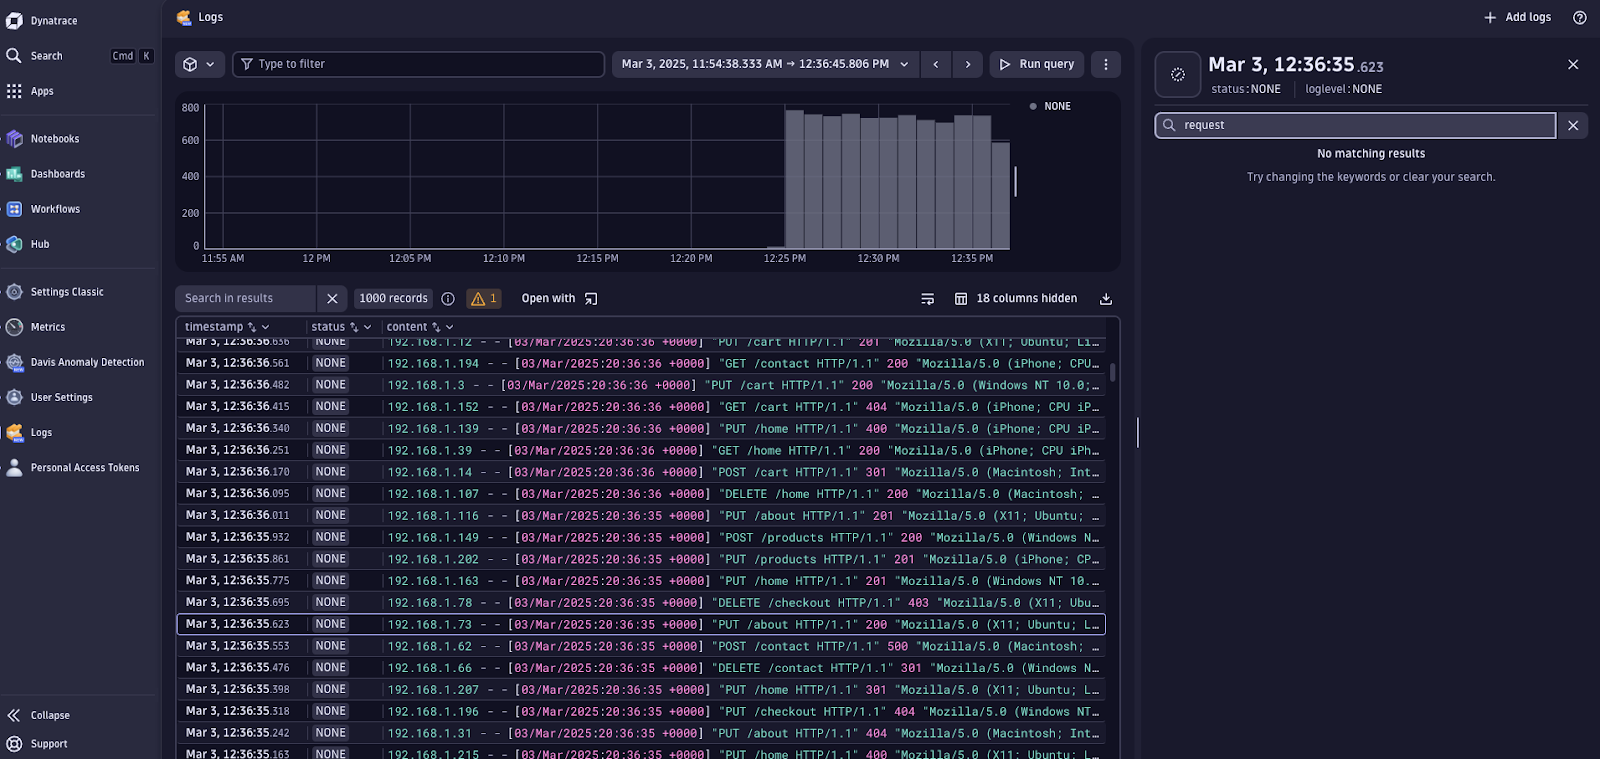
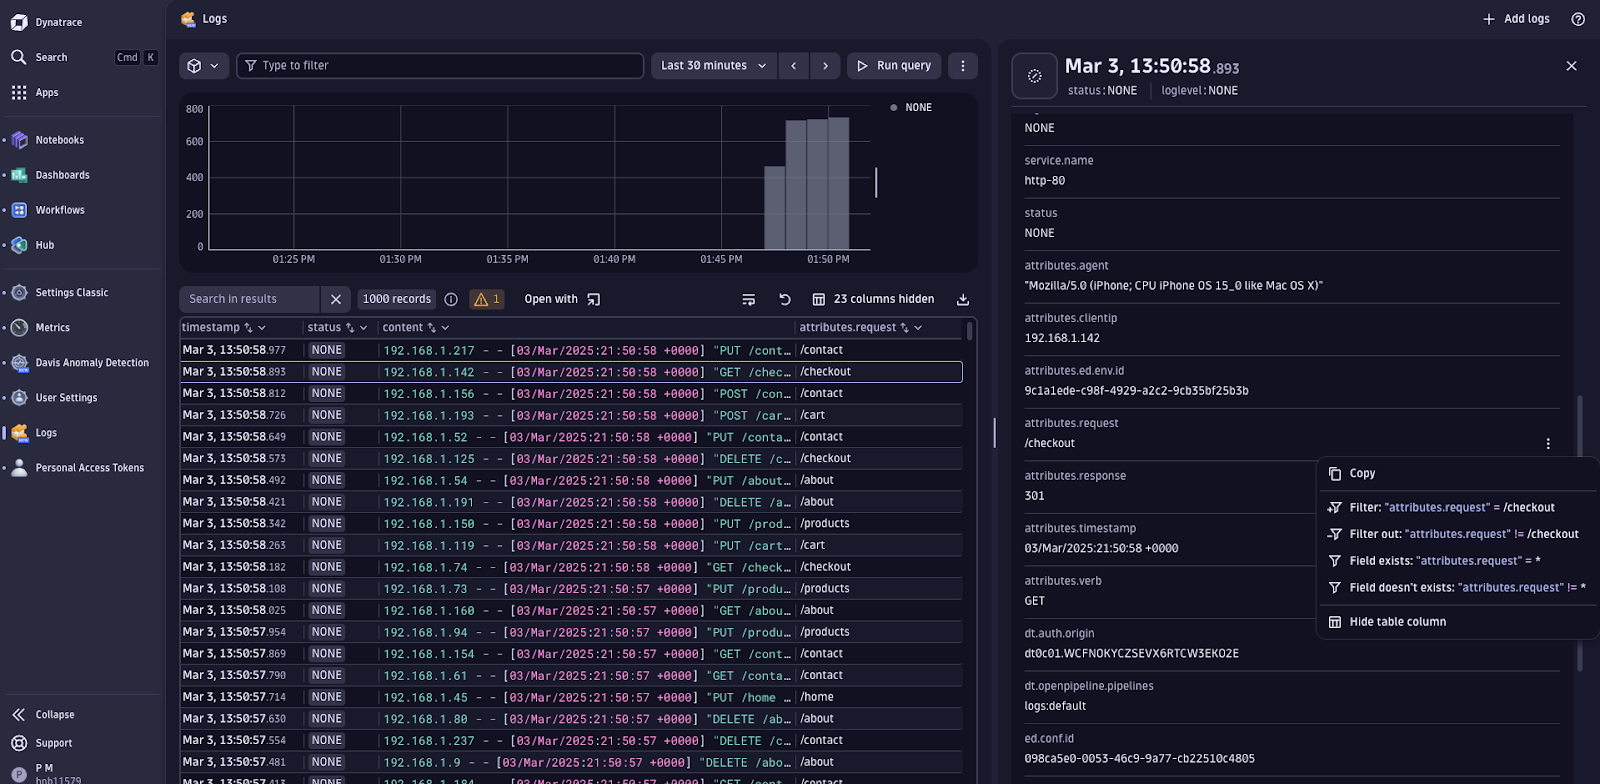
Although data is flowing, the log items within Dynatrace are unstructured, making analysis and visualization difficult. For instance, the request field, which contains the url link associated with the log, is buried within the content portion of the log item, preventing us from filtering or analyzing on that attribute:
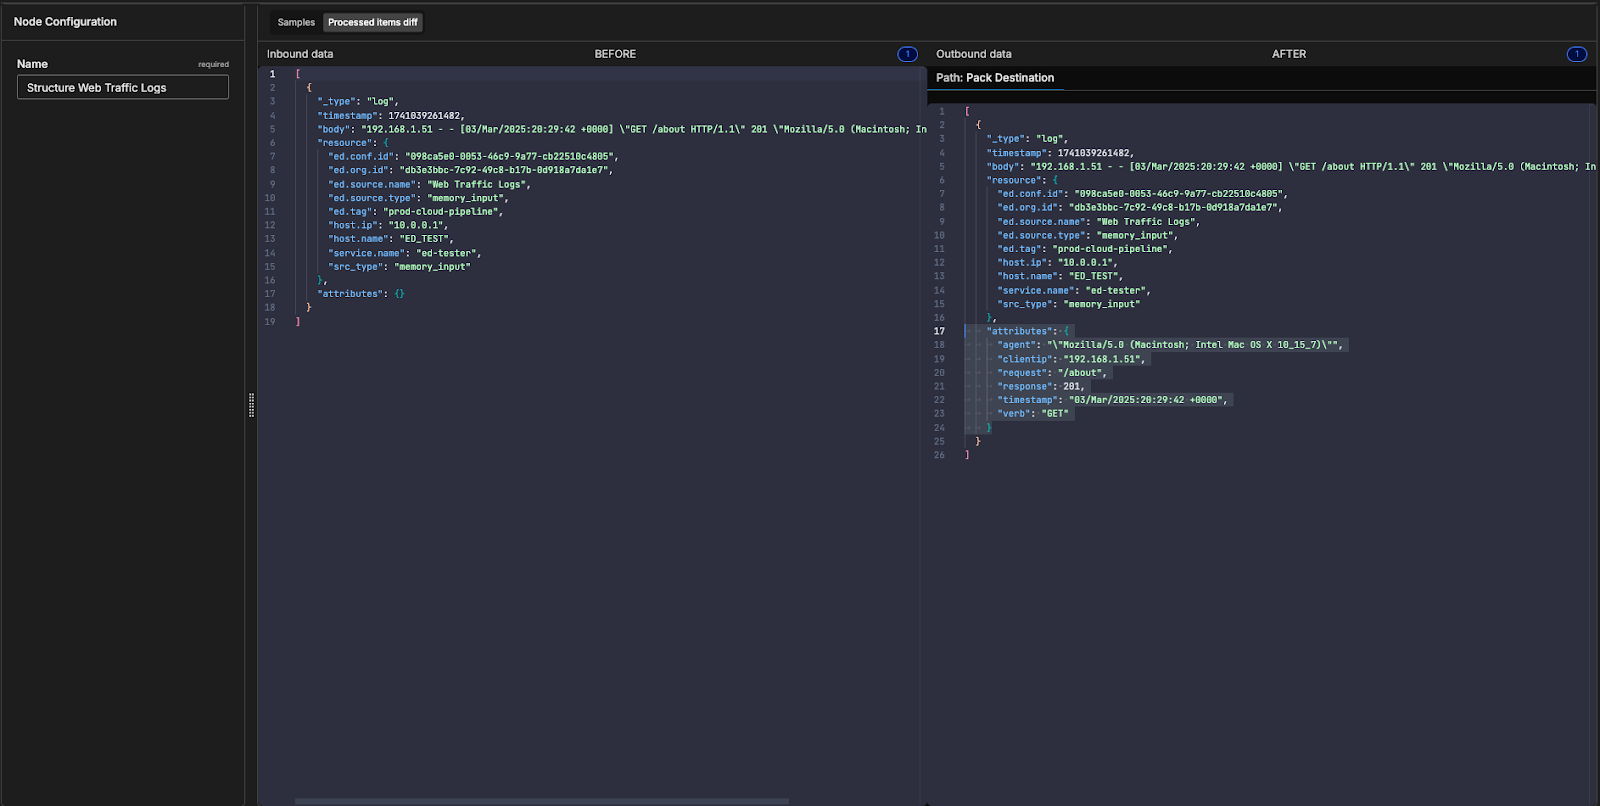
Let’s add some light pre-processing to structure the log data before it reaches Dynatrace. We can use a grok pattern to extract the information from the log body and structure it into the attributes portion of the log item and trim unnecessary fields out of the logs:
Here’s what that transformation looks like on a given log item:
Now that the request field is stored in a structured format, we can interact with it far easier in Dynatrace. Say, for instance, we want to hone in on logs generated by events taken on the “/checkout” page. By structuring the log data beforehand, we can easily add the request field as a column in our queries:
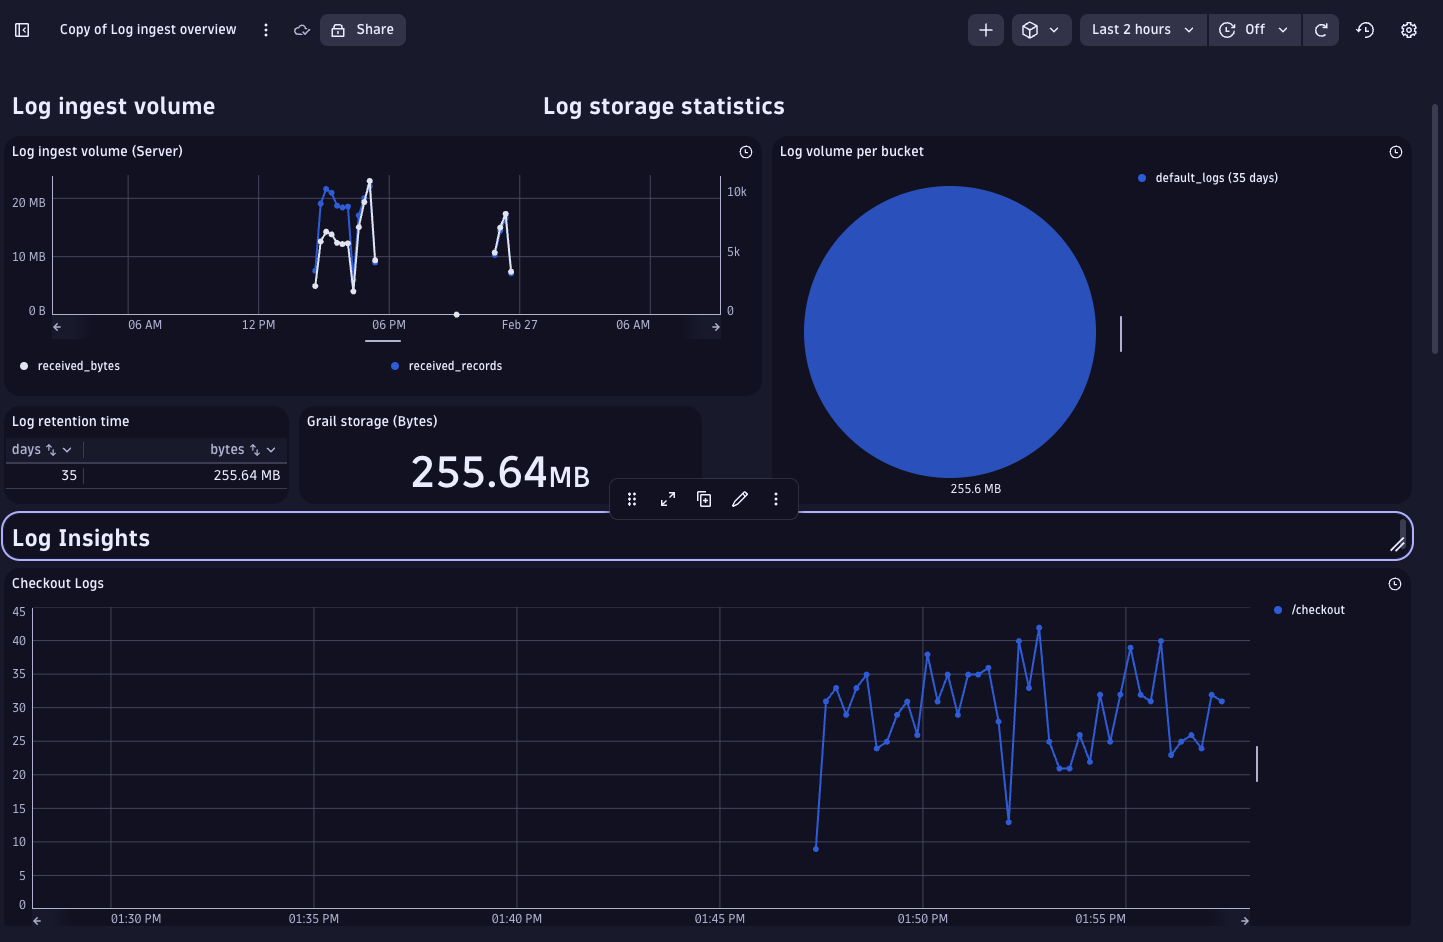
And can visualize “/checkout” url counts as a time series metric in a dashboard:
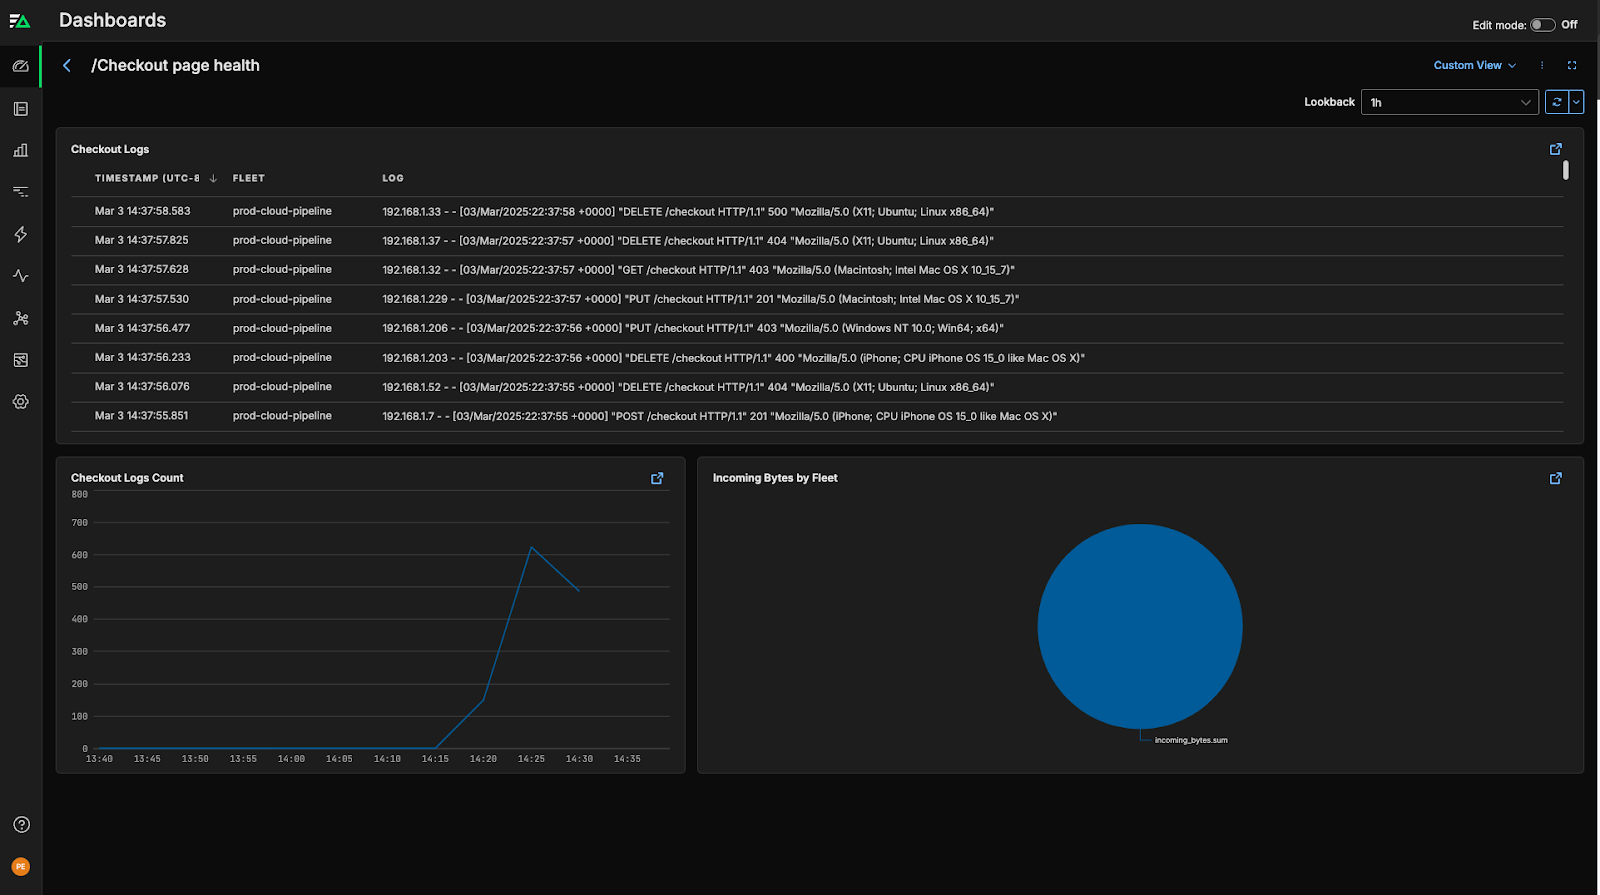
Alternatively, we can run this analysis in Edge Delta’s backend. By adding a log to metric node into our pipeline, we can extract the metric count of “/checkout” logs at the agent level, before shipping it into Edge Delta.
Once there, we can create custom dashboards to monitor the “/checkout” logs:
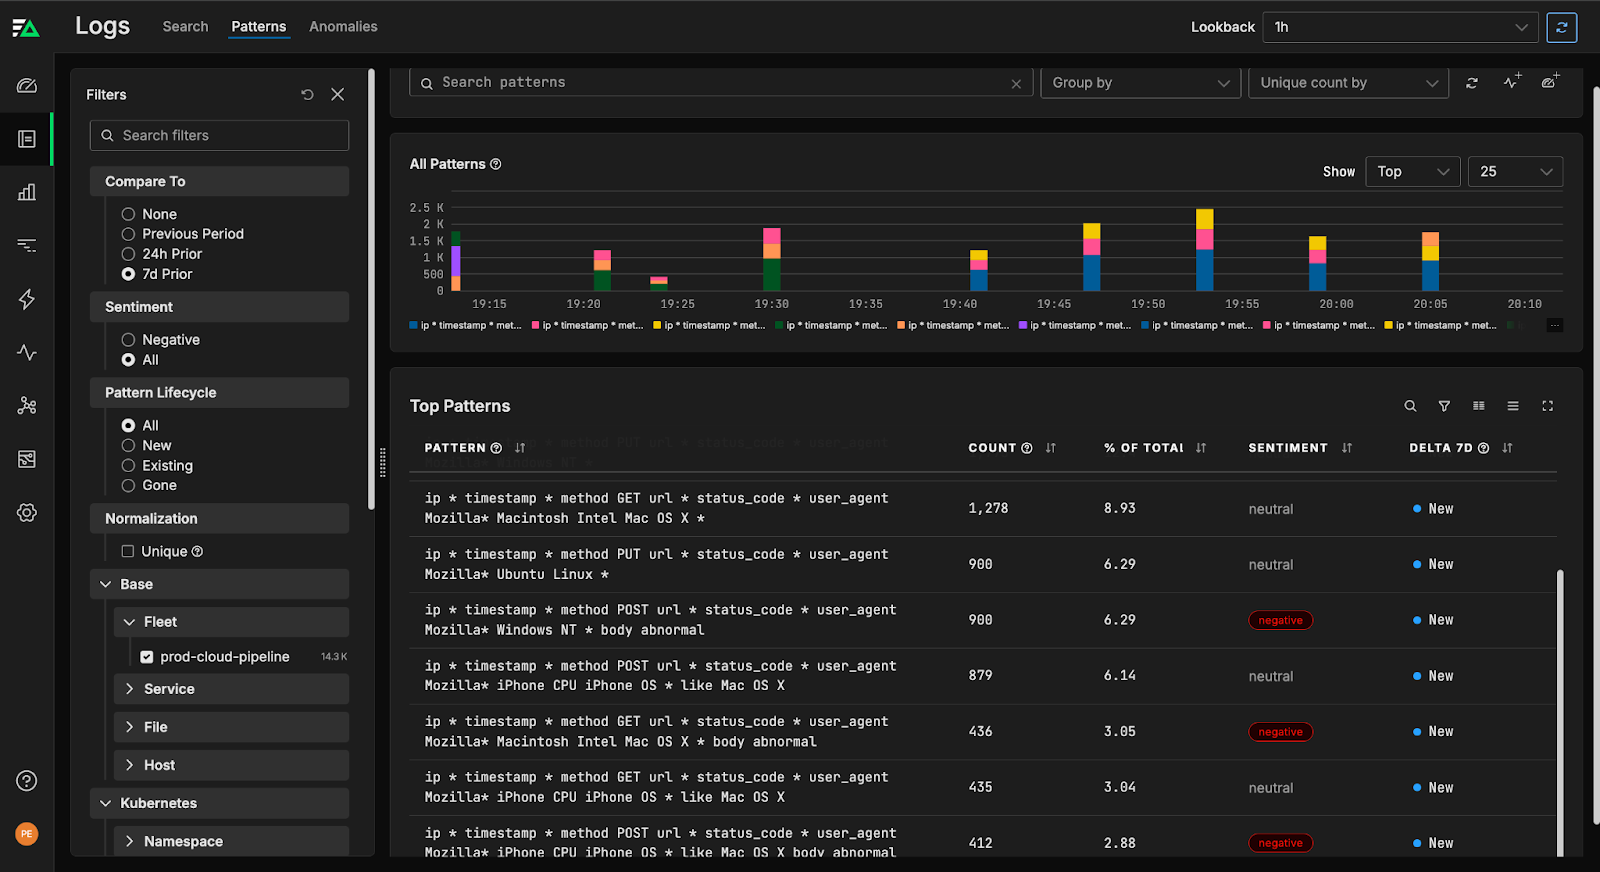
Edge Delta also automatically lets you visualize groupings of similar logs together as real-time patterns for clarity across your environment. The result gives you a high-level overview of your log behavior, which you can drill down into for deeper insights.
Whether with Edge Delta or Dynatrace’s backend, Edge Delta’s Telemetry Pipelines are the solution best suited for collecting, processing, and routing data volumes efficiently at enterprise scale.
Conclusion
Dynatrace Grail is setting a new standard for log analytics, but data volume remains a challenge. With Edge Delta, teams can harness Grail’s capabilities more efficiently — retaining full visibility while keeping storage and processing costs in check.
Ready to get started? Start a free trial, or dive into our playground to check out our pipelines for free.


