Information technology has evolved significantly to meet the demands of modern businesses. Today’s cloud-based networks and remote data handling offer enhanced power but also carry increased risks.
Distributed tracing offers a solution for managing large volumes of data efficiently. It enables programmers to visually track request paths across multiple microservices, facilitating error diagnosis and performance optimization.
Automate workflows across SRE, DevOps, and Security
Edge Delta's AI Teammates is the only platform where telemetry data, observability, and AI form a self-improving iterative loop. It only takes a few minutes to get started.
Learn MoreThis article covers the basics of distributed tracing, including its functionality, key components, and practical implementation strategies.
Key Takeaways:
Distributed tracing assigns unique identifiers to requests, which enables real-time visibility across microservices and facilitates error diagnosis and performance optimization.
Traces, spans, context propagation, and specialized data collection and visualization tools are essential components of distributed tracing.
Code, end-to-end, data, and program tracing offer comprehensive insights into software operations to help enhance debugging and optimization efforts.
Tools like SigNoz, Grafana Tempo, and Dynatrace offer diverse capabilities for implementing distributed tracing.
Distributed Tracing: History and Definition
In the past, businesses used simple programs, but with newer architectures, it became harder to track how transactions moved between different parts of applications. This made it challenging for teams to work together and discover why things were slow.
Companies needed better ways to see what was happening in their applications. However, it was hard to make something good using just their resources. That’s where distributed tracing comes in.
Distributed tracing keeps track of requests moving through different parts of a cloud system. It gives each request a unique tag so you can follow it easily. This helps businesses see what’s happening in real time and find problems with how fast their parts work together.
What is a Trace?
A trace is one of the three pillars of observability that helps teams better understand their data infrastructure. With traces, we can see in a bigger picture what happens when we ask a program to do something. Whether your app is a single-piece block with a single database or a complex web of services, traces are necessary to see the whole “path” a request takes.
An In-Depth Look into How Distributed Tracing Works
Unlike monolithic applications, microservices-based applications have interoperable parts, making it hard to track the user’s flow across each service. Fortunately, distributed tracing can help track a user’s actions from front to back and assess their impact on an application.
Before discussing the steps for distributed tracing, here are its typical components:
| Component | Description |
|---|---|
| Trace | A request or transaction takes the whole route through a distributed system from beginning to end. |
| Span | A single operation or unit of work within a distributed system. |
| Context Propagation | Refers to the passing of contextual information between components or services within a distributed system. |
| Instrumentation Libraries | Developers integrate these software components into their applications to collect tracing data. |
| Tracing Data Collectors | These components receive and store trace data, usually in a distributed data store like Elasticsearch or Cassandra. |
| Visualization and Analysis Tools | These tools turn trace data into a graph, which helps coders see how requests move through the system and find problems with speed. |
| Trace Analysis Tools | These tools let developers look at trace data in great depth, which helps them find slow spots and improve system speed. |
It’s important to remember that these components may vary depending on the implementation. Understanding which component you need for your system is crucial in maximizing their benefits.
Once the components are sorted out, users can implement the following steps for distributed tracing:
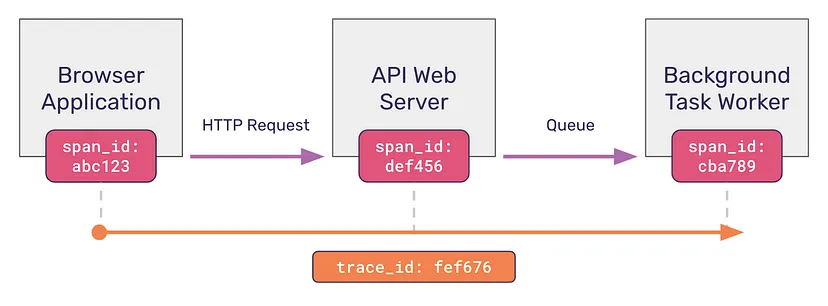
Step 1. Assigning a unique identifier to requests.
The system assigns a unique identification to each request. This identification follows the request through the system. These are “Trace IDs”. A request is allocated a trace ID as it goes down the downstream components.
Step 2. Instrumentation libraries capture Trace Data
Many components and services contribute trace data to the request’s trace context as it passes through the system. Timestamps, service and endpoint names, and information are included.
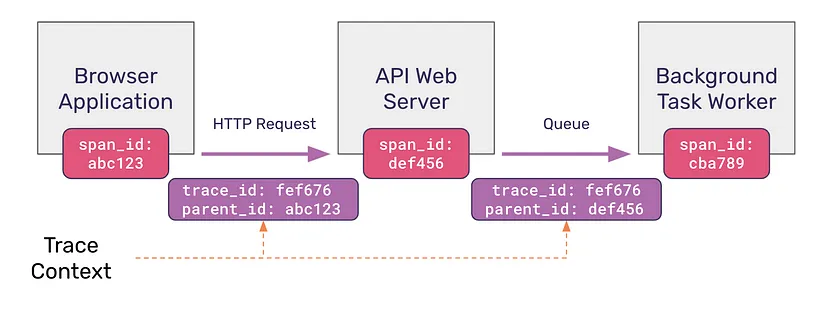
Step 3. Propagating the Trace Data
Trace context is transmitted when the request passes between components. This transfer lets all request components add trace data to the trace context.
Step 4. Saving the Trace Data
Trace data from each request component and service is collected by a tracing data collector and stored in Elasticsearch or Cassandra.
Step 5. Visualizing and analyzing trace data
Trace visualizers and analysis tools help developers find system performance problems and bottlenecks.
Developers can significantly enhance application reliability and efficiency by understanding and implementing the aforementioned key components and steps.
Remember!
When implementing distributed tracing, it’s crucial to ensure consistent trace and span IDs across all services to maintain the trace’s continuity. Additionally, pay attention to the overhead introduced by tracing, especially in high-throughput environments, to avoid negatively impacting system performance.
Types of Distributed Tracing
Distributed tracing allows users to view complex interactions in modern software so that many intricate processes are analyzed and optimized. Teams use various types of distributed tracing. Here are some of them:
Code Tracing
Code tracing is a method used by programmers to track how source code progresses through a program during a specific task. It aids in understanding the logic of the code and identifying previously unnoticed issues.
Programmers utilize code tracing to verify that service requests have initiated the necessary steps to query a database. If certain software features fail to respond, the tracing system logs the error and highlights the response time, drawing attention to potential issues.
End-to-end Tracing
End-to-end tracking enables development teams to observe how data evolves as it travels along the path of a service request. When a program initiates a request, it transmits information to other software components for further processing.
Using tracing tools, developers monitor and document all modifications to critical data from start to finish. This perspective provides insights into how requests progress through the application, offering a comprehensive view from the application’s standpoint.
Data Tracing
Data tracing is a way for developers to ensure that critical data elements (CDEs) are correct and of good quality. They also track those selected CDEs back to their source systems so they can be watched more closely.
Program Tracing
Program tracing lets programmers look at the names of variables and instructions being called by a live program. A computer program reads and handles every line of code in a specific memory area when it starts.
The program also uses variables in the machine’s memory. An automatic tool makes checking for changes in program and data files easier. Software teams can find the root causes of speed problems like memory overflow, using too many resources, and logic processes that get stuck with program tracing.
Collectively, these tracing types provide a comprehensive toolkit for navigating modern software development.
Good to Know!
Code tracing involves methodically following a program’s execution flow to understand how its variables and control structures interact over time, enhancing debugging skills and deepening comprehension of complex code behaviors. It’s a practice that requires patience and attention to detail, improving with regular application and experience.
Benefits and Challenges in Distributed Tracing
Monolithic legacy apps need help to service their host tools due to the complexity of contemporary architecture. Distributed tracing is necessary for cloud-native observability due to this difficulty.
Here are some key distributed tracing benefits:
- Debugging – Distributed tracing helps pinpoint distributed system problems and performance difficulties by following a request through the system.
- Optimizing Performance – Distributed tracing helps find system bottlenecks and performance issues. Finding these issues can help developers enhance service and system performance by allowing trace data.
- Monitoring – Distributed tracing shows distributed system activity in real time. This monitors system health, detects abnormalities, and alarms when problems develop.
- Reduce MTTD/MTTR – The support team can check distributed traces for backend issues if someone reports a malfunctioning application. To swiftly fix the problem, engineers can evaluate the impacted service’s traces. An end-to-end distributed tracing tool may also explore frontend performance issues from the same platform.
- Maintain SLAs – Most companies establish SLAs with customers or internal teams to satisfy performance targets. Distributed tracing technologies collect service performance data to help teams assess SLA compliance.
While distributed tracing has numerous benefits, it also has drawbacks. Some challenges in distributed tracing include:
- Arbitrary Sampling – Some distributed tracing programs randomly sample and examine traces. Teams might overlook severe problems since traces are randomly selected, and there is no way to predict which would have difficulties.
- Only Backend Coverage – Unless you utilize an end-to-end distributed tracing platform, a request gets a trace ID only when it reaches the first backend service. The front end won’t show the user session. This situation makes it tougher to pinpoint a request’s root cause and whether a frontend or backend team should address it.
- Manual Instrumentation – Distributed tracing systems may need code instrumentation or modification to start tracing requests. Manual instrumentation takes effort and might introduce bugs in the application, but the language or framework you wish to instrument frequently determines whether this is required. Standardizing which code to instrument may also cause missing traces.
Distribution systems have pros and downsides, but the pros usually exceed the cons.
Final Thoughts
Distributed tracing comes as a critical tool in modern software development. It provides a way for developers to find their way through the details of microservices. Another crucial thing about distributed tracing is that it has an accurate request path map that clearly illustrates the journey transactions take through multiple services.
Distributed tracing is an excellent solution for organizations whose applications run on complex infrastructures and want to stay afloat with robust, high-performing ones.
FAQs About Distributed Tracing
What is the difference between distributed tracing and logging?
Distributed tracing lets you see everything from start to finish, making it perfect for understanding how requests move through complex, distributed systems and improving speed. On the other hand, logging records many events and data helps fix bugs, keep an eye on things, and ensure compliance rules are followed.
What is the primary use case for distributed tracing?
Operations, DevOps, and software workers are the main groups that use distributed tracking. The goal is to get results quickly, focusing on microservices or serverless designs in distributed settings. These designs have a lot of benefits, but they also need help understanding.
What is the key purpose of a distributed system?
Distributed systems allow people to share data and messages, ensuring that multiple resources, like software or hardware parts, work together consistently.

