Fortinet is a cybersecurity platform that provides an expansive range of solutions for Secure Networking, Unified SASE, Security Operations, and more.
When it comes to network security, firewalls are one of the most common forms of protection to prevent cyberattacks and mitigate security risks. And Fortinet’s FortiGate firewall product is among the most deployed in the world.
FortiGate firewalls produce different types of detailed logs — which can later be shipped out to various SIEM or storage destinations. For security teams relying on FortiGate for network security, Edge Delta offers a simple way to get more value from your logs.
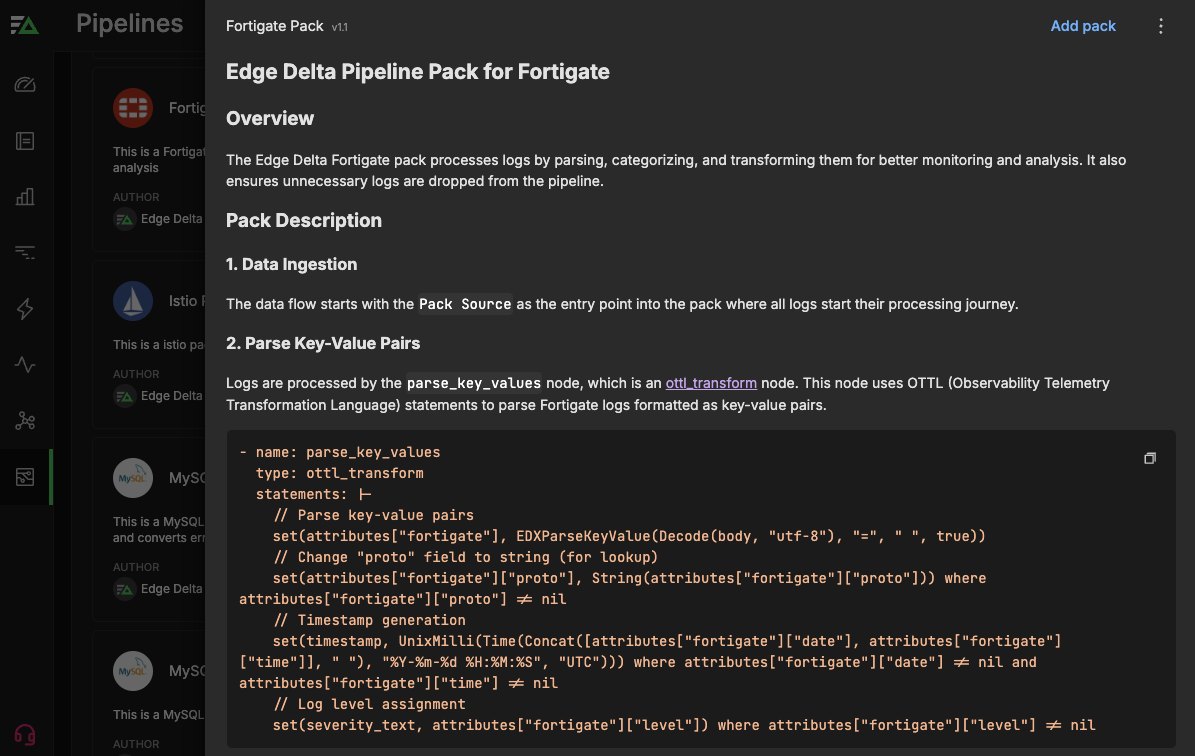
The Edge Delta FortiGate Pack is a pre-built set of processing steps specifically designed for FortiGate firewall logs. The pack automatically processes firewall logs by parsing, categorizing, and transforming them, while dropping any no-value or low-value ones. After processing, the enriched logs can then be routed to any destination via Edge Delta’s Telemetry Pipelines for further investigation or simple storage. The result is stronger monitoring, deeper analysis, and increased efficiency.
Edge Delta Telemetry Pipelines offer support for logs, metrics, traces, and events. Our efficient architecture enables end-to-end monitoring and control over security and observability data, and allows teams to rein in costs without compromising visibility.
In this post, we’ll talk about how the FortiGate Pack functions, and the benefits you’ll get once it’s up and running.
How Does the FortiGate Pack Work?
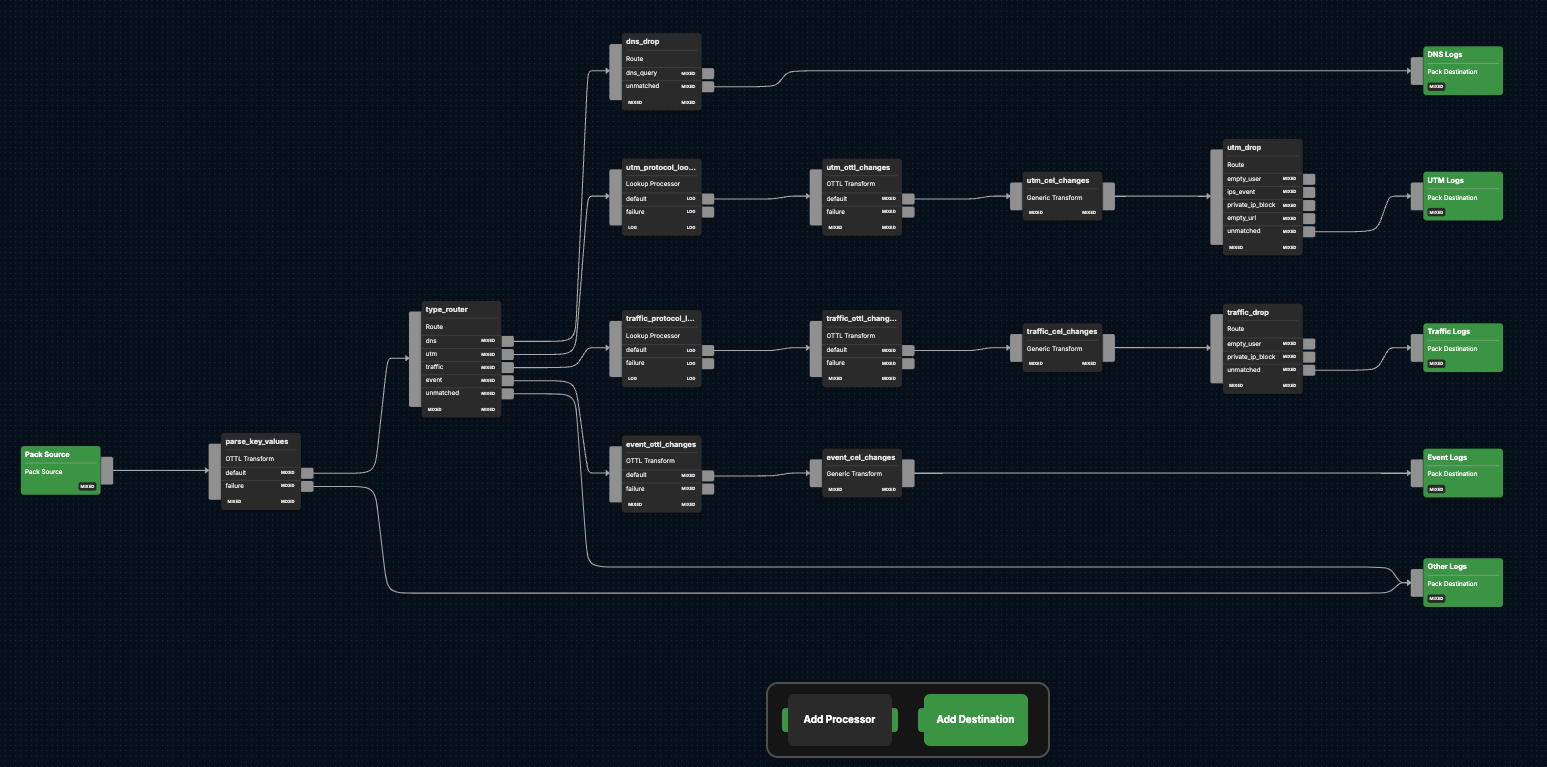
The FortiGate Pack incorporates various processors designed to enhance the usability of log data generated by FortiGate firewalls. This process includes consolidating log data to retain only the most critical elements, ensuring the extraction of valuable insights for more efficient analysis.
Each FortiGate log entry contains a subtype field within a log type, based on the feature associated with the cause of the log entry. For example, with event logs, some of the subtypes are compliance check, system, and user.
The Edge Delta FortiGate Pack specifically focuses on the following log types:
Traffic: Details traffic flow, including HTTP/HTTPS requests and their corresponding responses, if applicable
Events: Logs system and administrative events, such as downloading configuration backups or tracking daemon activities
UTM: Records unified threat management events, and their various subtypes
DNS: Records domain name server events on managed devices
All other logs are parsed, as described below, before being sent to a destination node for final routing.
To get started, unless you already have an existing pipeline within Edge Delta you’d like to use, you’ll need to create one before you can enable the FortiGate Pack.
Once you have a pipeline up and running, you can find the FortiGate Pack by navigating to the Pipelines section within Edge Delta, and then clicking on “Knowledge,” and then “Packs.” Then, scroll through our list of packs — which are organized alphabetically — until you find the FortiGate Pack. Once you do, click “Add to pipeline” and select the pipeline you’d like to install the pack on.
Processing Pathway: All FortiGate Logs
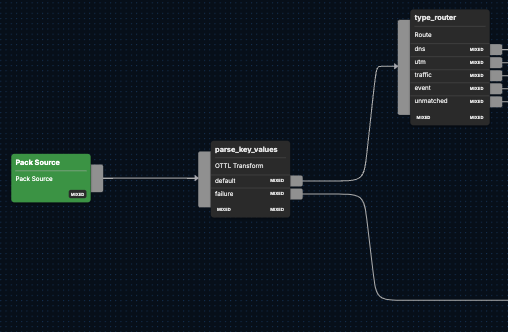
Below, we will explore the first two sequential processing steps raw FortiGate logs undergo in the pack and what to anticipate from each.
Data Parsing
Once FortiGate firewall log data begins flowing into the pack via the {Pack Source}, it will run the raw logs through a parsing node, parse_key_values. This node uses OpenTelemetry Transformation Language (OTTL) statements to parse FortiGate logs formatted as key-value pairs. The node then converts proto and timestamp fields for faster search, and assigns log levels, depending on the severity of the data. Logs that cannot be parsed are then sent to the Other Logs pack destination.
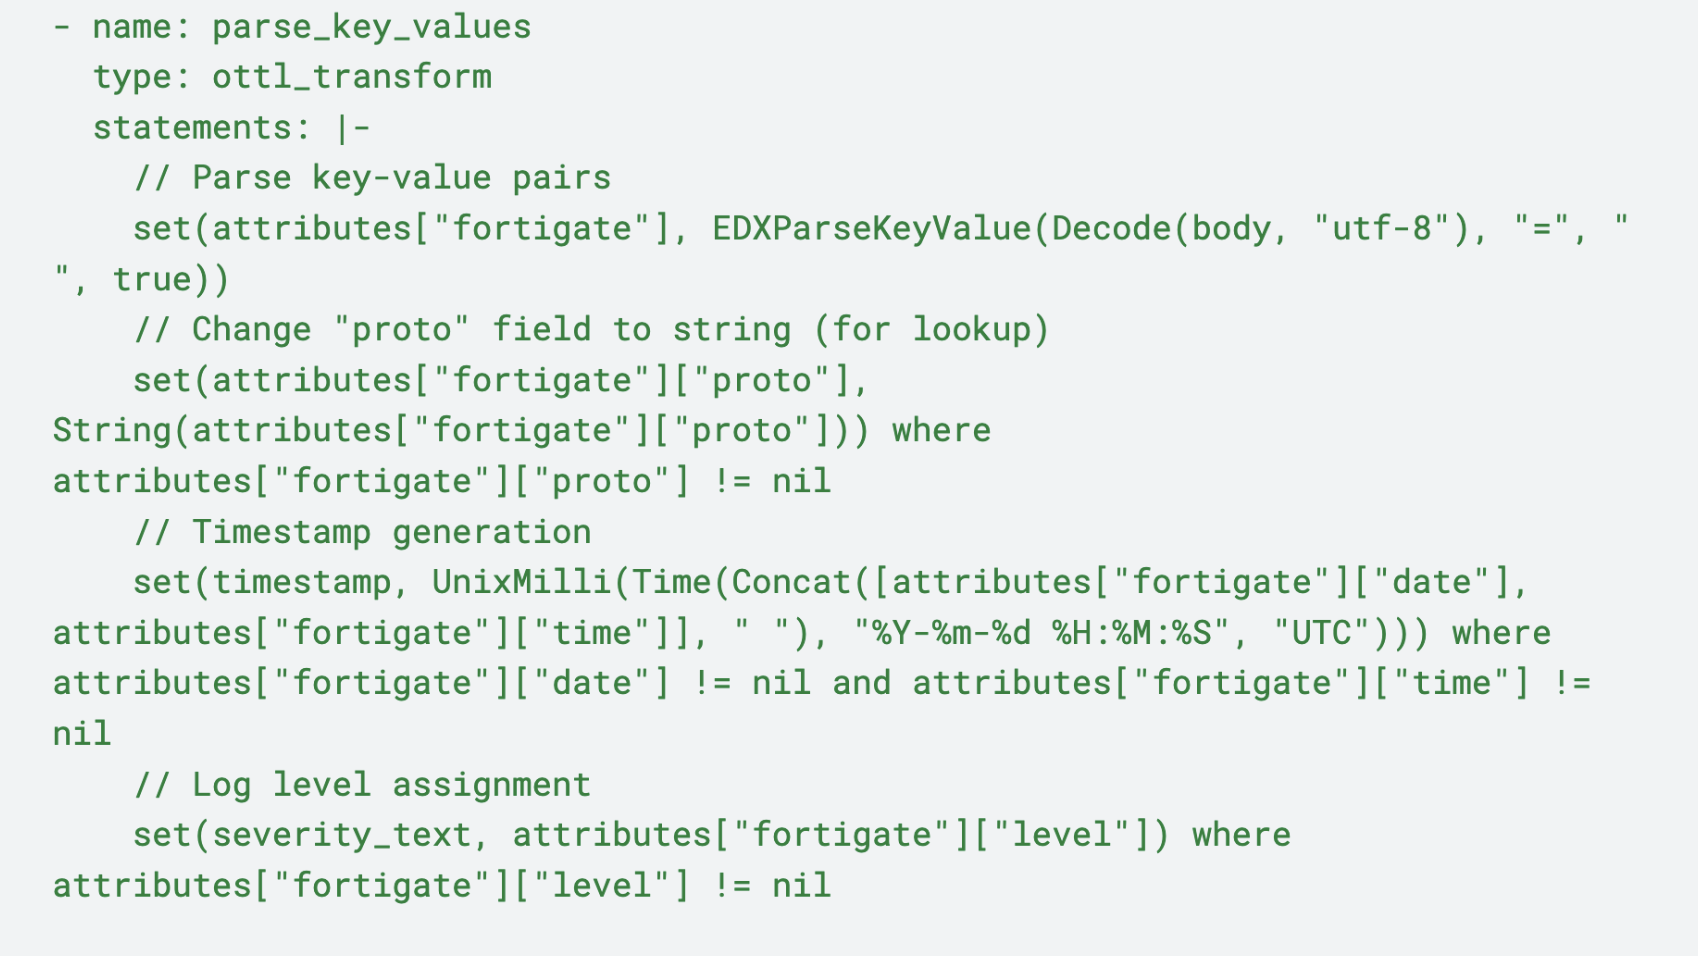
Type Routing
All remaining logs that haven’t been shuttled to the Other Logs pack destination are then sent through the {type_router} node, which evaluates them using the Common Expression Language (CEL). The log entries are then filtered by their type attribute — DNS, UTM,traffic, and event — and directed to their corresponding type pathway for sequential processing.
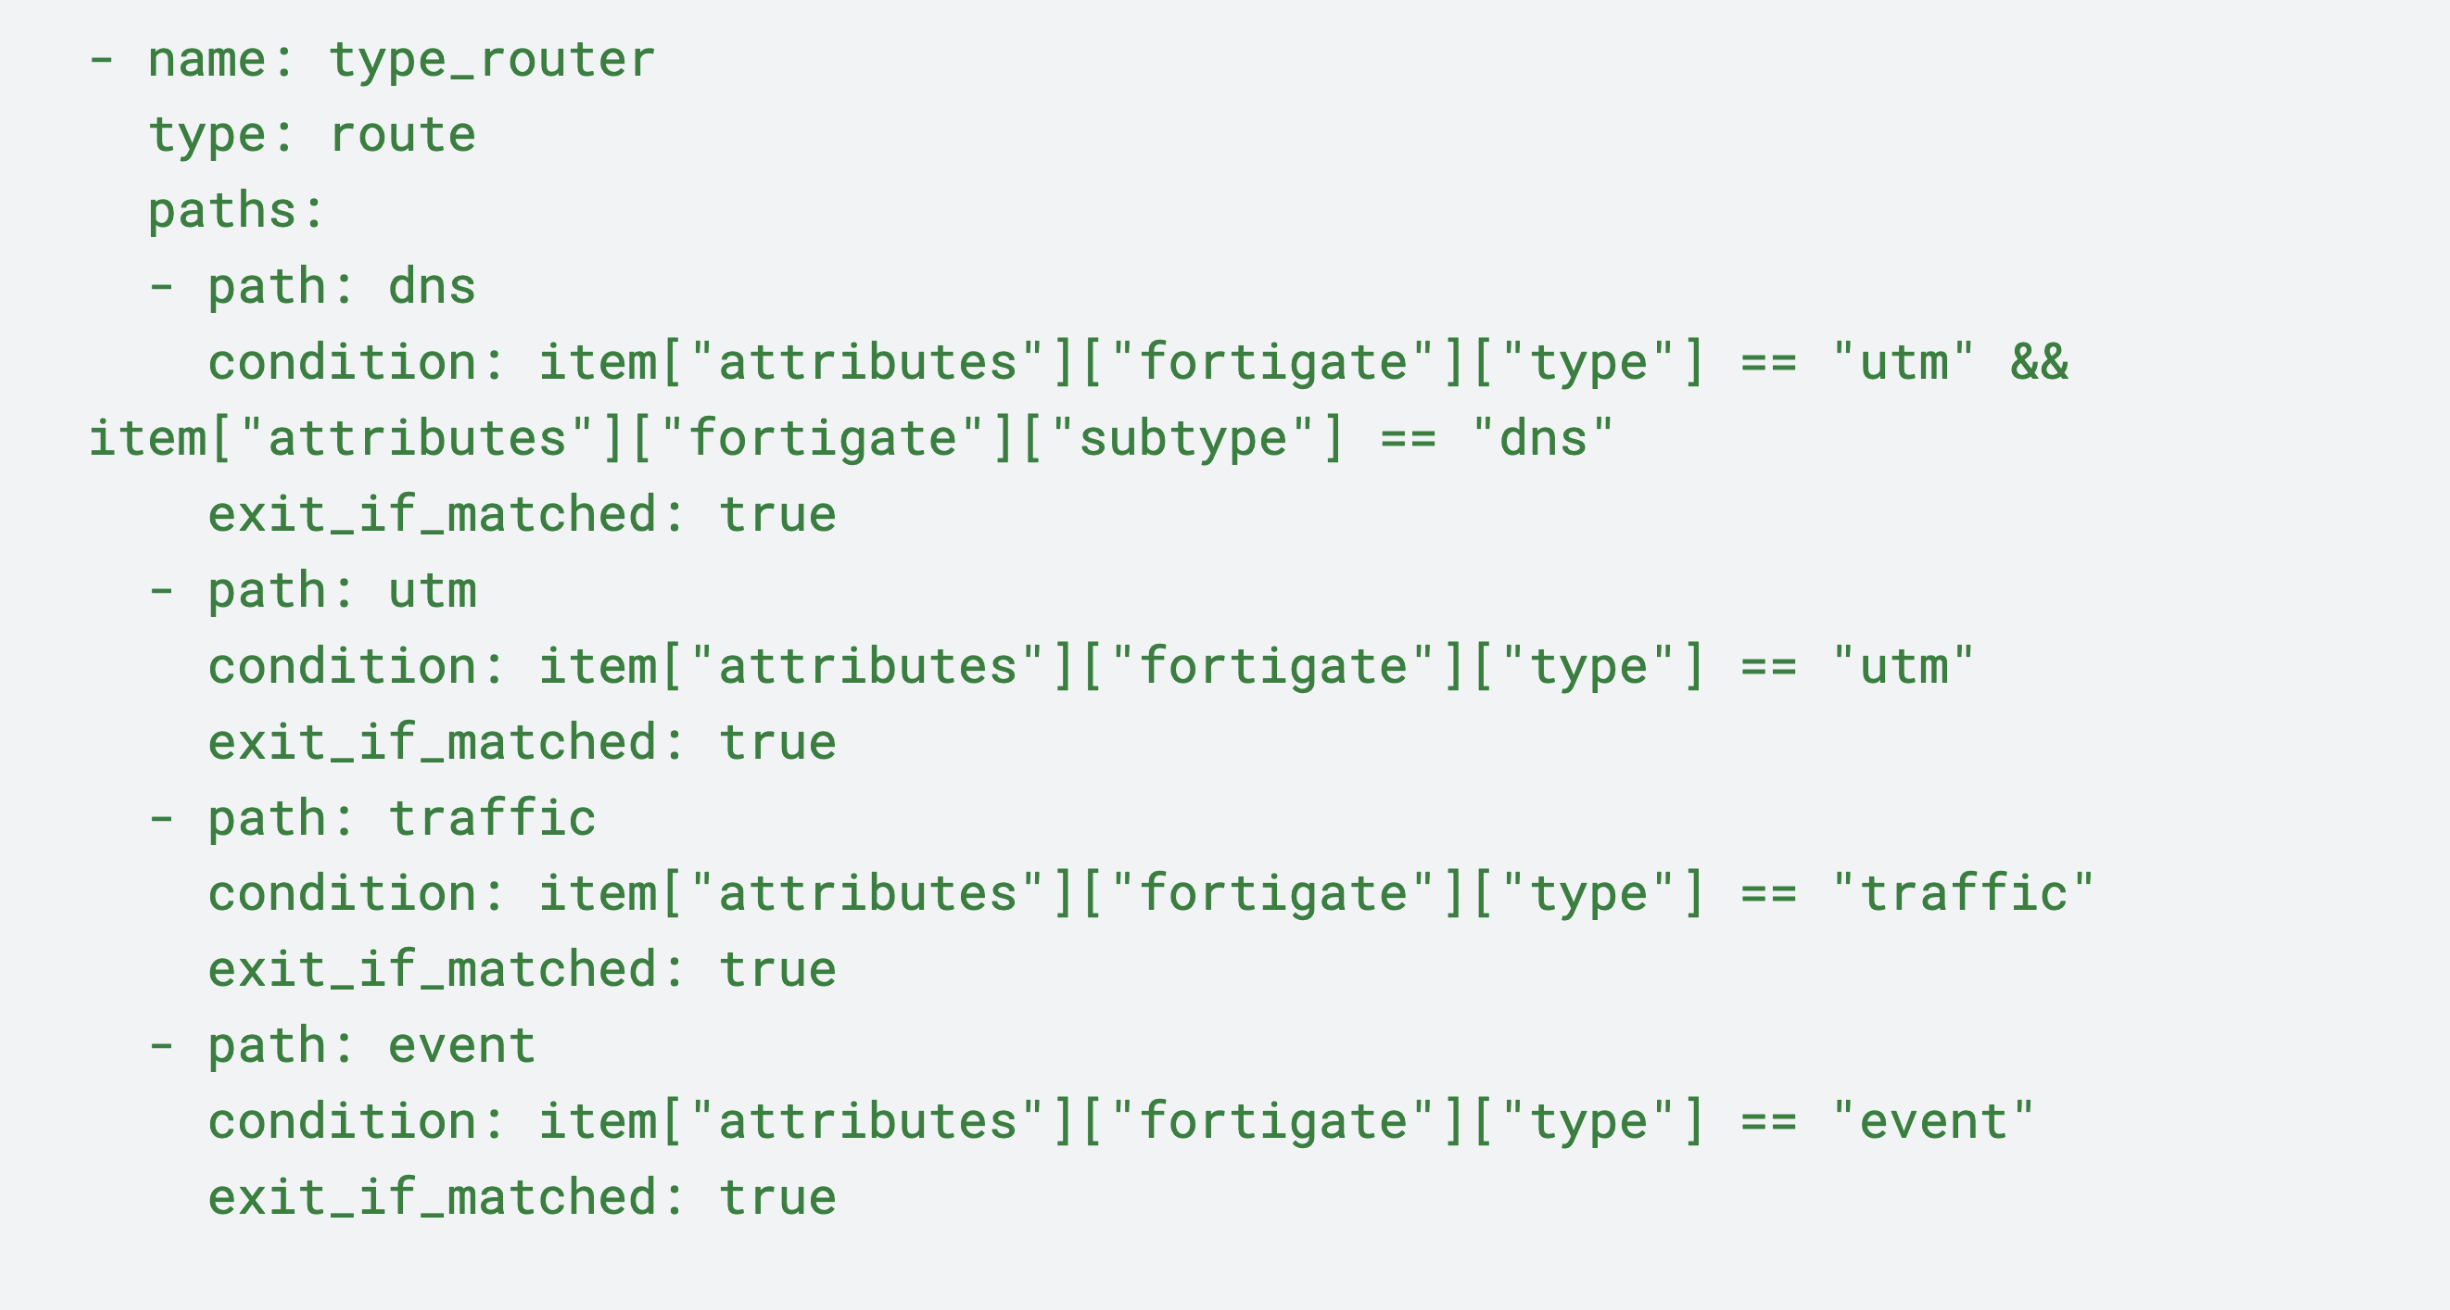
Next, we’ll examine how each log type gets processed on their selected pathways by their corresponding nodes, and why.
Processing Pathway: DNS Logs

We’ll start with DNS logs, which follow the DNS path beginning with the dns_drop node. With this node, DNS logs are analyzed with the vendor_event_type attribute to identify a dns_query. If a query is found, the log is sent along the dns_query path and ultimately dropped. If no query is detected, the logs are then routed to the DNS_Logs pack output, where they can be sent to another destination for further analysis.

Processing Pathway: UTM Logs

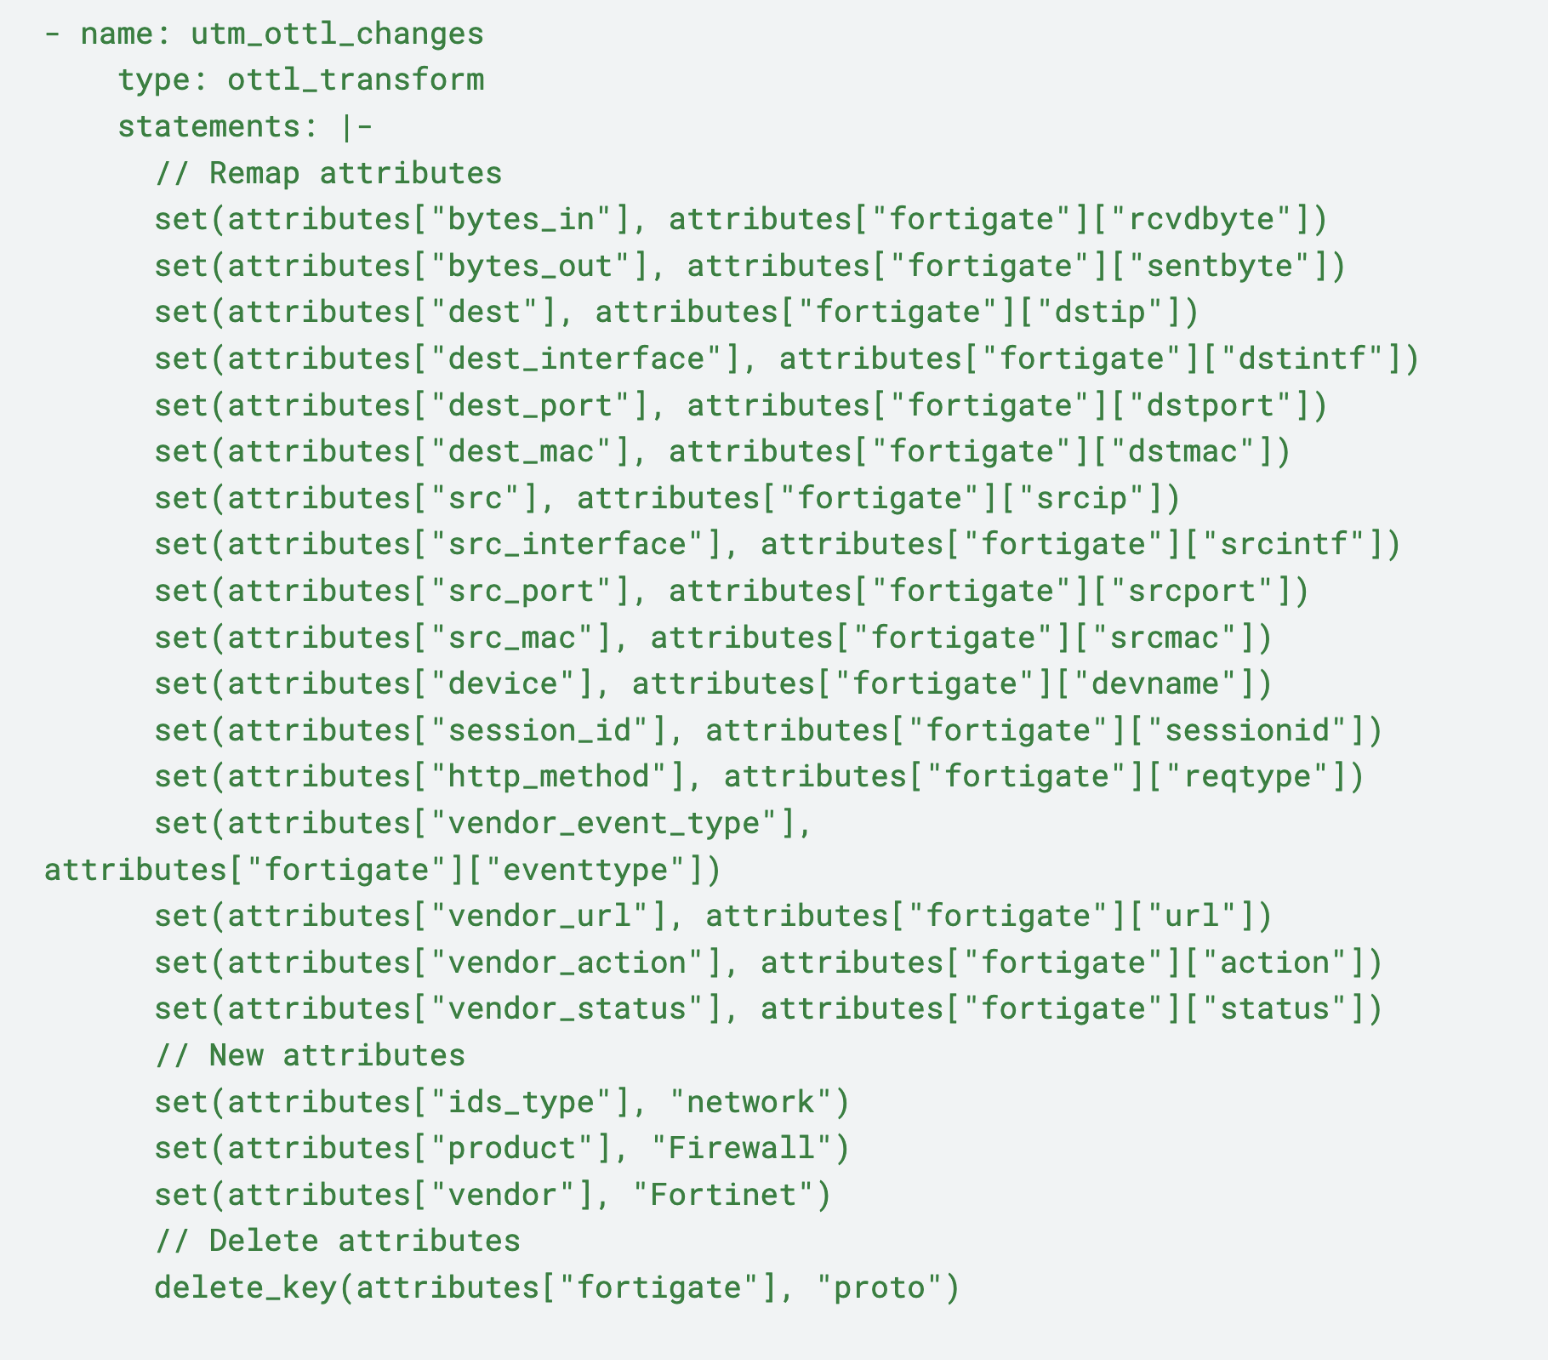
UTM logs are first run through the utm_protocol_lookup node, which uses a lookup table to assign a protocol name (default or failure) as an attribute. From there, the UTM logs are passed through the utm_ottl_changes transformation node, which uses OTTL statements to transform and enrich UTM logs with the following attributes:
Bytes Transfer: Maps incoming and outgoing byte counts to create critical metrics to analyze data flow within UTM processes
Destination and Source Detailing: Converts destination and source fields to standardized attributes, ensuring more accurate tracking of data routes
Device and Session Tracking: Correlates identifiers such as device and session ID with their corresponding source data to enable precision tracking
Action and Status Mapping: Remaps critical event data — such as vendor_event_type and vendor_action — to build a holistic view of FortiGate interactions and event management
Product and Vendor Information: Creates new fields for product and vendor information, indicating Firewall and Fortinet, for security auditing and dashboard displays
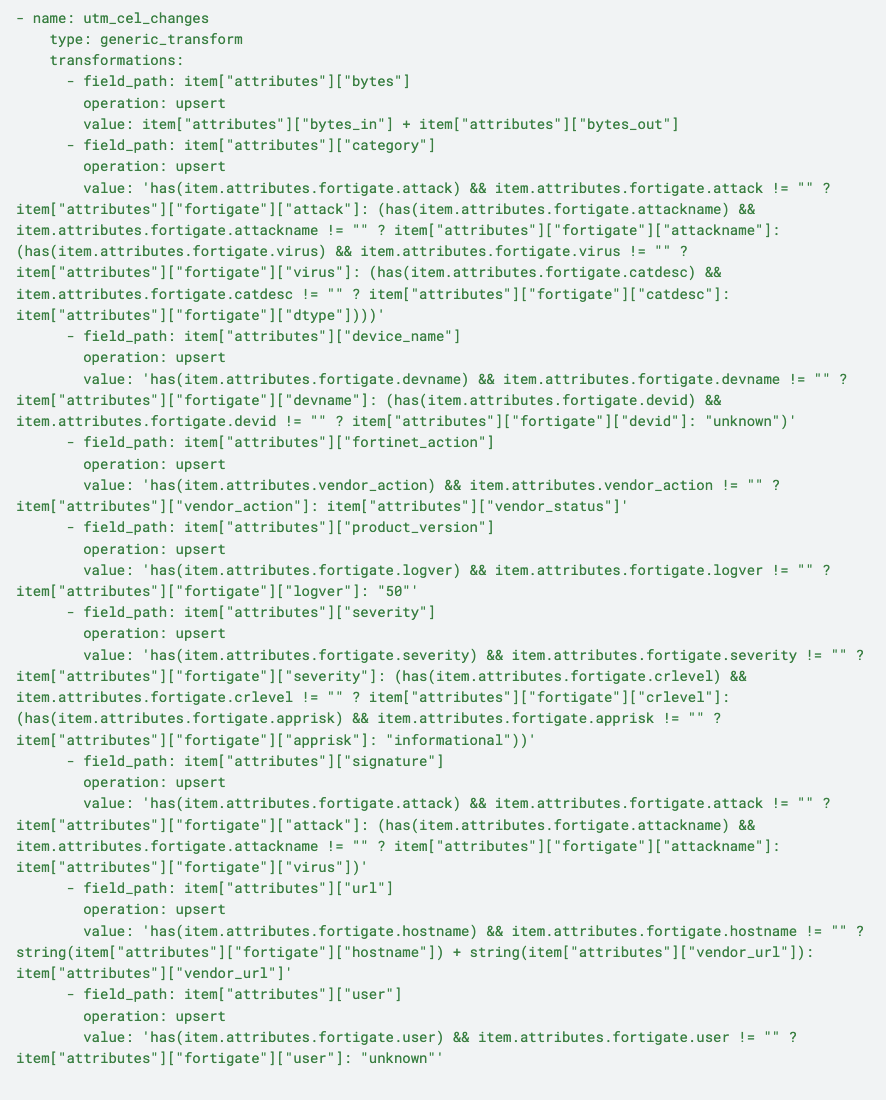
After the UTM logs have made their way through the utm_ottl_changes node, they then pass through the utm_cel_changes transformation node, which makes updates and enhancements on the log data through CEL functions. The result improves the overall log data, providing the ability to extract more meaningful information for use cases such as security monitoring, anomaly detection, and compliance auditing. The changes to the log data can be described as:
Bytes Calculation: Calculates the total bytes by summing bytes_in and bytes_out, providing a clear overview of data transfer captured in the logs
Category Assignment: Uses a cascading has() function to determine the category, prioritizing attributes such as attack, attackname, virus, and others
Device Name Extraction: Employs conditional logic to derive the device_name, defaulting to unknown if neither devname nor devid are available
Action and Status: Assigns fortinet_action by evaluating vendor_action and vendor_status based on priority
Product Version and Severity: Guarantees the inclusion of default product version and severity levels in the logs, ensuring consistent monitoring across all environments
Signature and URL Compilation: Generates validated signature and url values from existing attributes, creating key event identifiers essential for detecting network threats
User Identification: Extracts the user field from available attributes or defaults to unknown, maintaining reliable user tracking critical for audit and compliance purposes
Then, certain UTM logs pass through the utm_drop node, which further sanitizes the log stream by dropping logs that have qualities such as unknown users, irrelevant URL data, private IPs, and empty URLs. Finally, the remaining logs pass through the pack output, UTM Logs.
Processing Pathway: Traffic Logs

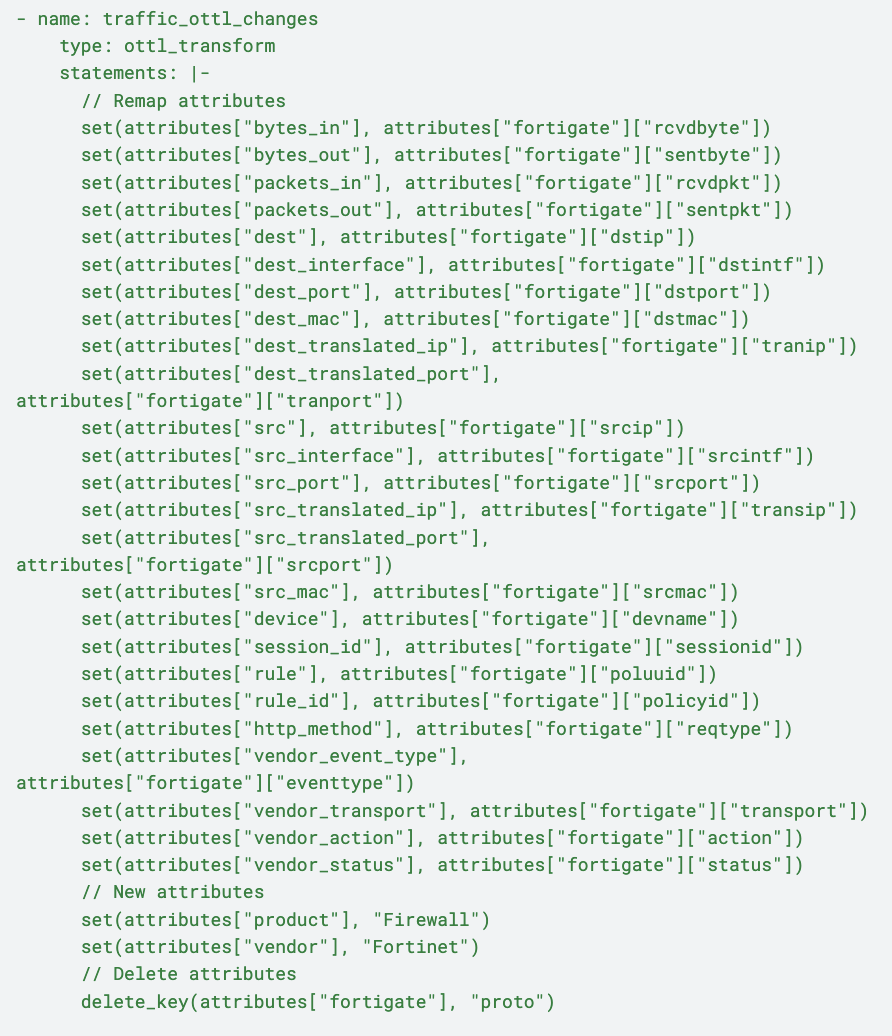
Similar to the pack’s treatment of UTM logs, traffic logs first pass through a traffic_protocol_lookup node to add a protocol name as an attribute. They then pass through an OTTL transform node, which remaps the following attributes:
Bytes and Packets: Captures incoming and outgoing byte and packet counts, essential for analyzing network performance and diagnosing issues
Destination and Source Details: Standardizes fields for destination and source IPs, ports, MAC addresses, and translated IPs, improving clarity and consistency in traffic tracing
Device and Session Information: Retains device and session identifiers, including device name, session_id, rule, and rule_id, enabling precise monitoring of network policies and activities
Event Attributes: Provides event-specific details such as http_method, vendor_event_type, and vendor_transport, offering additional context for thorough network interaction analysis
Vendor and Product Identification: Includes attributes for vendor and product identification, strengthening the log’s connection to FortiGate for enhanced security monitoring and operational analysis
Next, the traffic logs are transformed via the traffic_ottl_changes node, and receive the following enhancements:
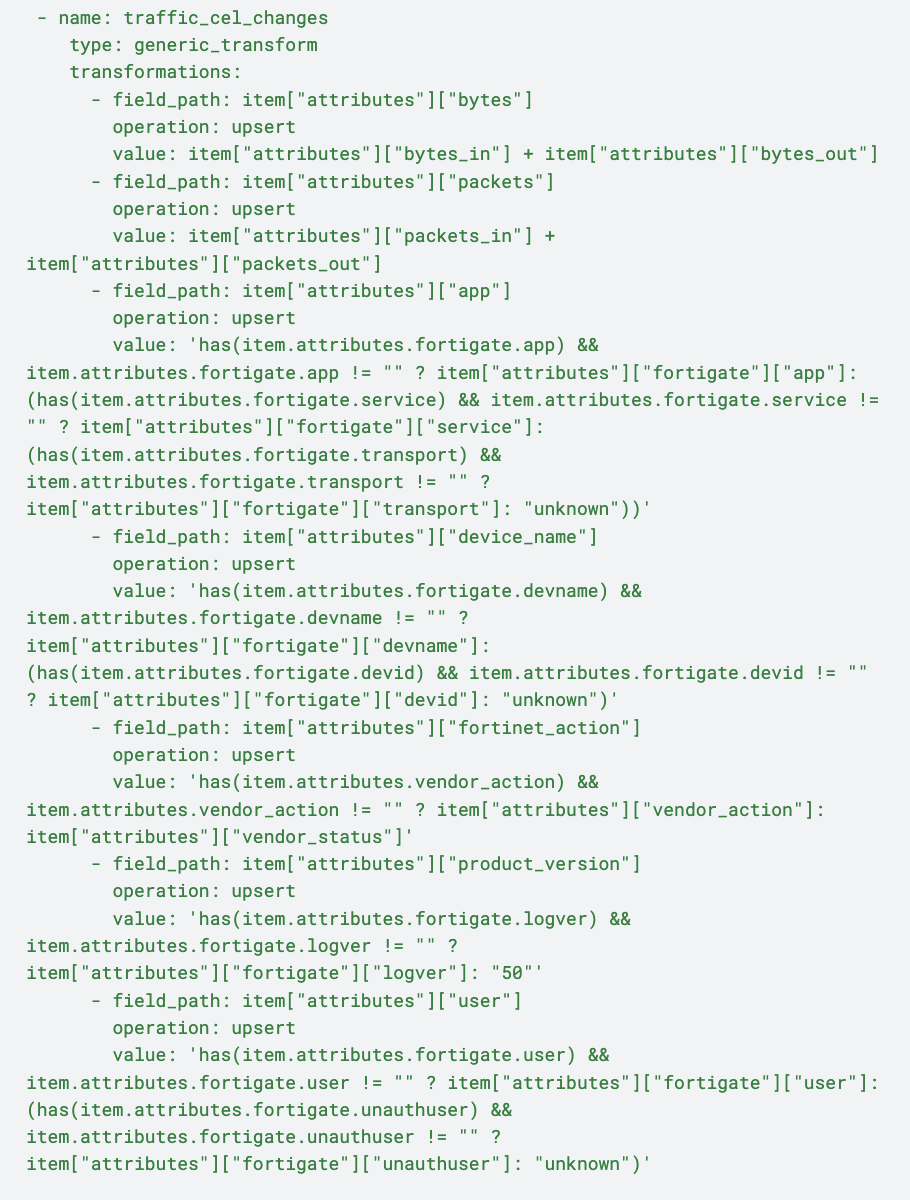
Next, the traffic logs are transformed via the traffic_cel_changes node, and receive the following enhancements:
Bytes and Packets Calculation: Combines bytes_in with bytes_out and packets_in with packets_out to provide a complete view of network throughput captured in the logs
Application Identification: Utilizes cascading has() logic to select the most relevant application descriptor — app, service, or transport — ensuring precise application tracking
Device Name Assignment: Applies conditional logic to determine device_name, defaulting to “unknown” if neither devname nor devid is available, maintaining consistent device tracking
Action Extraction: Derives fortinet_action by analyzing both vendor_action and vendor_status, recording key operational actions relevant to network activities
Product Version Assurance: Logs product_version with defaults when necessary, supporting compatibility checks and detailed record-keeping
User Resolution: Identifies user details from available attributes or defaults to “unknown” for unauthenticated events, ensuring reliable tracking for audit and authentication purposes
Finally, the remaining traffic logs move through the traffic_drop, dropping non-essential logs with empty users and private IPs to reduce noise. Logs that do not meet any conditions are directed to the default unmatched path and sent to the output pack labeled “Traffic Logs.”
Processing Pathway: Event Logs

Event logs are first routed through an event_ottl_changes node to receive the following treatments:
Source Identification: Maps attributes for the source user, interface, and MAC address, enabling detailed tracking of user actions and device interactions within event logs
Device and Application Details: Captures device and application attributes to provide context about the system environment, enhancing log comprehensiveness
Command and Object Information: Standardizes fields for executed commands and affected objects, ensuring accurate records for change audits and activity monitoring
Network Attributes: Adds Wi-Fi band details and CPU load percentage to logs, offering valuable performance insights for system diagnostics
Action Mapping: Maps attributes to vendor_action and vendor_event_type, ensuring clarity on event specifics and enabling more detailed analysis
Vendor and Product Information: Includes attributes for vendor and product identification, establishing the FortiGate Firewall as the log source for consistent security tracking and auditing
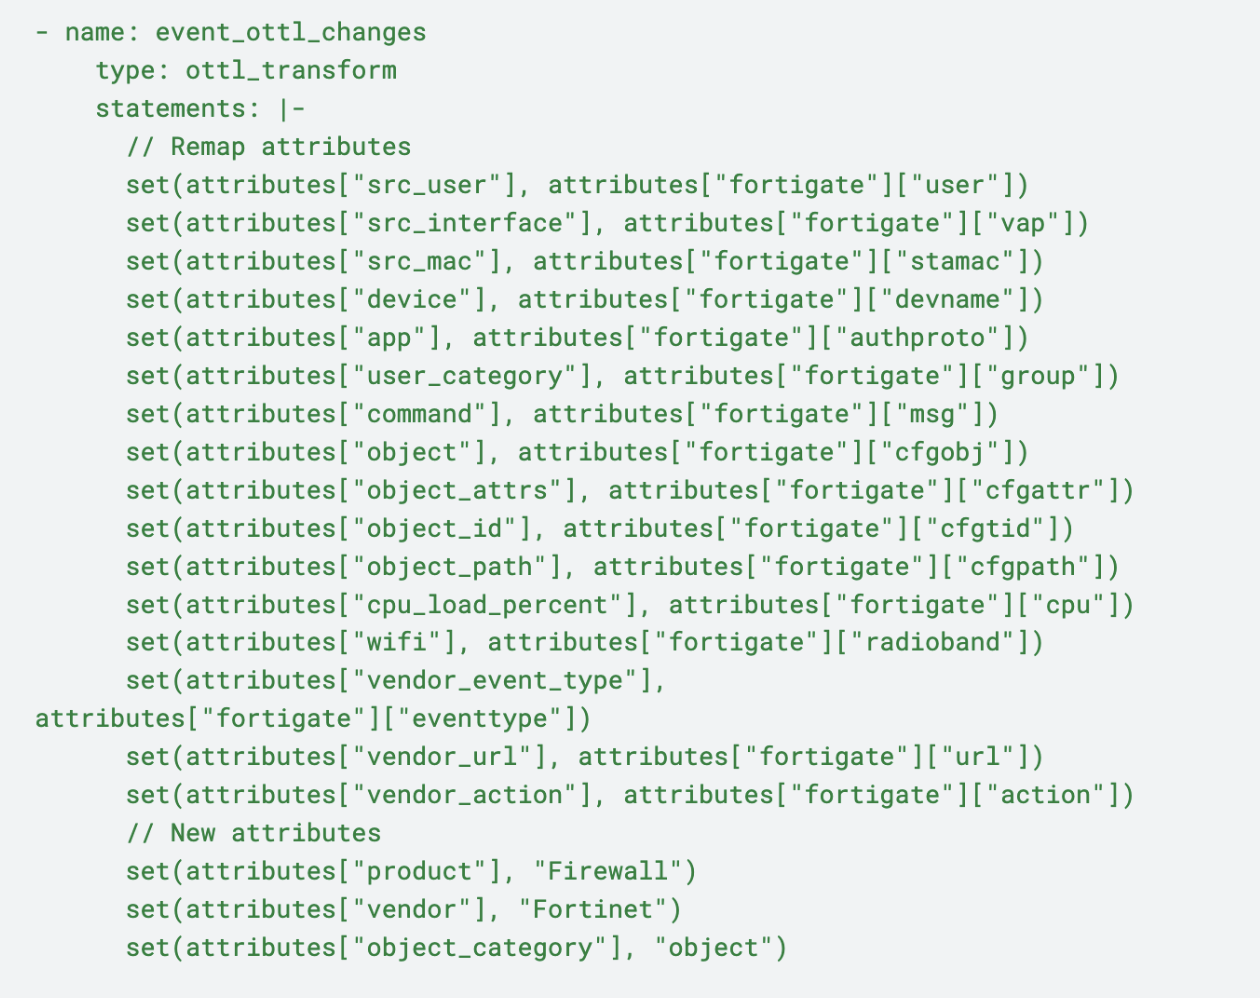
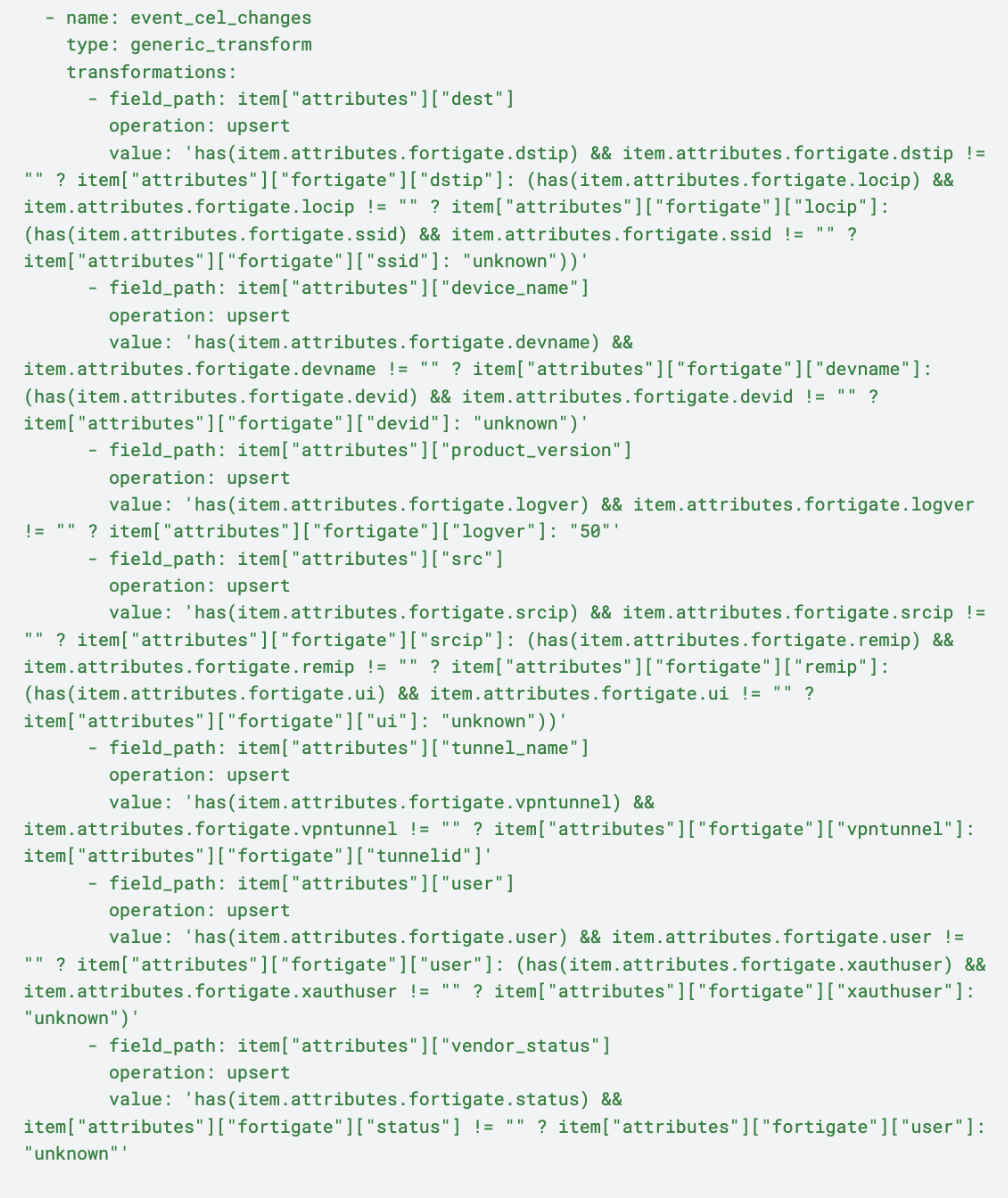
Like UTM and traffic logs, event logs then pass through an {event_cel_changes} transformation node, for the following adjustments:
Destination Address: Configures the device_name by prioritizing dstip, locip, and ssid, ensuring the most relevant address for network tracing
Device Name Resolution: Derives device_name via devname or devid, and defaults to “unknown” to ensure consistent device identification across all logs
Product Version Defaulting: Guarantees the inclusion of product_version, using a default value if unspecified, critical for accurate tracking of the environment
Source Address Compilation: Constructs the src field by leveraging srcip, remip, or ui, ensuring fallback options for reliable source tracking
Tunnel Name Assignment: Populates tunnel_name using vpntunnel or defaults to tunnelid, providing a structured layer name for better traceability
User Identification: Maps the user field to user or xauthuser, defaulting to “unknown” to ensure thorough and consistent user tracking for audits
Vendor Status Clarity: Properly assigns attributes to vendor_status to support log completeness by accurately reflecting user status information when possible
Lastly, logs on the event path then flow to the {Event Logs} pack output for shipping out to an eventual destination.
FortiGate Pack in Practice
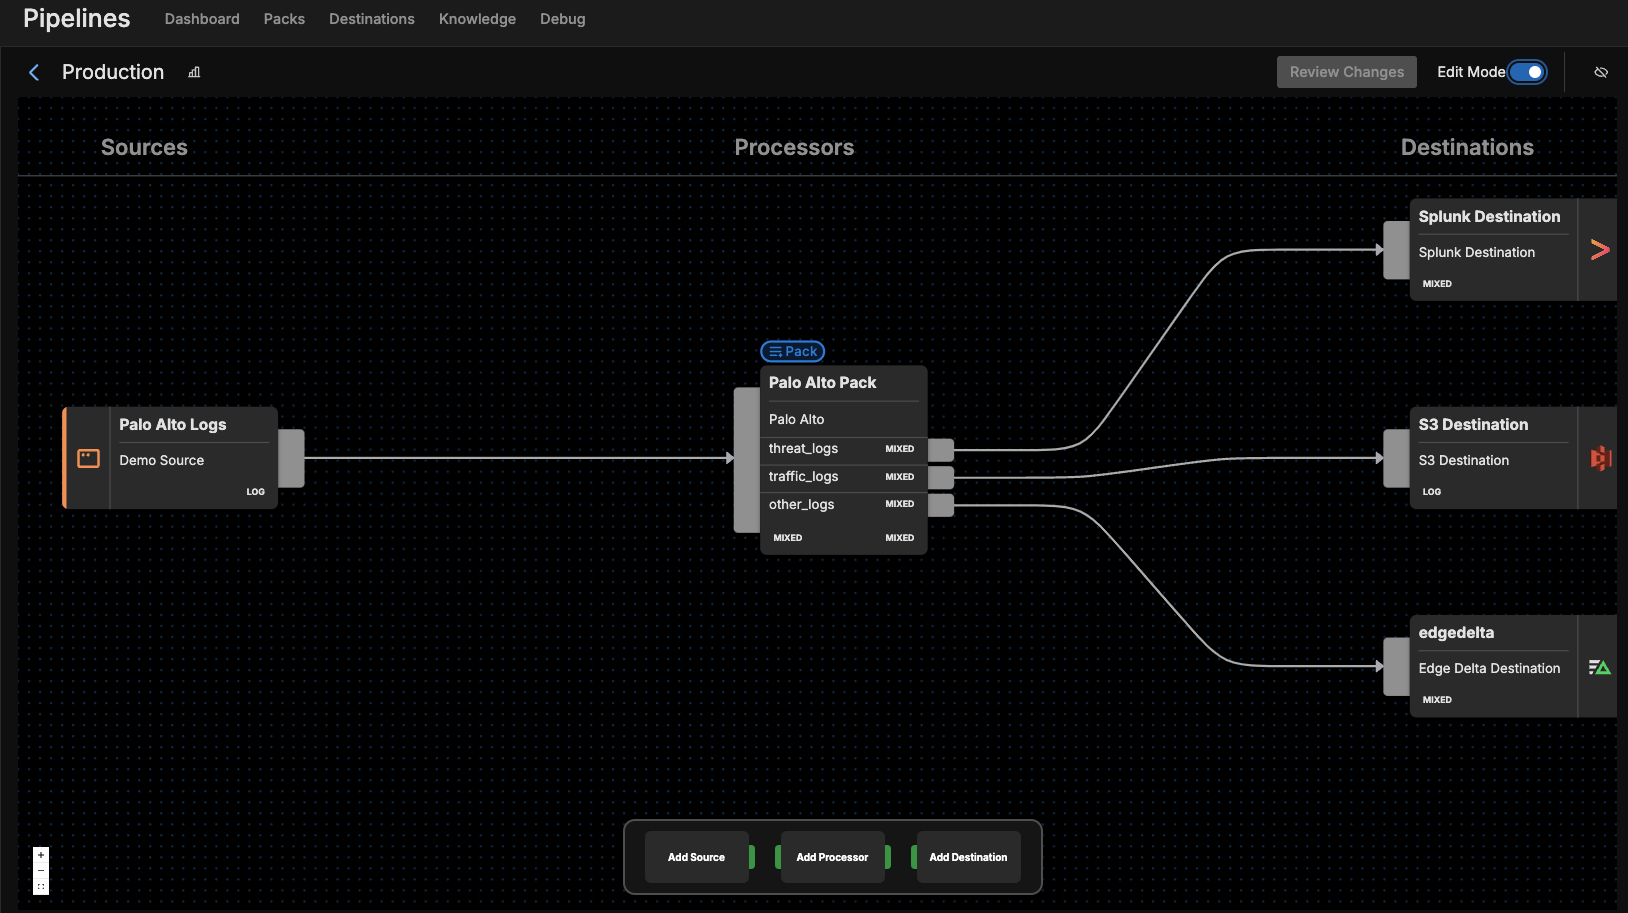
After adding the FortiGate pack to a pipeline, navigate to the Visual Pipelines builder. From there, simply drag and drop the connection from the initial Fortinet Logs source to the pack. Next, add your desired Destination(s) within Visual Pipelines, and once they are in place, you can easily create new connections to route the processed data from the pack to those destinations.
One of the best parts about Edge Delta Telemetry Pipelines is that they allow you to ship your firewall log data from any source to any destination. For instance, you can route your processed FortiGate Traffic logs to a SIEM like Splunk or IBM QRadar for further investigation. You can also ship a full copy of all raw log data to S3 for archival storage and compliance purposes. You can also leverage Edge Delta’s built-in analysis capabilities as a Destination, where your processed logs will be available for monitoring in less time than most other premium platforms.
Getting Started
Ready to see the FortiGate Pack in action? Visit our pipeline sandbox to try it out for free! Already an Edge Delta Customer? Check out our packs list and add the FortiGate Pack to any running pipeline.


