

As modern software systems become more complex and distributed, engineering teams need a clear way to trace behavior, monitor performance, and diagnose issues in real time.
This is where instrumentation comes in, and OpenTelemetry plays a central role in making observability consistent and scalable across systems.
OpenTelemetry provides a unified framework for generating traces, metrics, and logs in standard format across languages and services. It allows developers to instrument code with minimal overhead and, through the OTel Collector, provides an efficient way to route the OTel-formatted telemetry data directly to observability backends.
This guide focuses on how to instrument a Python app to generate trace data using OpenTelemetry. We’ll walk through setup, cover the differences between automatic and manual instrumentation, configure exporters using OTEL Collector, and re-iterate best practices.
Whether you’re building a microservice or a full-stack system, consistent instrumentation is the foundation of reliable observability. Let’s break down what it takes to get there.
Key Takeaways
• Instrumentation makes observability possible. Without it, you can’t trace, measure, or debug your app effectively.
• OpenTelemetry handles all telemetry in one place. It collects traces, metrics, and logs with a unified API.
• Use auto-instrumentation to start fast. For deeper insight, add manual spans where needed.
• Keep your telemetry clean and focused. Use clear names, limit noise, and follow best practices.
Why Instrumentation Matters
Instrumentation is the entry point to observability. Without it, even the best monitoring tools are blind.
In Python applications, properly instrumented code produces three core signals: traces, metrics, and logs. These are structured, correlated insights that reveal how services interact, where processing time is spent, and if there are issues that need attention.
Three Pillars of Observability
Traces, metrics, and logs are often referred to as the pillars of observability. Each one provides a different perspective on how your system behaves, and together, they give you a complete picture.
• Traces connect the dots across service calls, revealing bottlenecks or failed dependencies.
• Metrics track performance trends, like request durations or memory usage.
• Logs add granular context, which is useful when diagnosing specific failures.
Understanding the three pillars and their significance can help you see how proper instrumentation brings them together and why it matters in real-world systems.
OpenTelemetry simplifies the process. Instead of juggling multiple libraries and formats, it provides a unified approach to capturing telemetry across the stack. It supports both automatic and manual instrumentation. Plus, it integrates with a wide range of backends.
Instrumentation is no longer optional in modern systems. It is how teams stay ahead of outages, performance regressions, and scaling issues.
OpenTelemetry Architecture
Before adding OpenTelemetry to your Python application, it’s important to understand how the pieces fit together. At a high level, the OpenTelemetry project includes the following components:
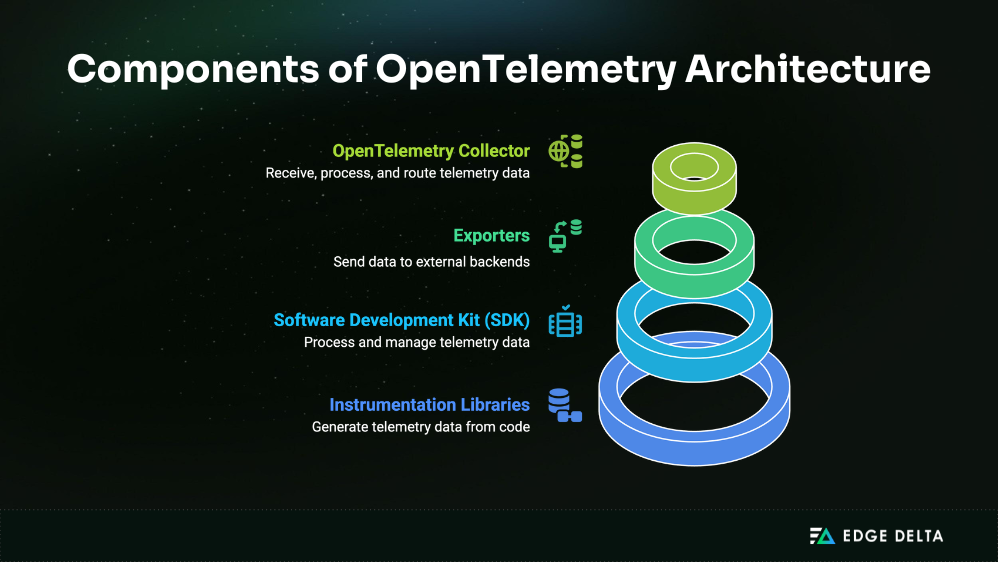
- Instrumentation libraries: These hook into your code or framework to generate telemetry data.
- SDK: Core logic for processing and managing spans, metrics, and logs before they’re expected.
- Exporters: Responsible for sending telemetry data to external backends like Jaeger, Prometheus, or OTLP-compatible platforms.
- OpenTelemetry Collector (optional): A separate service that receives, processes, and routes telemetry from multiple sources. It decouples data generation from ingestion and provides features for batching, filtering, and transformation.
OpenTelemetry supports both auto-instrumentation and manual instrumentation. The former requires minimal code changes, while the latter is used for more precise control. Both rely on context propagation to correlate spans across services.
Understanding these components helps you design a more reliable and scalable observability pipeline, especially as your app grows beyond a single service.
Setting Up OpenTelemetry in a Python Project
To start collecting telemetry from your Python app, you first need to install the core OpenTelemetry packages. These provide the foundation for capturing and exporting data.
Begin by installing the essentials:
pip install opentelemetry-api opentelemetry-sdkIf you’re using auto-instrumentation, add:
pip install opentelemetry-instrumentFor exporting traces, you’ll typically need:
pip install opentelemetry-exporter-otlpYou can now instrument your app using the opentelemetry-instrument CLI:
opentelemetry-instrument python app.pyThis wraps your application and automatically integrates with supported libraries, such as requests, Flask, or Django.
To manually set up the OTLP exporter (for example, sending traces to a collector), initialize the tracer like this:
from opentelemetry import trace
from opentelemetry.sdk.trace import TracerProvider
from opentelemetry.exporter.otlp.proto.grpc.trace_exporter import OTLPSpanExporter
from opentelemetry.sdk.trace.export import BatchSpanProcessor

trace.set_tracer_provider(TracerProvider())
tracer = trace.get_tracer(__name__)

otlp_exporter = OTLPSpanExporter()trace.get_tracer_provider().add_span_processor(
    BatchSpanProcessor(otlp_exporter)
)
With just a few lines of code, your app is now generating trace data. You can verify it using tools like the OpenTelemetry Collector or Jaeger.
Once the basic setup is complete, you’re ready to choose between auto or manual instrumentation, depending on your needs.
Auto-Instrumentation in Python
Auto-instrumentation is the fastest way to start collecting telemetry data. It requires no code changes and works out of the box for many popular Python libraries.
Once OpenTelemetry is installed, use the CLI to wrap your application:
opentelemetry-instrument python app.pyThis command automatically injects tracing logic into supported libraries. That includes requests, Flask, Django, FastAPI, and SQLAlchemy. You don’t need to modify your application code, as OpenTelemetry scans for libraries in use and instruments them at runtime.
Here’s what happens under the hood:
- Middleware is injected into web frameworks
- HTTP client requests are wrapped with trace context
- Database calls are tagged with span metadata (e.g., query, status)
To configure the service name and exporter, set environment variables:
export OTEL_SERVICE_NAME="my-python-app"
export OTEL_TRACES_EXPORTER="otlp"
You can also direct telemetry to a local collector:
export OTEL_EXPORTER_OTLP_ENDPOINT="http://localhost:4317"Auto-instrumentation is ideal for getting started quickly or when working with well-supported frameworks.
However, this approach is not always enough, especially if you need to trace business logic, internal functions, or non-standard integrations. That’s where manual instrumentation comes in.
Manual Instrumentation
Auto-instrumentation is convenient, but it only goes so far. If you need deeper visibility into custom logic, internal functions, or asynchronous flows, manual instrumentation gives you full control.
To instrument traces manually, start by setting up the tracer:
from opentelemetry import trace
from opentelemetry.sdk.trace import TracerProvider
from opentelemetry.sdk.trace.export import BatchSpanProcessor
from opentelemetry.exporter.otlp.proto.grpc.trace_exporter import OTLPSpanExporter

trace.set_tracer_provider(TracerProvider())
tracer = trace.get_tracer(__name__)
otlp_exporter = OTLPSpanExporter()trace.get_tracer_provider().add_span_processor(
    BatchSpanProcessor(otlp_exporter)
)
Once configured, you can create spans around critical code paths:
with tracer.start_as_current_span("process_order"):
    result = process_order()
You can also add attributes to spans for richer context:
with tracer.start_as_current_span("charge_user") as span:
    span.set_attribute("payment.amount", 99.99)
    span.set_attribute("user.id", user_id)
Note: Understanding how spans tie together across services and what kind of metadata to include can be easier with real examples of traces in action.
Manual instrumentation is critical when:
- The supported libraries do not cover your bespoke business logic
- You want to track high-value operations in particular manner
- You need to propagate context across threads or services
This approach requires more effort, but it also gives you precise, actionable telemetry tailored to your system.
Configuring the OpenTelemetry Collector
The OpenTelemetry Collector acts as a central pipeline for telemetry data. It receives, processes, and exports traces, metrics, and logs to decouple your application from your observability backend.
This makes your system more flexible. Instead of sending data directly from each app to a backend like Jaeger or Prometheus, you can send it to the Collector, apply transformations or filtering, and route it anywhere.
A basic Collector configuration defines three core parts:
receivers:
  otlp:
    protocols:
      grpc:

exporters:
  logging:
    loglevel: debug

service:
  pipelines:
    traces:
      receivers: [otlp]
      exporters: [logging]
Save this as otel-collector-config.yaml and run the Collector:
otelcol --config otel-collector-config.yamlYour Python app will now send trace data to the Collector via the OTLP protocol (which uses gRPC under the hood), and the Collector will forward it to the defined exporters.
The Collector supports advanced features like batching, retry policies, and load balancing. It also scales well across services, containers, and environments.
In production environments, the Collector is essential. It gives you control over telemetry flow, minimizes vendor lock-in, and helps you scale observability across distributed systems.
Exporting Data to Observability Backends
Once your app is instrumented, you need to specify the exporter destinations to forward telemetry to observability platforms for storage, visualization, and analysis.
Common exporters for Python include Jaeger, Zipkin, and Prometheus, as well as outbound streaming via the OpenTelemetry Protocol (OTLP). Here’s an example of how to send traces directly to Jaeger:
pip install opentelemetry-exporter-jaegerfrom opentelemetry.exporter.jaeger.thrift import JaegerExporter
jaeger_exporter = JaegerExporter(
agent_host_name="localhost",
agent_port=6831,
)For production systems, OTLP is recommended due to its performance, standardization, and flexibility. You can configure it with:
export OTEL_EXPORTER_OTLP_ENDPOINT=http://localhost:4317The right exporter depends on your backend and infrastructure. What matters is consistency. Choose one that aligns with your team’s tooling and scaling needs.
Best Practices for Python Instrumentation
Instrumentation is only helpful if it produces clean, consistent, and actionable data. Poorly structured spans or noisy metrics can create more confusion than insight. Following a few best practices can help ensure your telemetry works for you, not against you.
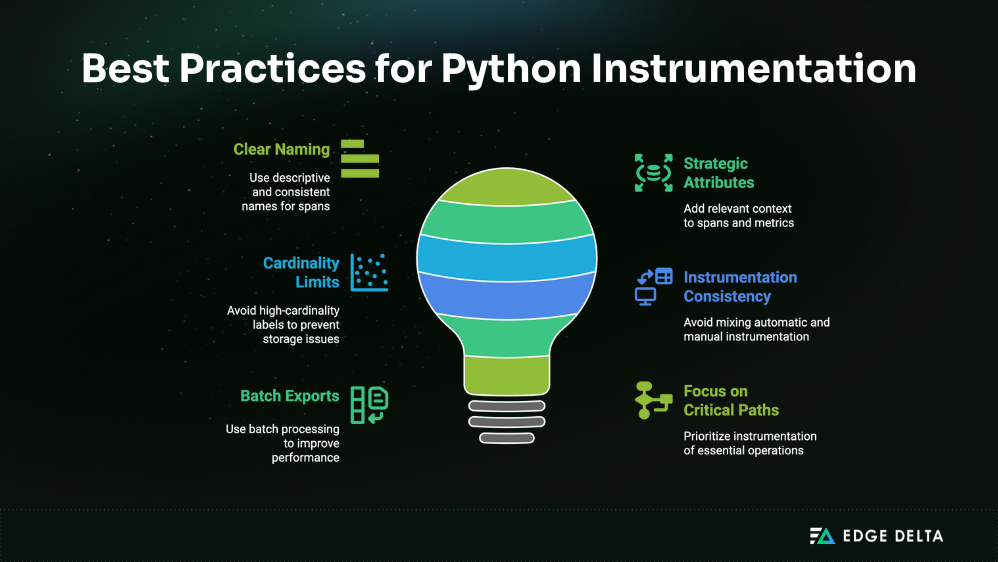
1. Name spans clearly: Use readable, consistent names that reflect actual operations. Avoid vague labels like function_call. Following consistent naming around things like service.name or service.version helps maintain clarity as systems scale, especially across services.
2. Use attributes strategically: Add key context to spans and metrics using attributes (like db.system, http.status_code, or user.id). Adhere to OpenTelemetry semantic conventions whenever possible for improved backend compatibility.
3. Limit span cardinality: Avoid generating high-cardinality labels, such as dynamic values like user emails or UUIDs. They can explode your trace storage and make metrics hard to aggregate.
4. Avoid double instrumentation: Do not mix automatic and manual instrumentation in the same scope unless necessary. You risk creating duplicate spans or breaking trace continuity.
5. Batch exports in production: Use BatchSpanProcessor instead of SimpleSpanProcessor to reduce overhead. It buffers and exports spans in batches, improving performance under load.
6. Instrument what matters: Focus on critical paths, including APIs, database calls, third-party services, and long-running operations. Not everything needs a span.
OpenTelemetry gives you the tools. Applying them thoughtfully is what turns raw telemetry into meaningful observability.
Conclusion
Instrumentation is a foundational layer in any production-grade Python application. With OpenTelemetry, teams get a vendor-neutral, scalable framework for generating and exporting traces, metrics, and logs.
By now, you’ve seen how to set up OpenTelemetry in Python, apply both auto and manual instrumentation to generate trace data, configure the Collector, and push data to your observability backend. You’ve also seen where problems tend to surface and how to avoid common missteps.
The goal is not just to collect data. It’s to capture the right signals in the right places with the least amount of friction. OpenTelemetry makes this possible with clear standards, cross-language support, and broad ecosystem adoption.
Whether you’re debugging a slow API, tracking service dependencies, or preparing to scale, consistent instrumentation ensures your app is built to be observable.
FAQs
What’s the difference between OpenTelemetry and Prometheus?
Prometheus tracks metrics. OpenTelemetry captures everything (traces, metrics, and logs). Think of Prometheus as a focused tool, while OpenTelemetry is the full observability toolkit.
Can I use OpenTelemetry with AWS Lambda or other serverless apps?
Yes. OpenTelemetry works with AWS Lambda via dedicated Lambda layers. Be smart about setup. Serverless apps are short-lived, so efficient context propagation and exporter config (such as OTLP with batching) are key to obtaining clean, consistent traces.
Does OpenTelemetry support FastAPI or asyncio apps?
It does. OpenTelemetry plays well with FastAPI, Starlette, and native asyncio. Auto-instrumentation works out of the box, and async context propagation ensures your traces do not break, even in coroutine-heavy flows.
Sources

