Modern observability teams face a critical challenge: separating high-value alerts and data from noise during troubleshooting. As environments grow in complexity and scale, alert volumes skyrocket beyond what humans can feasibly manage. At the same time, telemetry data becomes increasingly fragmented, resulting in significantly slowed incident detection and response. And even when teams correctly identify the high-value alerts, they are often forced to filter through large portions of irrelevant data during remediation.
Edge Delta’s collaborative AI Teammates address these challenges. Our agentic observability team autonomously analyzes your alerts and triages issues, correlating data from across your environment and escalating only when human intervention is needed. They’re supplied with real-time data by our intelligent Telemetry Pipelines, which include advanced processors and filters to eliminate noise and preserve only high-value insights needed for investigations.
In this post, we’ll show you how Edge Delta’s AI Teammates run observability workflows that automate incident analysis and accelerate troubleshooting troubleshooting across your production systems. Then, we’ll take a look under the hood to see how the underlying pipeline’s OTTL Context Filter makes this possible.
Investigating and Remediating Faster with AI Teammates
AI Teammates automatically correlate high-value signals from across your environment, which enables them to conduct effective root cause analysis and initiate remediation workflows in real time.
To demonstrate this, we’ve set up a demo environment with a full-stack purchasing application where errors can cascade across components — the kind of scenario where manual troubleshooting becomes time-consuming and complex.
This demo is made up of three key components:
- An NGINX frontend that handles customer requests
- A backend purchase service that processes checkout requests
- A PostgreSQL database that stores user information and session data
After some time running the demo, we notice a recent spike in log volume around database timeouts. The surge of error logs indicates a newly surfaced incident:
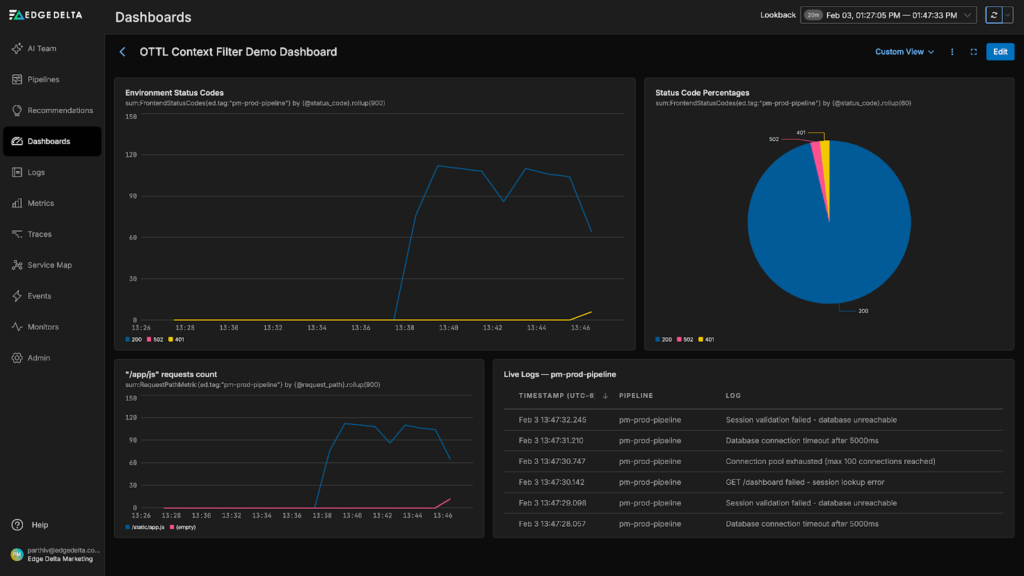
Rather than running manual queries, we initiate an autonomous investigation by asking about it in the “#incident-response” channel:
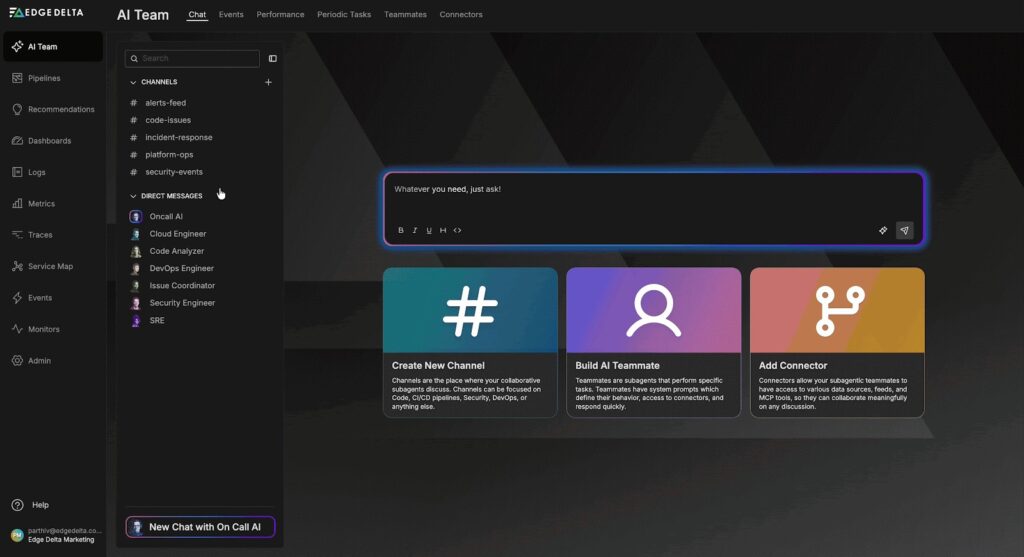
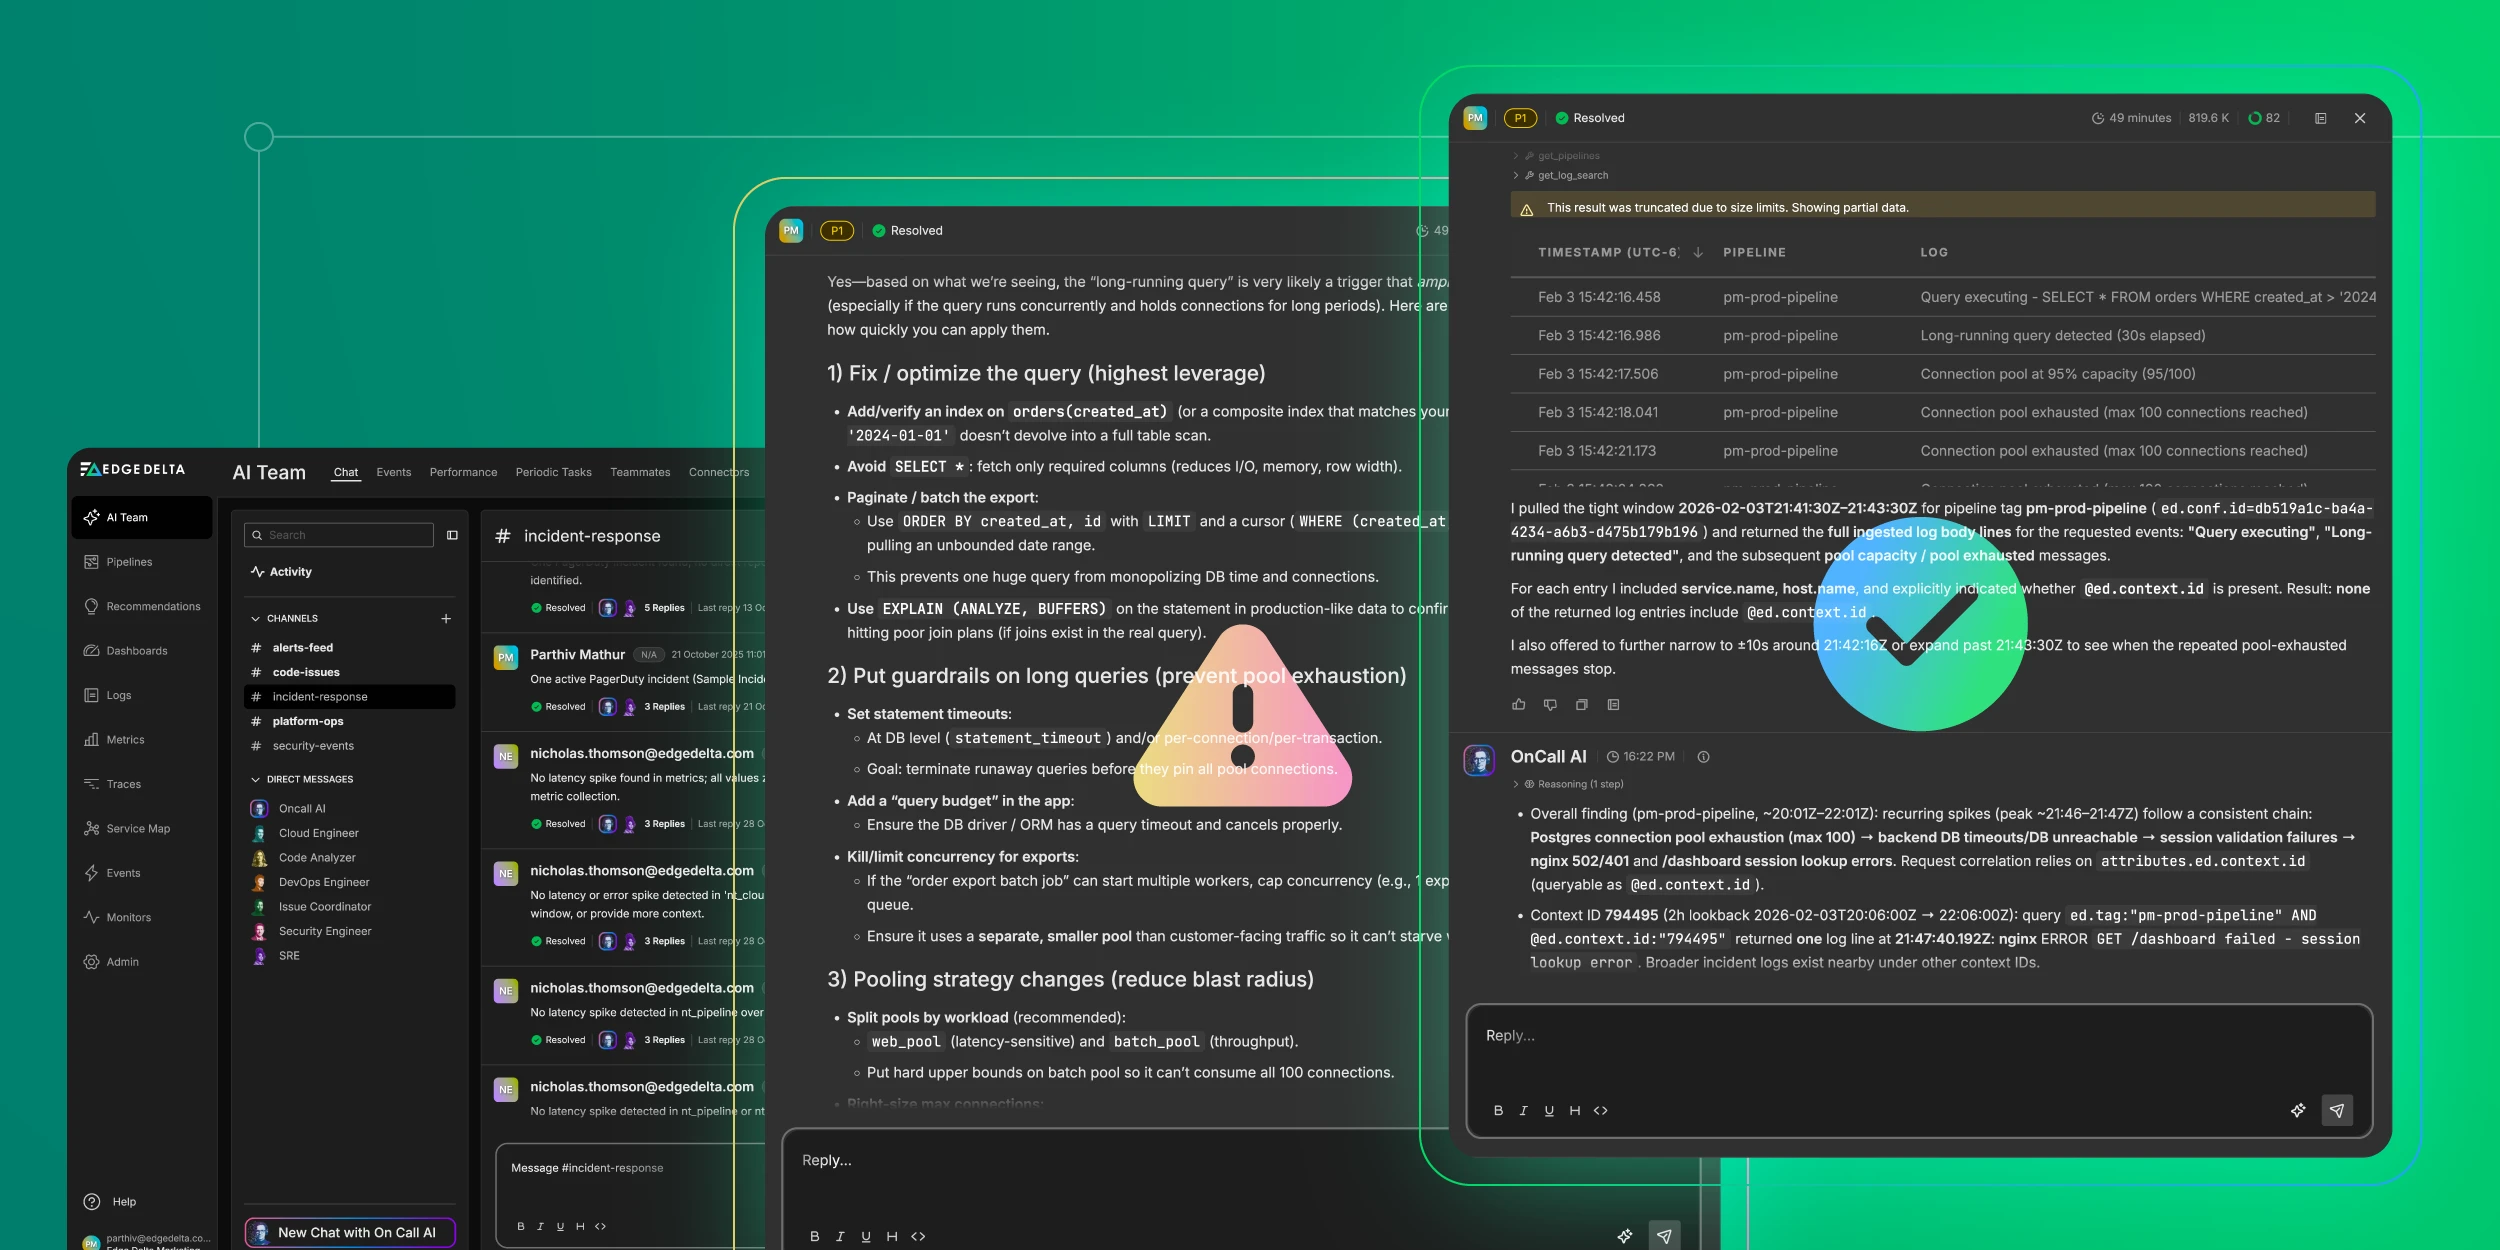
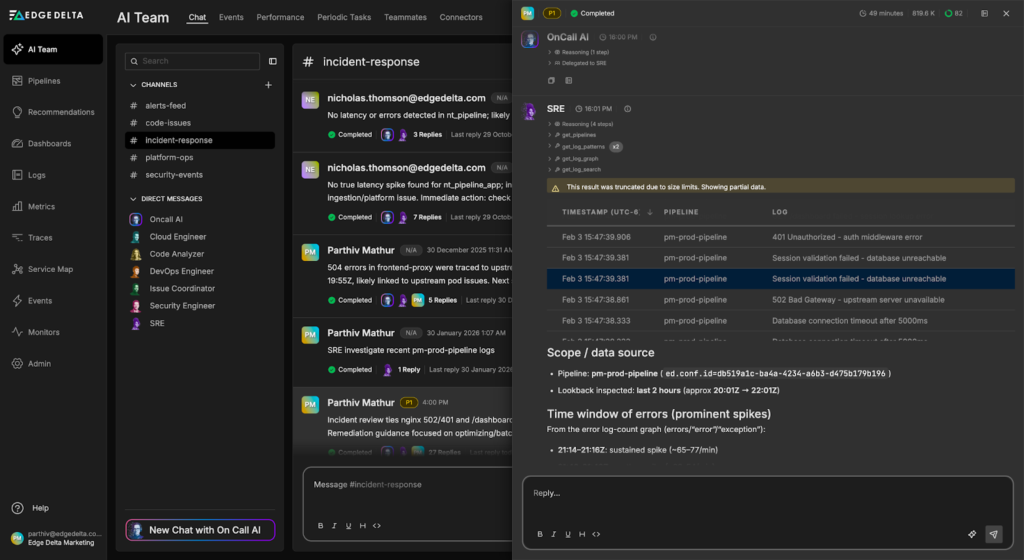
The OnCall AI super-agent analyzes our request and immediately engages the SRE Teammate, which begins triaging the issue:
The SRE Teammate quickly determines that the error logs alone are insufficient for diagnosis. It modifies its query to pull relevant contextual logs from each service for analysis:
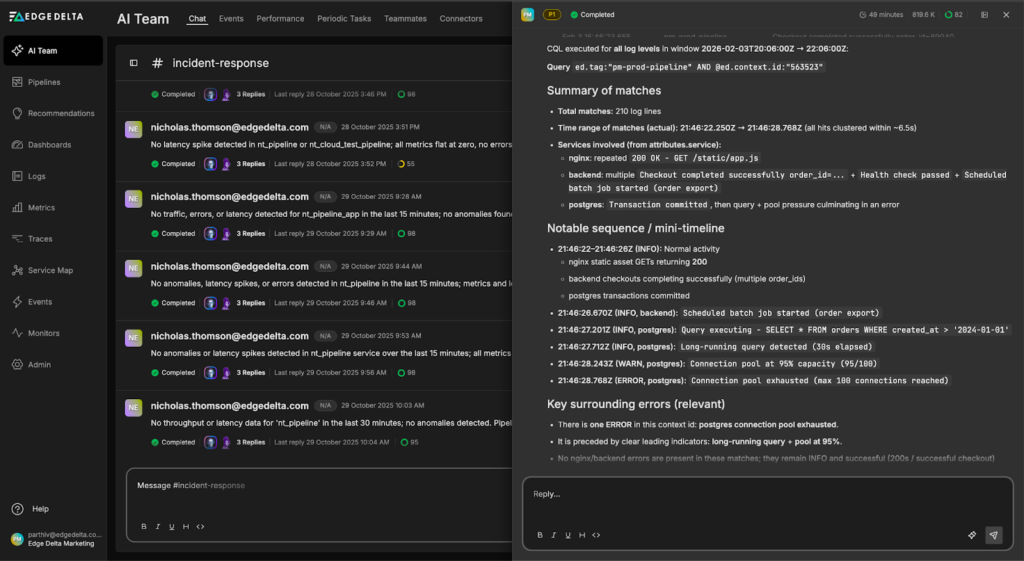
Through this analysis, the Teammate identifies the root cause: a long-running database query captured in an INFO log. This query consumed excessive database connections, causing pool exhaustion and the cascade of errors across the system.
The SRE Teammate synthesizes its findings and provides a comprehensive incident summary along with remediation recommendations:
Incident Summary:
Overall finding (pm-prod-pipeline, ~20:01Z–22:01Z): recurring spikes (peak ~21:46–21:47Z) follow a consistent chain: Postgres connection pool exhaustion (max 100) → backend DB timeouts/DB unreachable → session validation failures → nginx 502/401 and /dashboard session lookup errors. Request correlation relies on attributes.ed.context.id (queryable as @ed.context.id).
-
Context ID 563523 (same window): 210 log matches clustered in ~6.5s (21:46:22.250Z → 21:46:28.768Z). Includes normal activity (200s for static assets, successful checkout, health check OK, order export batch started) plus Postgres activity leading into exhaustion.
-
Postgres log detail for @ed.context.id:”563523″ around 21:46:27Z–21:46:28Z:
- INFO Query executing – SELECT * FROM orders WHERE created_at > ‘2024-01-01’.
- INFO Long-running query detected (30s elapsed).
- WARN Connection pool at 95% capacity (95/100).
- ERROR Connection pool exhausted (max 100 connections reached).
Recommended Actions:
Optimize the query (highest impact):
- Add index on orders(created_at) to avoid full table scans
- Replace SELECT * with specific columns to reduce I/O
- Implement pagination using LIMIT with cursor-based iteration instead of unbounded date ranges
- Use EXPLAIN (ANALYZE, BUFFERS) to verify query plan efficiency
Implement query guardrails (prevent pool exhaustion):
- Set statement_timeout at database and application levels to terminate runaway queries
- Cap export job concurrency and use a separate connection pool for batch operations
- Ensure batch jobs cannot starve customer-facing traffic
Refine pooling strategy (reduce blast radius):
- Split pools by workload: web_pool for latency-sensitive requests, batch_pool for background jobs with hard limits
- Consider PgBouncer for transaction pooling if handling many short-lived connections
Once human approval is granted, AI Teammates can swiftly push these updates to our SQL queries or update code to fix the root cause.
Under the Hood: How Edge Delta’s Telemetry Pipelines Filter Noise For Your AI Team
AI Teammates deliver effective analysis because they work only with curated streams of high-value data. Our intelligent Telemetry Pipelines filter out noise before it flows downstream, ensuring AI Teammates retain and focus only on relevant signals during investigations.
Edge Delta’s OpenTelemetry Transformation Language (OTTL) Context Processor is one of the many pipeline filters that enable this selective data retention. It suppresses context-level logs during normal operations but automatically includes them the moment an incident is detected, ensuring AI Teammates have clean signals and comprehensive context during troubleshooting.
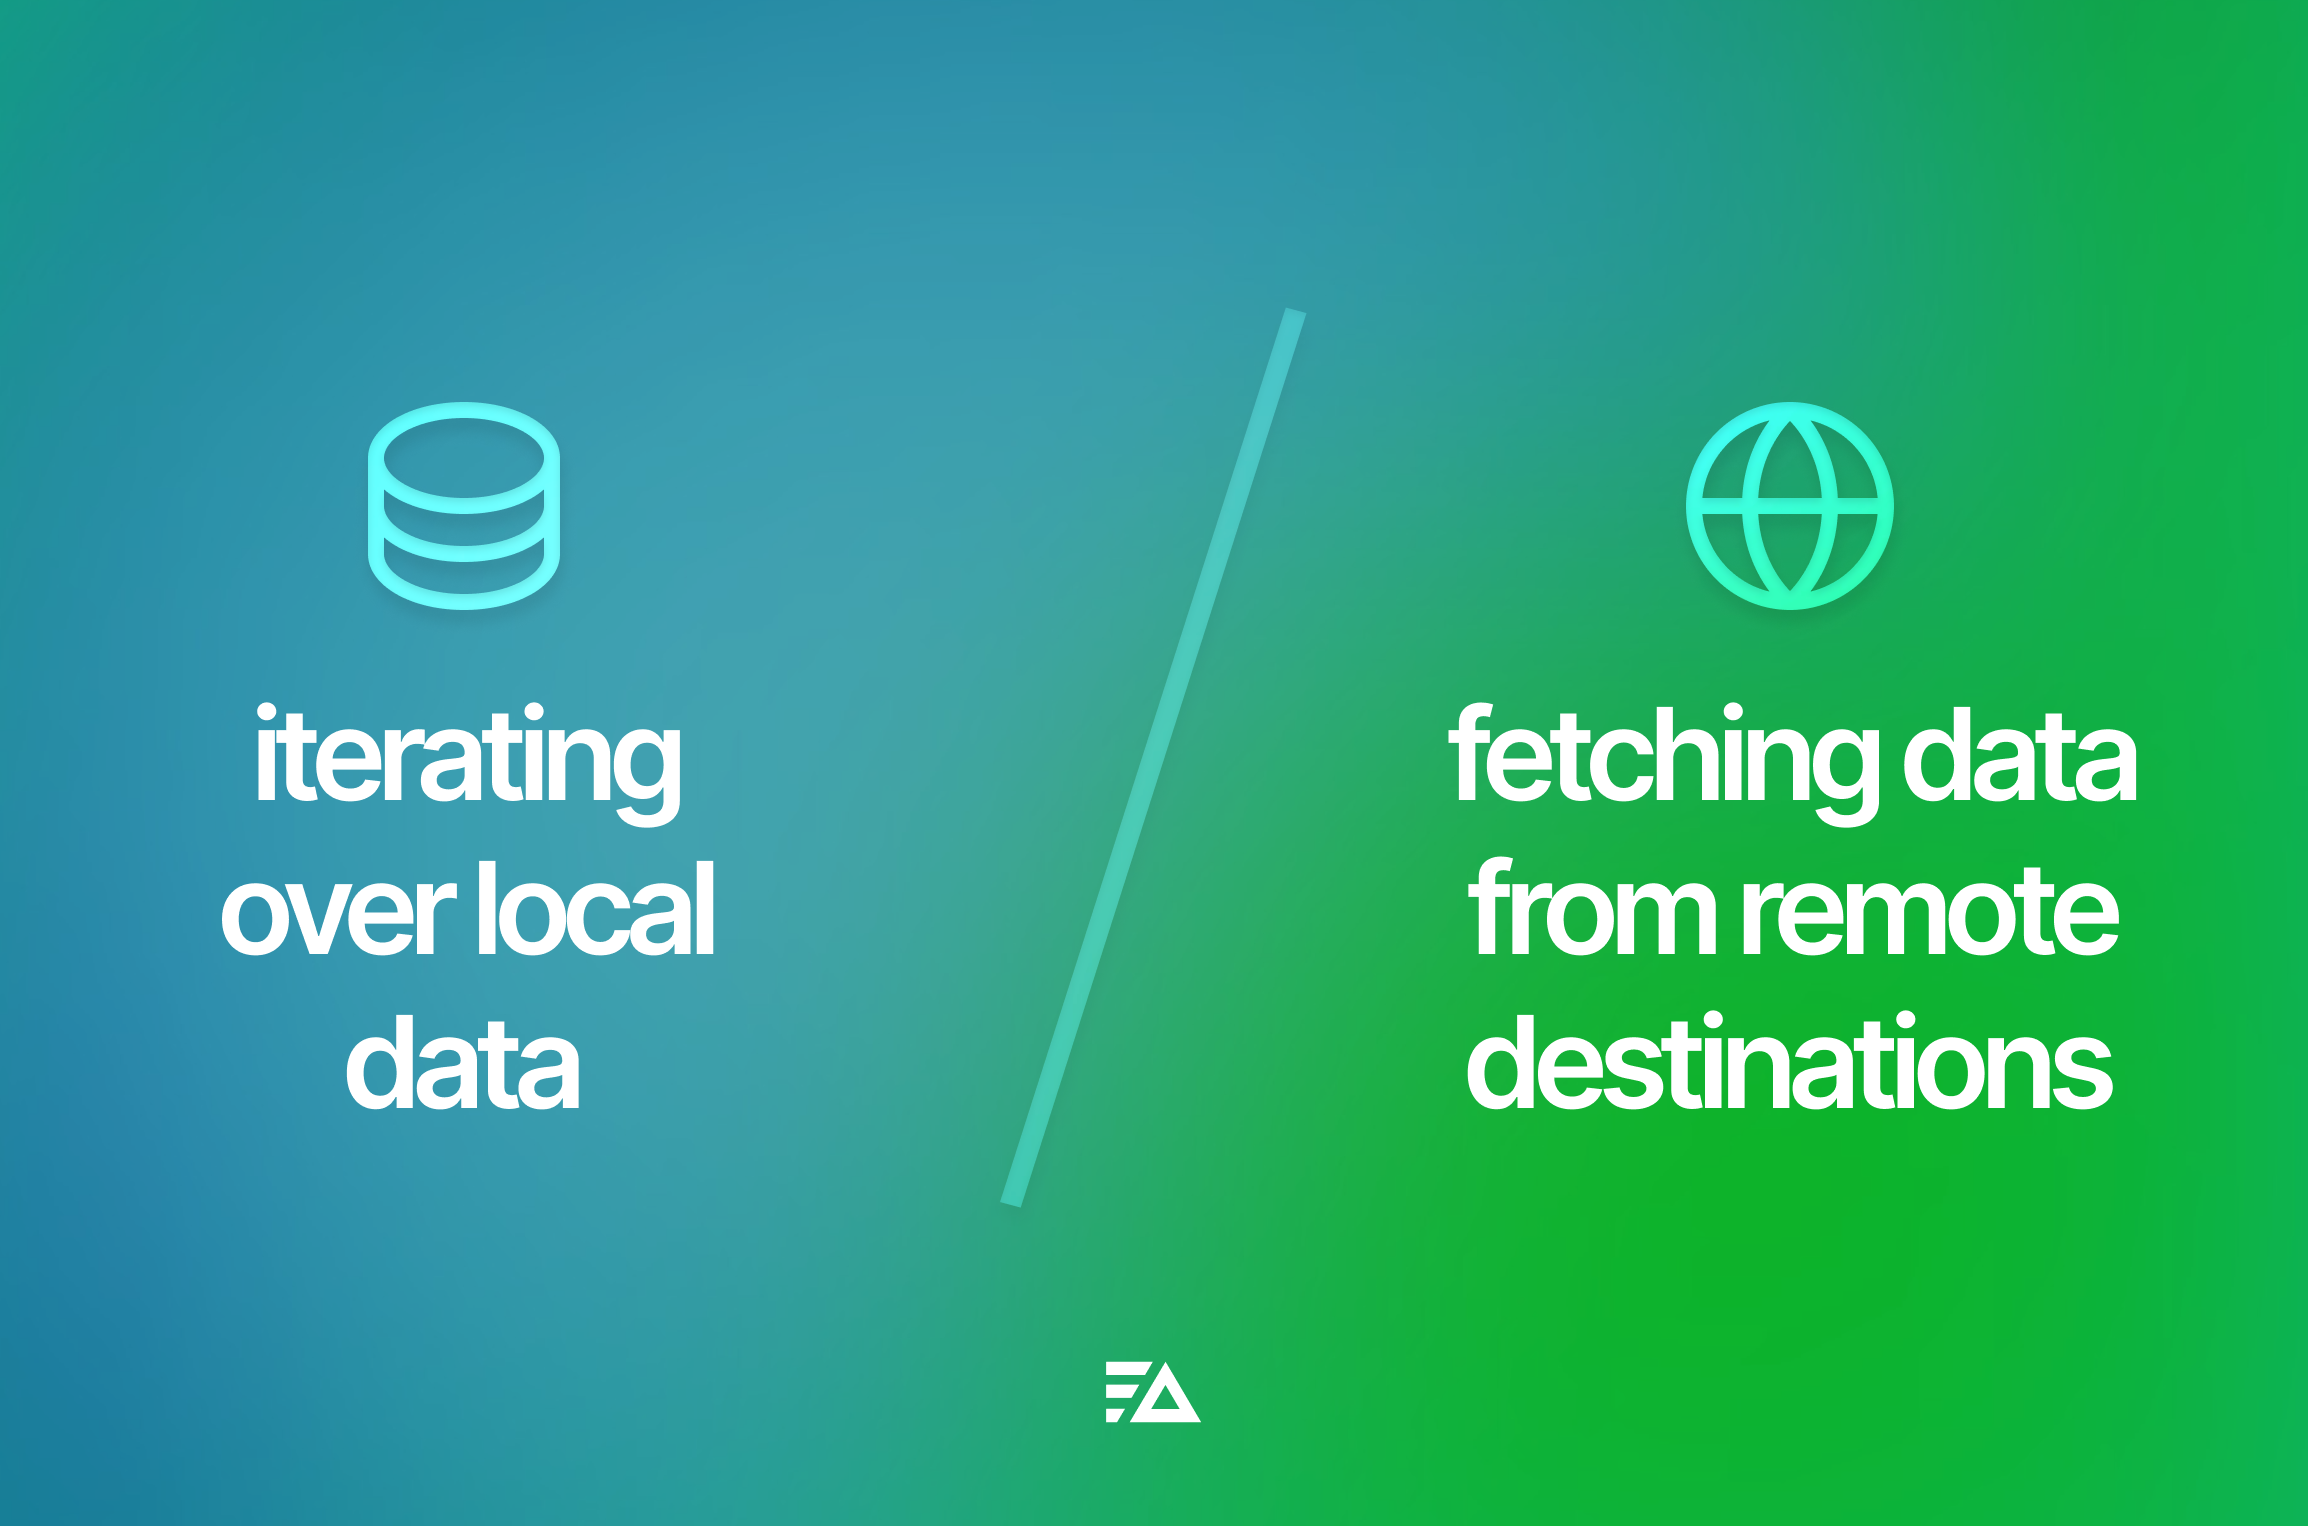
For example, the underlying pipeline in the demo above is using an OTTL Context Filter that’s configured to classify “ERROR” logs as triggers, and all other log levels (DEBUG, WARN, INFO, TRACE) as context. During normal operations, context logs are filtered out — however, when a trigger log is detected, the filter forwards the surrounding context logs to AI Teammates:
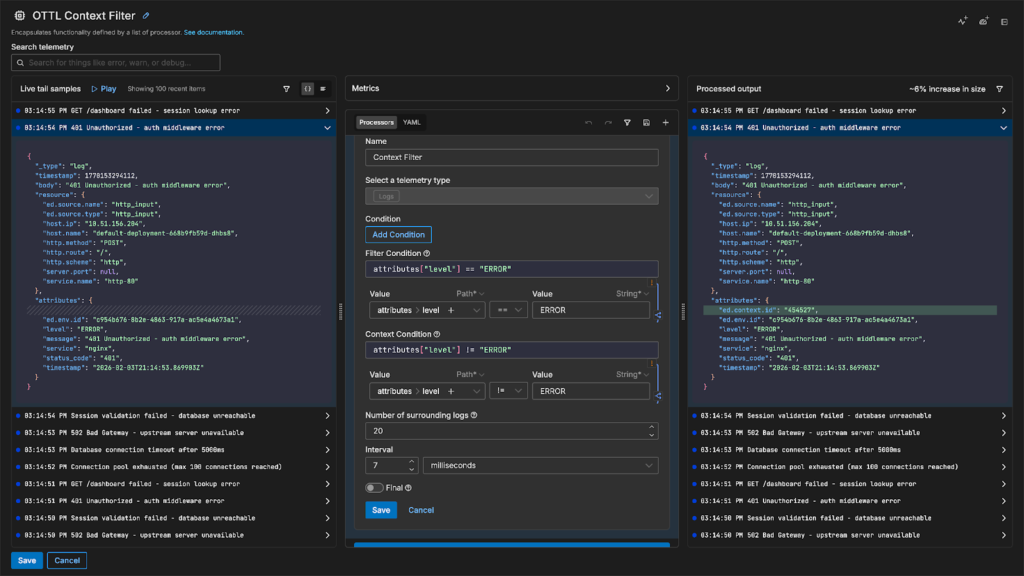
You can configure the filter using either time-based or frequency-based parameters, giving you precise control over how much context to preserve. It uses OTTL under the hood for log evaluations, which ensures interoperability with the broader OpenTelemetry ecosystem while giving you the full power and flexibility to easily define complex filtering logic.
The diagram below illustrates how the OTTL Context Filter evaluates logs as they pass through the pipeline:
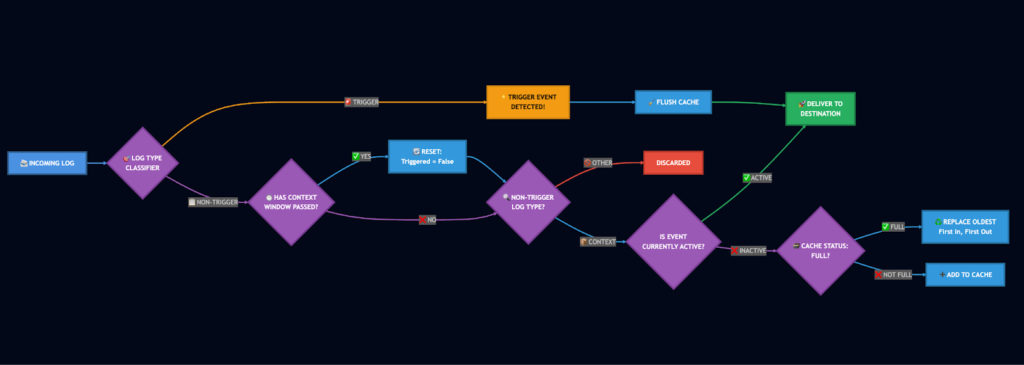
When a log enters the context filter, it’s first evaluated against the trigger condition. If the log matches, the filter initiates a trigger event — immediately forwarding the trigger log and flushing any cached context logs to your downstream destination.
If the log doesn’t match the trigger condition, the filter determines whether it qualifies as context based on your defined context criteria. Non-context logs are filtered out immediately. Context logs are handled based on the current trigger state: if a trigger event is active, they’re forwarded downstream; if not, they’re cached for potential use with the next trigger event. The cache uses a last-in-first-out replacement strategy to ensure the most recent context is always preserved when capacity is reached.
Once the context window following a trigger event closes, the trigger state resets and the filter returns to its normal caching behavior. This approach ensures AI Teammates have access to critical context during incidents while eliminating up to 90% of routine log noise, reducing storage costs and query complexity.
Conclusion
Edge Delta’s AI Teammates transform incident response by autonomously correlating signals, diagnosing root causes, and recommending fixes in real time. In our demo, the SRE Teammate immediately identified the problematic SQL query buried in an INFO-level log and traced the cascading impact across services, eliminating the manual detective work that typically consumes hours of engineering time.
This autonomous analysis is made possible by the intelligent data filtering capabilities of our Telemetry Pipelines. The OTTL Context Filter ensures AI Teammates work with clean, relevant data by filtering aggressively during normal operations while automatically capturing full context during incidents.
Together, AI Teammates and intelligent Telemetry Pipelines shift incident response from reactive troubleshooting to proactive resolution, freeing your team to focus on building rather than firefighting.
Ready to see AI Teammates in action? Book a meeting with a member of our technical team, or try it yourself with a free, 30-day trial.

