As the volume and complexity of telemetry data continues to grow, teams are looking for better ways to control their log volumes, reduce observability costs, and extract meaningful insights. Traditional volume reduction techniques like filtering, sampling, and suppression can help reduce costs, but they often drop data that’s critical for troubleshooting or investigations. Aggregation techniques like log to metric conversion can minimize data loss while reducing log volumes, but traditional tools require teams to specify data processing configurations in advance — which can be a challenge in dynamic environments.
Edge Delta Patterns are the modern solution for log data optimization. By applying intelligent clustering algorithms on your logs as they’re created, Edge Delta’s Telemetry Pipelines dynamically group logs into patterns in real time, automatically adapting to changes in data flows without sacrificing visibility.
In this blog post, we’ll take a closer look at Edge Delta Patterns — covering how they work behind the scenes, and how you can use them to cut observability costs while improving insight quality.
What Are Edge Delta Patterns, and How Do They Work?
Edge Delta Patterns are log aggregations made on a certain attribute — most commonly on the {body} field — over a specified period of time. These aggregations are created by grouping similar logs together, and replacing variable parts within the log bodies (e.g., timestamps, IDs, IP addresses) with wildcards. They’re performed dynamically using our Log to Pattern processor node, which leverages a custom implementation of the Drain algorithm to generate the patterns in real time as logs flow through it.
For example, consider the following logs:
[2025-05-13 07:26:29+00:00][worker:12][WARN]: Worker had error getting browser context [Error: Protocol error: Connection closed.] An exception occurred in the database while saving changes for context type 'EasyTrade.BrokerService.BrokerDbContext'. [2025-05-13 07:32:27+00:00][worker:19][WARN]: Worker had error getting browser context [Error: Protocol error: Connection closed.] [2025-05-13 07:26:29+00:00][worker:10][WARN]: Worker had error getting browser context [Error: Protocol error: Connection closed.] [2025-05-13 07:24:45+00:00][worker:10][WARN]: Worker had error getting browser context [Error: Protocol error: Connection closed.] An exception occurred in the database while saving changes for context type 'EasyTrade.BrokerService.BrokerDbContext'. [2025-05-13 07:32:45+00:00][worker:20][WARN]: Worker had error getting browser context [Error: Protocol error: Connection closed.] An exception occurred in the database while saving changes for context type 'EasyTrade.BrokerService.BrokerDbContext'.
The Log to Pattern node will evaluate the logs and cluster them accordingly:
* Worker had error getting browser context Error Protocol error Connection closed
An exception occurred in the database while saving changes for context type EasyTrade BrokerService BrokerDbContext
As you can see, the Log to Pattern node identified two core log structures, removed the timestamps and other character variants, and grouped them into the identified patterns. Additionally, users can optimize memory usage and similarity thresholds by modifying the algorithm’s parameters, tailoring pattern groups to their specific environment needs.
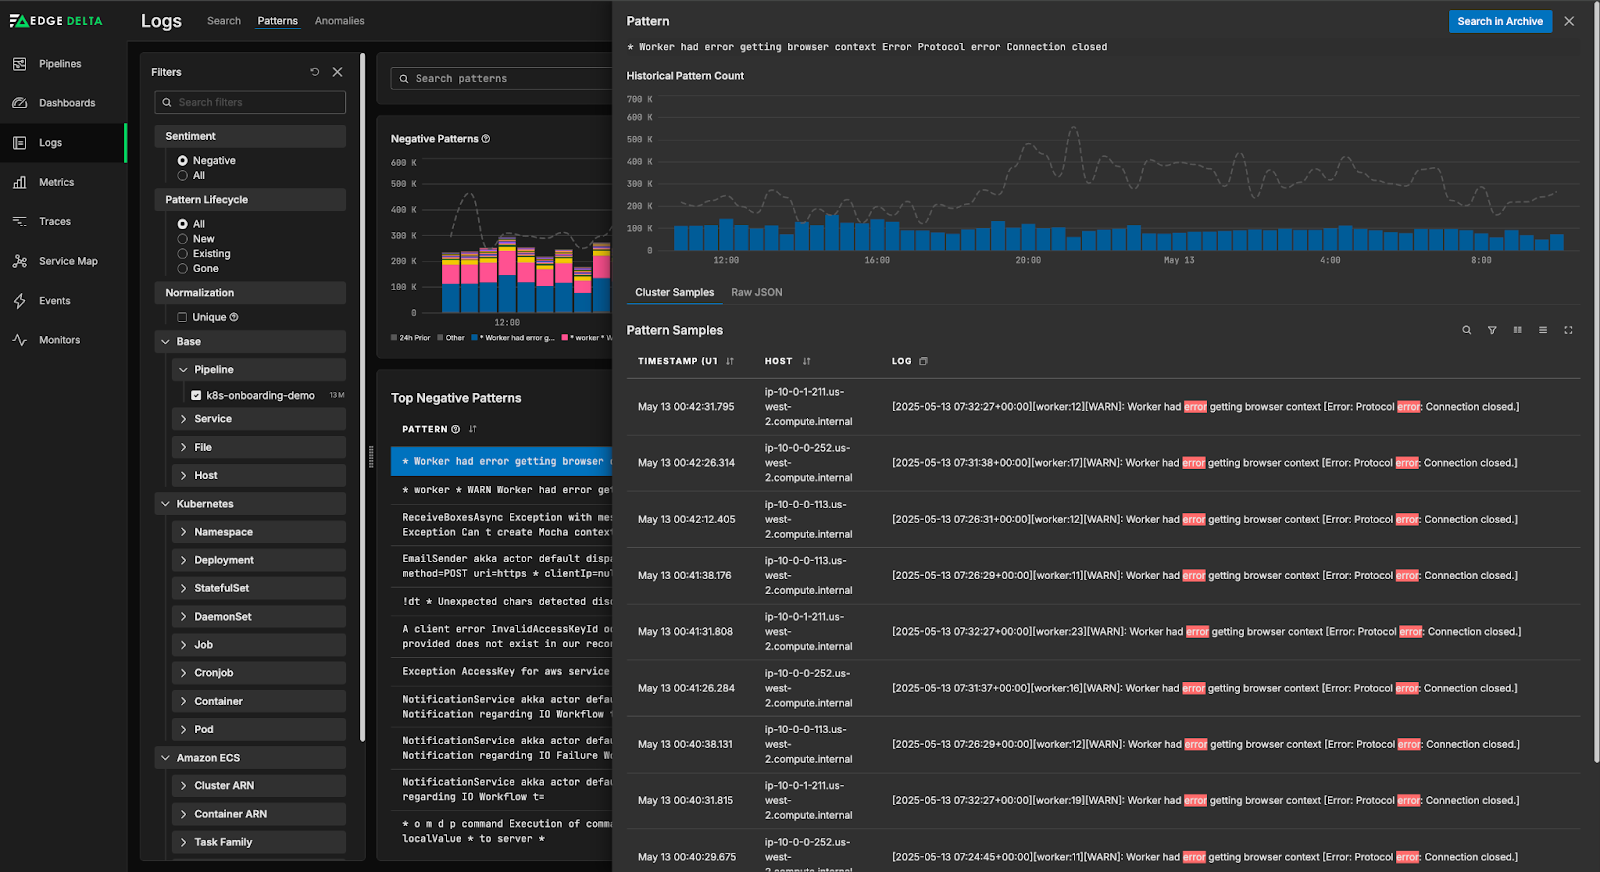
Once the patterns are created, the Log to Pattern node assigns each one a sentiment score. In the example above, both patterns will be marked as “negative” sentiment, as they’re describing errors and exceptions. From there, they can be shipped downstream to any destination, including Edge Delta’s Observability Platform. If sent to us, you can visualize pattern behavior with rich context — including data volume trends and total log count — and compare pattern activity to a historically-accurate baseline.
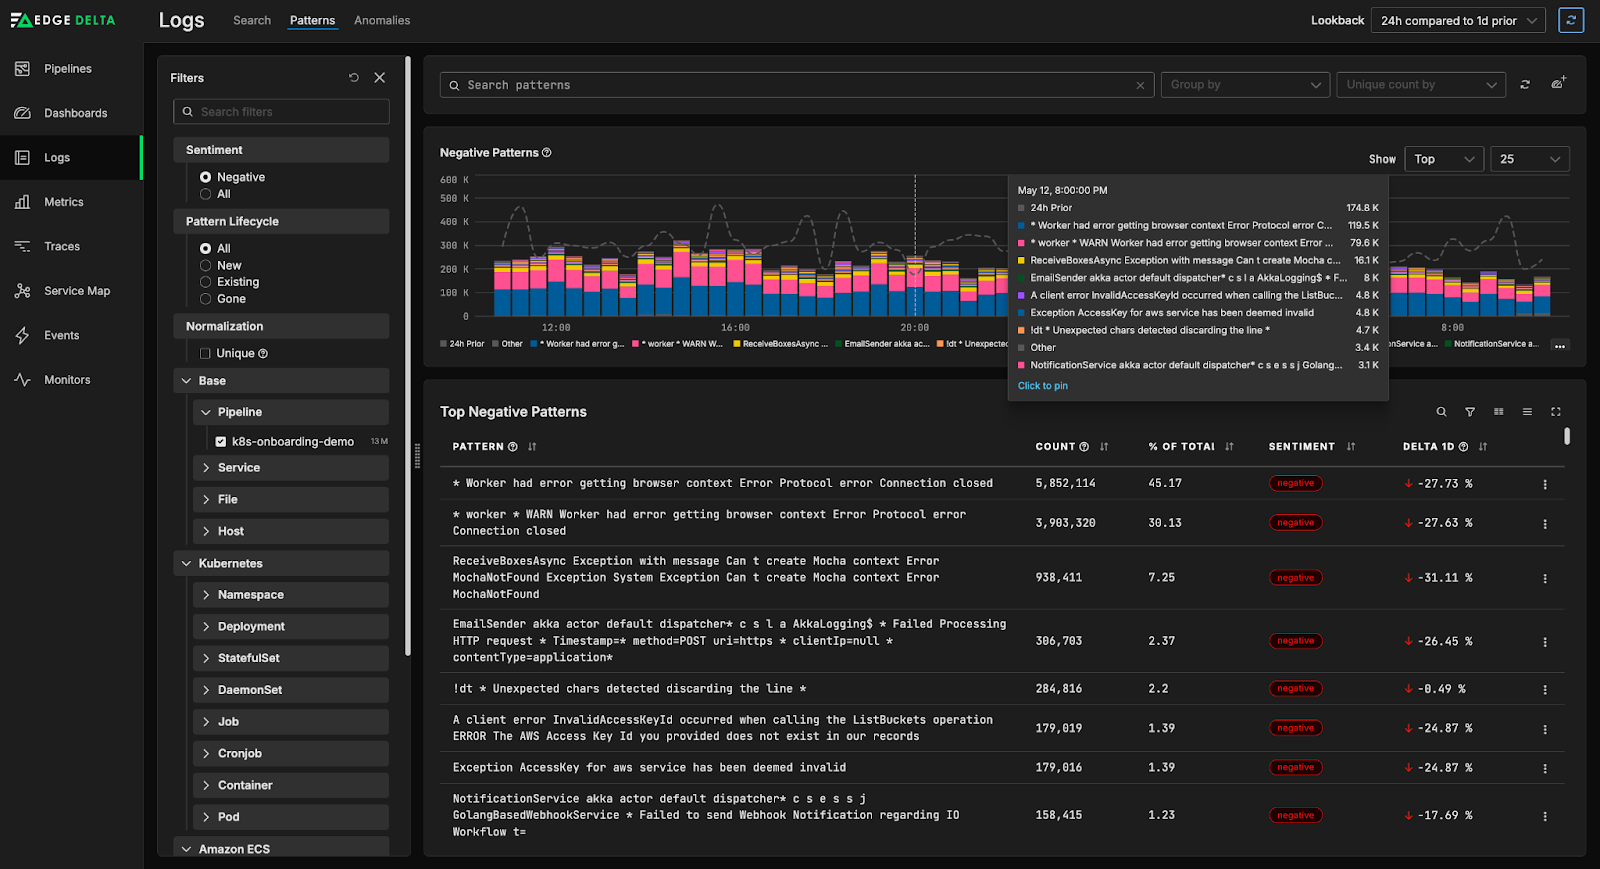
You can also filter through the patterns or drill down into individual entries, which provides crucial context when you’re troubleshooting an issue in your environment.
Though some legacy platforms offer patternization features, they can’t match Edge Delta’s capabilities at scale. Instead of creating patterns pre-index, they require you to manually run pattern detection queries on indexed data in their backend — which is incredibly time-consuming and can be cost-prohibitive. By creating patterns with Edge Delta’s Telemetry Pipelines, you can surface patterns efficiently without incurring high downstream costs.
Leverage Patterns to Easily Reduce Ingested Data Volume
With our intuitive Patterns UI, teams can quickly identify log patterns that capture verbose, low-value data, and instantly filter those logs out of their pipelines to reduce data volume.
For instance, take the demo pipeline shown below, which is collecting Palo Alto threat and traffic logs, processing them, and forwarding both a full-fidelity and patternized copy into Edge Delta:
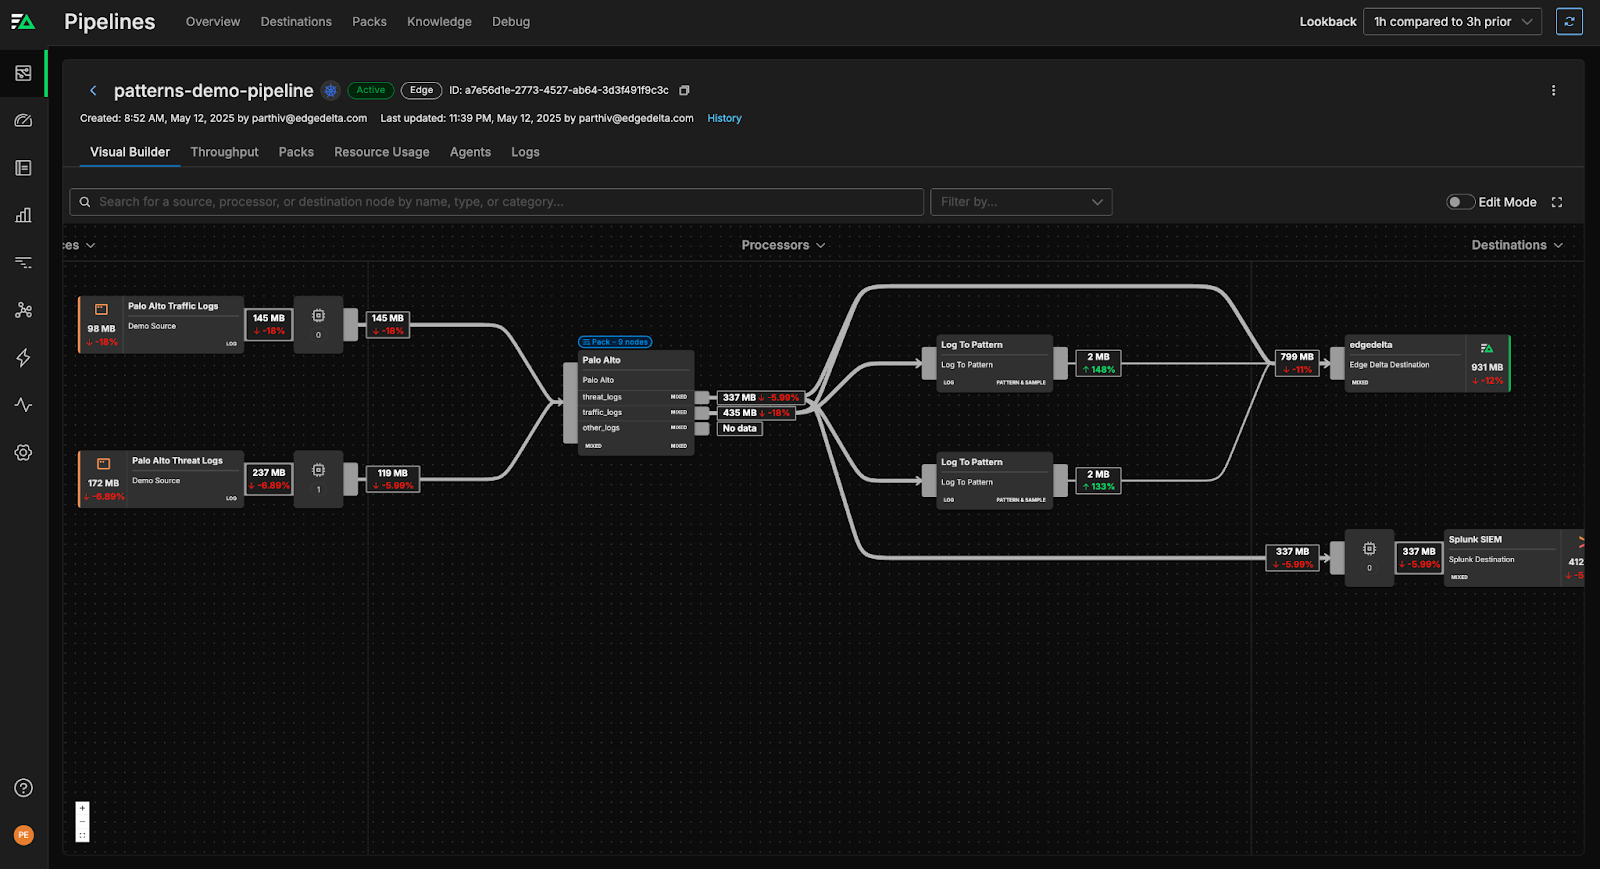
We can hop into the Patterns page in the Edge Delta UI to check out what the what the log patterns look like:
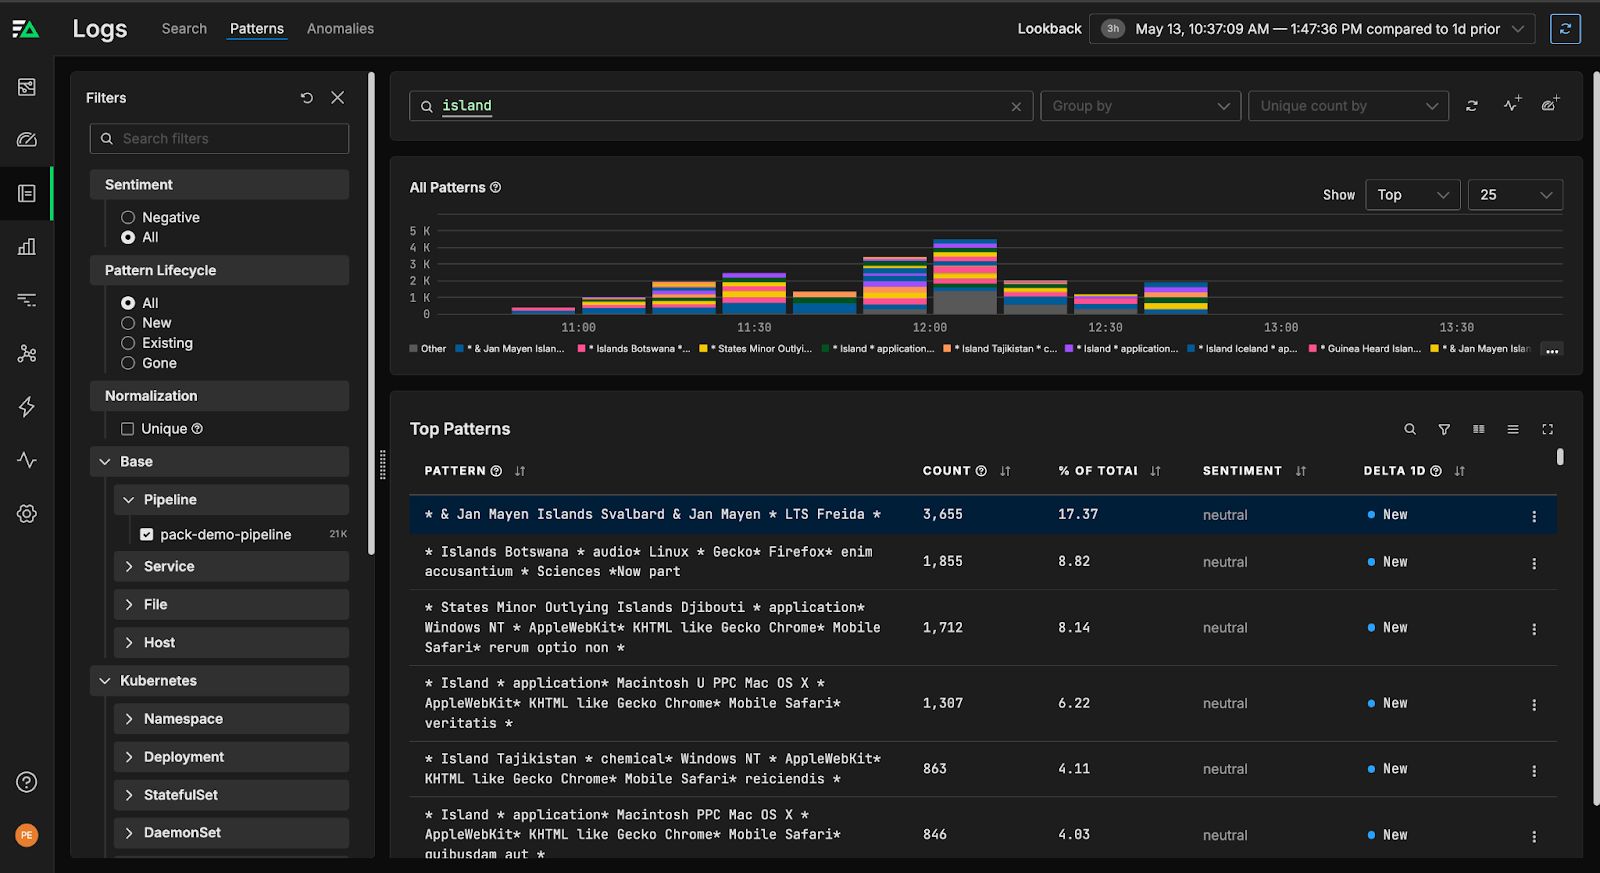
As you can see, there are a large number of logs that match the * & Jan Mayen Islands Svalbard & Jan Mayen * LTS Freida * pattern. Upon further investigation, it turns out that all traffic originating from these two Norwegian territories is non-sensitive and consistently benign, so we can exclude it from the pipeline.
With a single click of a button, we’re able to filter out the logs that are clustered into that pattern, reducing data ingestion into Splunk and Edge Delta by close to 90% in just a few minutes.
Getting Started with Edge Delta Patterns
Edge Delta’s Telemetry Pipelines give teams the control, flexibility, and visibility to intelligently reduce data volumes without sacrificing insight quality. Our Log to Pattern node enables teams to create patterns in real time as the data is created, without incurring any backend ingestion or retention costs.
Curious to learn more? Get hands-on in our free-to-use playground environment, or start a free trial.