Understanding and managing application performance is essential in IT operations and software development. However, a lack of standardization across telemetry data and vendor lock-in can create challenges for organizations of all sizes. OpenTelemetry responds to this challenge with a special set of APIs and tools for engineers.
OpenTelemetry allows developers and DevOps engineers to collect, process, and distribute telemetry data across their systems with unified standards. Whether you’re an expert or a beginner, this guide will help you understand what is OpenTelemetry and how it is used.
Key Takeaways:
- OpenTelemetry is an open-source, cloud-native observability framework that provides common standards for telemetry data collection and processing across vendors.
- OpenTelemetry was created to streamline telemetry aspects and drive open observability, reflecting community efforts to enhance software observability.
- The project covers essential concepts, including instrumentation, collection, Software Development Kits (SDKs), and data conventions.
- OpenTelemetry’s components enable efficient telemetry data collection, and its adoption enhances observability and benefits from community support for continuous development.
What Does OpenTelemetry Mean? Full Definition
OpenTelemetry (often referred to as “OTel”) is a vendor-agnostic observability framework for cloud-native software. It provides open-source APIs, libraries, and agents for collecting and processing distributed traces and metrics in application monitoring.
Born from merging two open-source project leaders in the industry—OpenCensus and OpenTracing—OpenTelemetry aims to standardize how telemetry data is generated and collected. It is indispensable for application performance management (APM) and observability strategies for its easy debugging of complicated software behaviors.
One of the main goals of OpenTelemetry is to enable observability for any software project and simplify the way telemetry data is collected and analyzed. More specifically, there is a lack of standardization across different programming languages and development frameworks. Additionally, each observability vendor enforces proprietary data schema, dictating how data is processed.
Because of these dynamics, there is a lack of consistency and interoperability across tools. As a byproduct, it can be complex to correlate data and troubleshoot issues, and teams often experience vendor lock-in. This democratization of telemetry aspires to improve the quality and overall reliability of the software while giving organizations the freedom to use whichever observability tool is best for their needs.
Fun Fact!
OpenTelemetry’s logo combines a magnifying glass and a telescope, representing its dual purpose of providing detailed insights into application behavior (like a magnifying glass) and offering a broader perspective on system performance (like a telescope).
Evolution from OpenTracing and OpenCensus
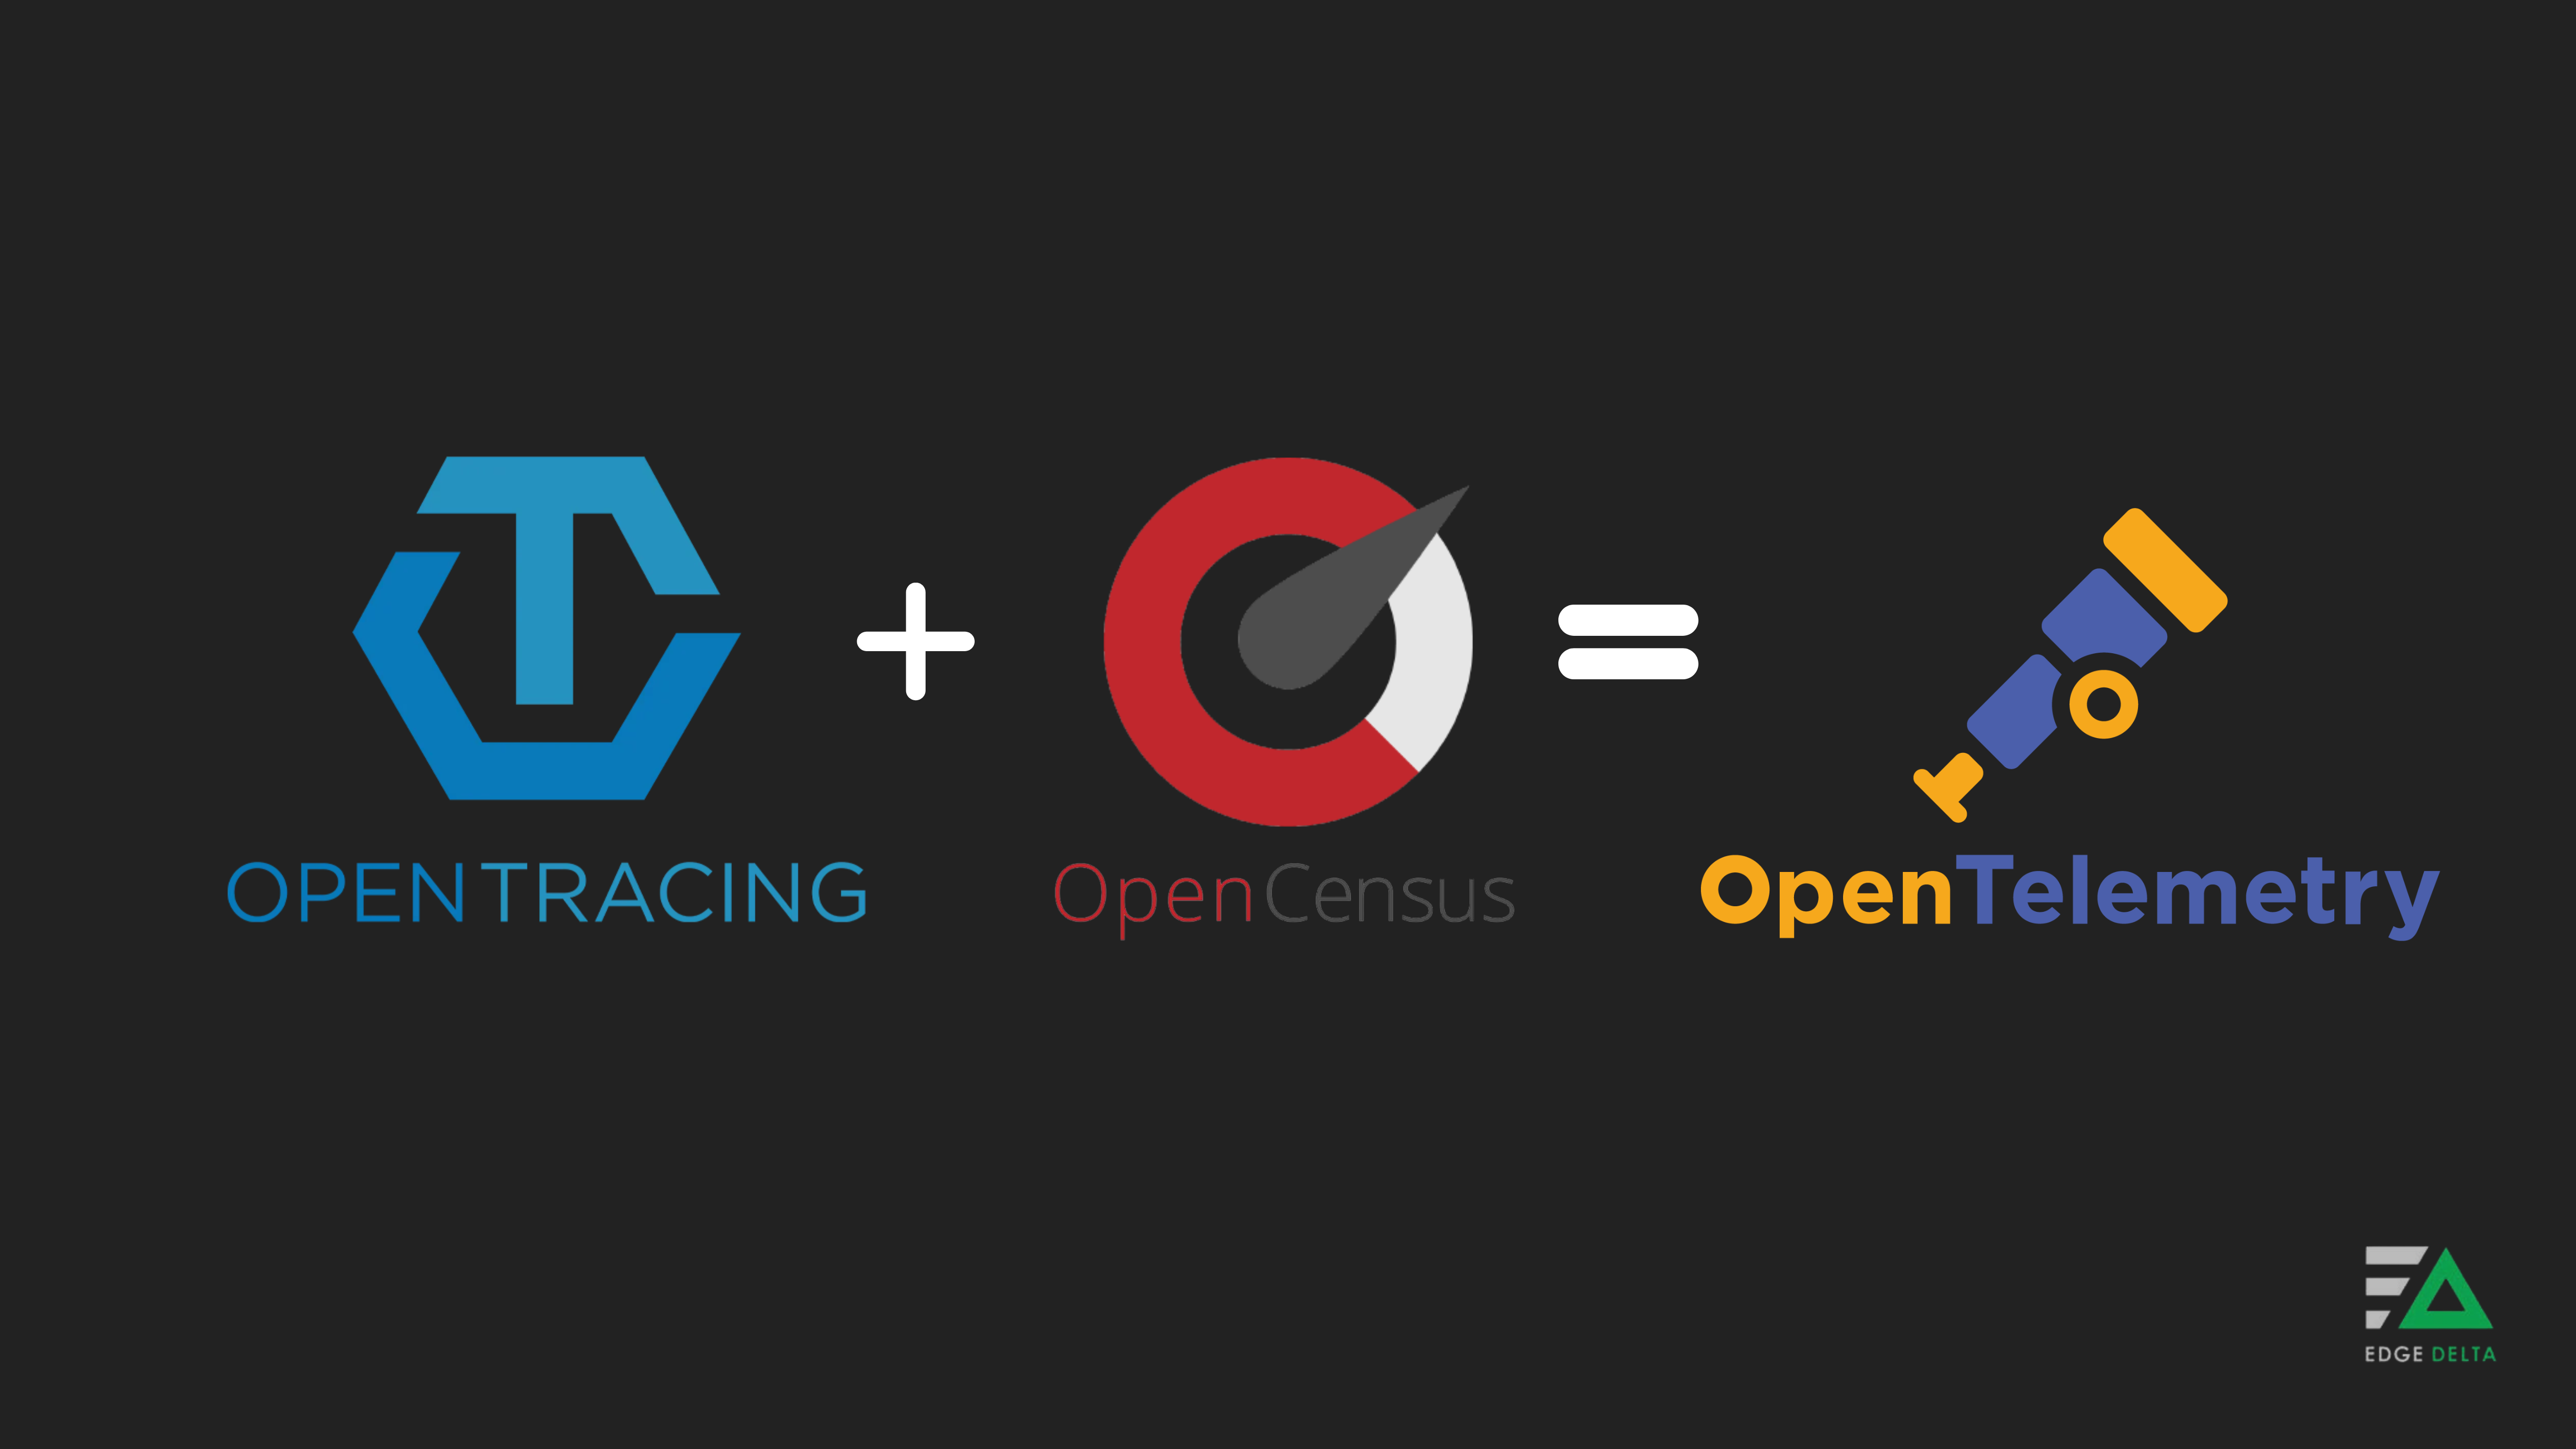
OpenTelemetry is rooted in OpenTracing and OpenCensus, projects that address distributed tracing and metrics collection. OpenTracing had developed a standardized API for tracing, while OpenCensus provided libraries for metrics and traces.
Merging these two projects to create OpenTelemetry results from the community’s desire to have a unified framework covering different telemetry aspects and streamlining instrumentation and collection processes for developers. This collaborative effort reflects the community’s commitment to improving observability in software development.
Core Concepts of OpenTelemetry
There are several concepts to understand when using OpenTelemetry, including the types of data it supports. These concepts are important for utilizing OTel to its full potential. Here are concepts you need to understand when using OTel:
- Trace: A trace represents a single operation or a sequence of operations in your application. It comprises segments or spans, generally representing the smallest logical unit of work in a trace. Traces visually show you the path of requests through your application, making it easy to find bottlenecks or failures in even the most complex distributed systems.
- Metrics: Metrics are numerical forms of data measured over intervals of time. They help determine the performance and health of an application that spans request count, error rates, and the utilization of resources in the system.
- Logs: A log event is a record of an action, occurrence, or state within a system or application. Log events are generated by software applications, operating systems, network devices, and other components of an IT infrastructure. These events typically contain information such as timestamps, severity levels, and contextual details about the event.
- Context Propagation: Context propagation refers to the mechanism where OpenTelemetry links traces across process boundaries to ensure a cohesive and uninterrupted trace from beginning to end. This mechanism involves transferring identifiers and other critical information across services. Context propagation is essential in distributed tracing because it ensures that the continuity of the trace is maintained, especially in complicated architectures like microservices.
- Instrumentation: Instrumentation refers to integrating OpenTelemetry into your application to emit telemetry data. This can be achieved automatically, by instrumenting common frameworks and libraries out of the box or modifying the application’s code to produce custom telemetry data. Instrumentation determines the quantity and quality of data collected, which is an integral part of utilizing OTel.
Understanding the main components of OpenTelemetry will allow you to tap its advantage for the proper collection, processing, and exporting of telemetry data. These data are crucial for visualizing application behavior and analyzing performance data.
️ Note:
OpenTelemetry’s components, including the API, SDK, exporters, collectors, and protocols, work synergistically to facilitate seamless telemetry data collection, processing, and exportation, offering developers a comprehensive observability solution for their applications.
Key Components of OpenTelemetry: Functions and Benefits
OTel comprises several components that play an important role in observability. These components efficiently collect, process, and export telemetry data. These components include:
- APIs and SDKs: OpenTelemetry provides APIs and SDKs to help users instrument their applications to emit telemetry in OTel-native formats. OpenTelemetry supports automatic instrumentation for Kubernetes and manual instrumentation. It supports 11 common languages, including C++, C#/.NET, Go, Python, and Ruby.
- Exporters: Exporters send telemetry data from your application to a backend observability platform. Many exporters provided by OpenTelemetry allow integration with almost any monitoring tool or service.
- Collector: The OpenTelemetry Collector is a stand-alone service that can receive, process, and export telemetry data. It acts as an aggregation point for telemetry data and supports the ability to batch, filter, and enrich all the incoming data streams.
- Protocols: OpenTelemetry supports transmitting telemetry data via gRPC, HTTP/JSON, and a specialized protocol called OTLP (OpenTelemetry Protocol). OTLP is intended to deliver telemetry data efficiently.
Remember!
OpenTelemetry’s core concepts—traces, metrics, context propagation, and instrumentation—are the building blocks that enable comprehensive telemetry data collection, visualization, and analysis in your applications, ensuring seamless observability across complex distributed systems.
What are the Benefits of Using Opentelemetry?
Adopting OpenTelemetry can give businesses many advantages in improving their observability and operational efficiency. Some of these benefits include:
| Benefit | Description |
|---|---|
| Enhanced Observability | Provides detailed insights into application behavior and performance. Enables real-time monitoring, bottleneck identification, and impact analysis of changes. |
| Simplified Monitoring and Troubleshooting | Standardizes telemetry data collection and analysis. Reduces complexity and overhead associated with integrating multiple monitoring tools. |
| Cross-Language Support | Ensures consistent observability practices across diverse technology stacks. Facilitates uniform data collection and analysis methodologies in polyglot environments. |
| Vendor Agnosticism | Enables a consistent data schema across observability providers, making it easier to migrate on and off tooling. |
| Community and Support | Benefits from strong community support and active development. Offers a wealth of resources, documentation, and tools for users. Evolves continuously to meet the evolving needs of software development. |
Implementing OpenTelemetry in Your Projects
Adding OpenTelemetry integration is easy for a given project: set up the SDK, instrument your application, and configure data export to the backend of your choice. Here’s how it’s done:
Basic Setup and Configuration
- Select the OpenTelemetry SDK for your application’s programming language.
- The SDK is available in many languages—Java, Python, Go, and others—for wide support.
- Follow installation instructions on the chosen SDK. It usually involves installing a library dependency on the project.
- Configure settings such as the service name and environment to initialize the SDK in your application.
Instrumenting an Application
- Use OpenTelemetry’s auto-instrumentation agents on your libraries and frameworks. This means minimal code changes for you and, in most cases, the easiest way to begin collecting your telemetry data.
- Manually instrument your code to add spans capturing traces around the operations you intend to monitor with custom telemetry or for specific use cases.
- In addition to traces, you can collect custom metrics relevant to your application’s performance and usage patterns.
Exporting Data to Analysis Tools
- Choose and configure exporters to send your telemetry data to your chosen analysis tool or observability platform. For example, send your metrics to Prometheus or trace your spans with Jaeger.
- Test your data flow to ensure telemetry data is properly collected and visible in your backend tool. You may verify the setup by triggering operations in your application and checking the flow of traces and metrics.
- Iterate and improve according to your early observations. Refine your instrumentation and SDK configuration to capture more relevant data or reduce overhead.
OpenTelemetry provides a solid foundation for managing and understanding your applications to help ensure high performance and reliability. This foundation is also why OTel is chosen by many businesses to help them with observability.
Fun Fact!
The first line of code committed to the OpenTelemetry repository was “Initial commit from OpenCensus,” marking the beginning of a transformative journey merging OpenCensus and OpenTracing into a unified observability solution.
What is Opentelemetry Used For? Application + Use Cases
OpenTelemetry is a leader in application observability solutions, monitoring the health and performance of software systems. By standardizing how telemetry data, including traces, metrics, and logs, are collected and analyzed, the platform gives developers and operators deep insights into their applications, independent of being locked down to a particular vendor.
Here are some of the most important use cases for OpenTelemetry:
Distributed Tracing and Application Performance Monitoring (APM)
One of the key cornerstones of OpenTelemetry is Distributed Tracing, which shines in microservices architecture within an organization. OpenTelemetry works relentlessly to track the travel of requests, which usually flow through different services. This visibility gives way for the organization to diagnose issues and optimize performance. Users can generate APM charts from trace data to give users immediate access to performance indicators such as latency, request, and error rates.
Metrics and Infrastructure Monitoring
OpenTelemetry provides its customers with monitoring metrics features. OpenTelemetry Collector facilitates the collection of metrics from infrastructure to database performance. With such wide-ranging monitoring, teams can gauge the pulse of overall system health and fix any emerging issues long before they become a problem.
Logging and Event Collection
Another important use case for OpenTelemetry involves logging and event collection. It helps to provide structured logs correlated with other telemetry signals using the SDK offered in several programming languages. This helps strengthen the debugging process through a cohesive display of the state and behavior of an application and the incidents within it.
OpenTelemetry provides a solid and flexible basis for complete observability for modern software applications. Its mainstay toward standardization, its open-source nature, and community support are indispensable for the developer and organizational teams who want to bring about differences in their application’s performance and software reliability.
Wrapping Up
OpenTelemetry is an essential observability tool with an open-source, vendor-neutral framework that serves all modern development needs. Its full life cycle of telemetry data collection, processing, and exportation simplifies the complications of monitoring and troubleshooting applications.
Whether you are just getting started to bring reliability to your application or an expert seeking to standardize practices across observability, OpenTelemetry brings the tooling and community to make you successful.
FAQs About OpenTelemetry
What are the benefits of using OpenTelemetry?
OpenTelemetry offers standardized monitoring and observability, simplifying instrumentation and integration with various tools. It supports multiple languages and platforms, ensuring consistency across the stack. With distributed tracing and metrics collection, OpenTelemetry enables comprehensive insights into system performance, error diagnosis, and optimization.
How does OpenTelemetry work?
OpenTelemetry works by instrumenting code to generate telemetry data at various points within an application’s execution. Developers can do this instrumentation manually or automatically using OpenTelemetry APIs through integrations with frameworks and libraries. OpenTelemetry supports various export formats and integrates with observability platforms like Prometheus, Jaeger, and Grafana, enabling developers to gain insights into the performance and behavior of their applicationsa