Background
Linux is an open-source operating system that uses binary format to store logs for things like the system and kernel. A binary format will impact performance, efficiency, reliability, and consistency. Since humans do not easily decipher binary formats, data stored in this format is more secure. However, this poses a challenge when searching these logs for relevant data, as one generally has to be on the system to view the human-readable format. After gaining remote access to a system, most system administrators mine data from binary logs with a tool like journalctl.
journalctl is a command-line utility used for querying and displaying logs collected by systemd-journald, the logging service of the systemd system and service manager in Linux. It allows users to view and analyze logs from various sources on the system, including the kernel, system services, and applications.
The problem with getting binary Linux logs out of your system
journalctl is a command line tool that requires remote access to invoke and view in a non-binary format. Getting this data in a non-binary format is problematic with modern log management systems that generally tail raw log files and send them to a processing engine. journalctl stores logs from systemd-journald in a binary format optimized for efficient querying and storage. Though this is great for the reasons mentioned earlier, it makes them not human-readable. journalctl logs can be a great resource when troubleshooting many things on a system, including kubelet and containerd logs. So, getting the logs out of your system for analysis or advanced calculations like pattern and anomaly detection with Edge Delta is a common problem.
A scalable way to pull logs from Linux systems
Logs stored in systemd-journald are powerful for troubleshooting, debugging, and triaging issues, especially when used with other logs, metrics, and traces. These logs might be for services or applications running on the same system or dependent and/or interdependent systems. By capturing relevant logs from systemd-journald with Edge Delta Telemetry Pipelines and leveraging our pipeline technology to transform, detect patterns & anomalies, create metrics, and route logs to downstream destinations, presenting the correct data to the right teams.
With the addition of Edge Delta’s Pattern and Anomaly Detection, teams do not need to separate the signal from the noise. Edge Delta has already bubbled up the actionable information. Here is how to set it up:
- Create a free Edge Delta account and create a fleet: https://docs.edgedelta.com/quick-start/
- Setup: https://docs.edgedelta.com/system-requirements/
- Install Edge Delta: https://docs.edgedelta.com/install-linux/
- Create and configure an exec input node to get logs from journalctl
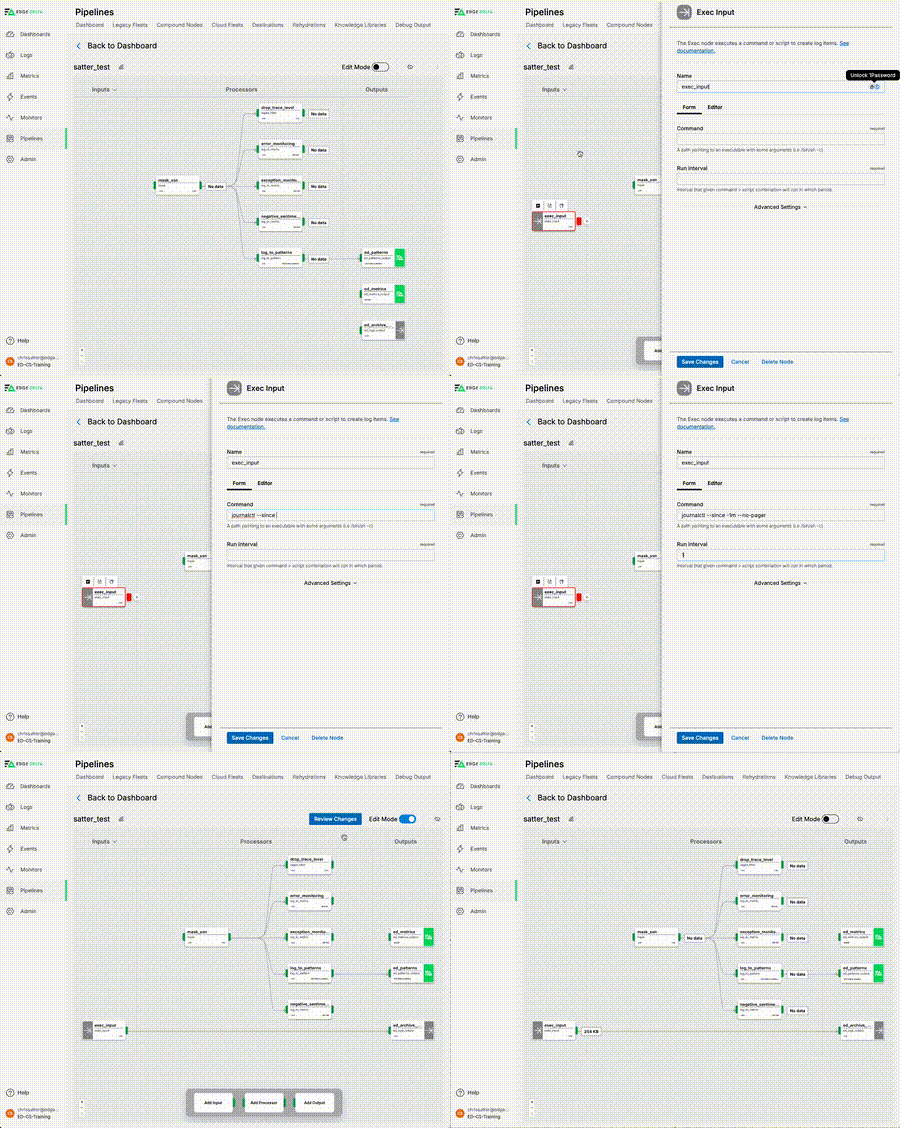
After installing Edge Delta on a Linux host, log in to the Edge Delta UI at https://app.edgedelta.com/ and edit your pipeline. Create an “Exec Input” Input Node with the command parameters to get the data you are looking for.
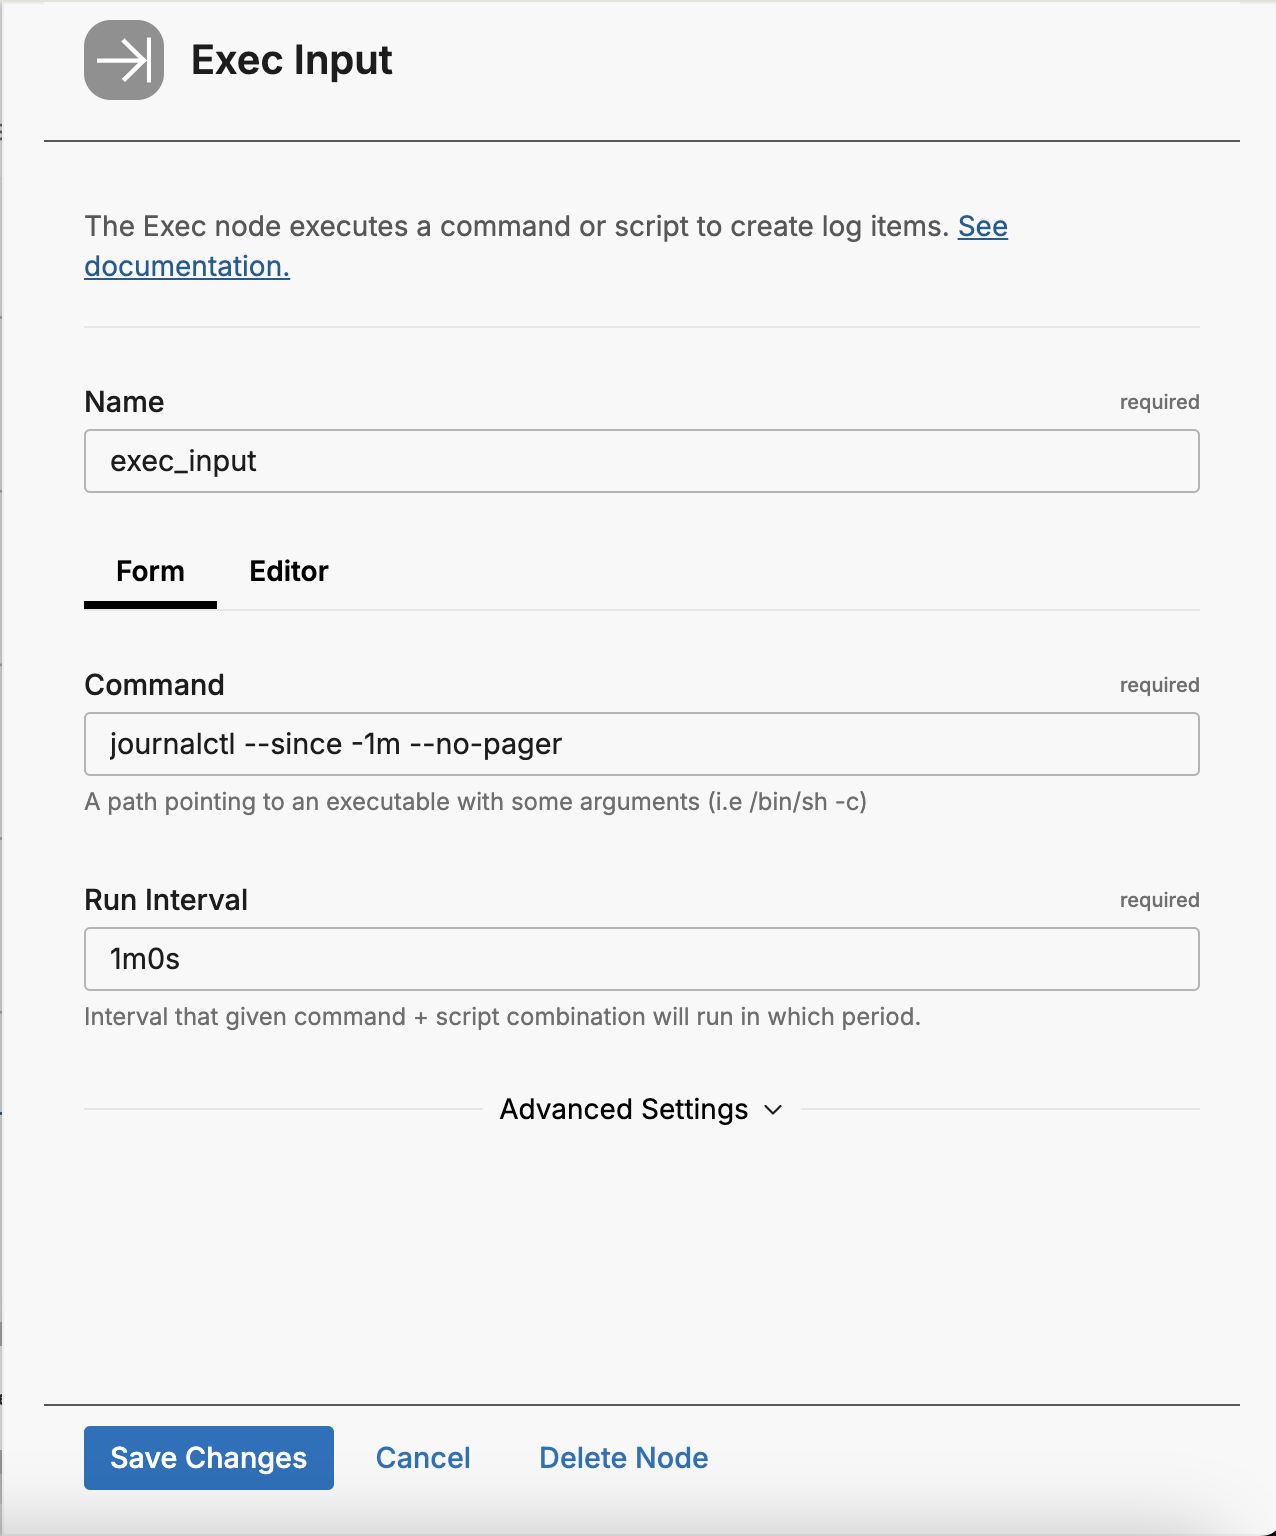
Create an “Exec Input” node using the inputs button at the bottom of the page.
Name: exec_input
Command: journalctl –since -1m –no-pager
Run Interval: 1m0s
Now you can get creative and/or efficient and filter for specific logs. For instance:
- To get logs for a specific service, use the “-u” switch in the Command:

- Or, to get only logs with the priority of “Emergency,” use the “-p” switch:

- And, to get logs with specific keyword(s), use the “-g”:
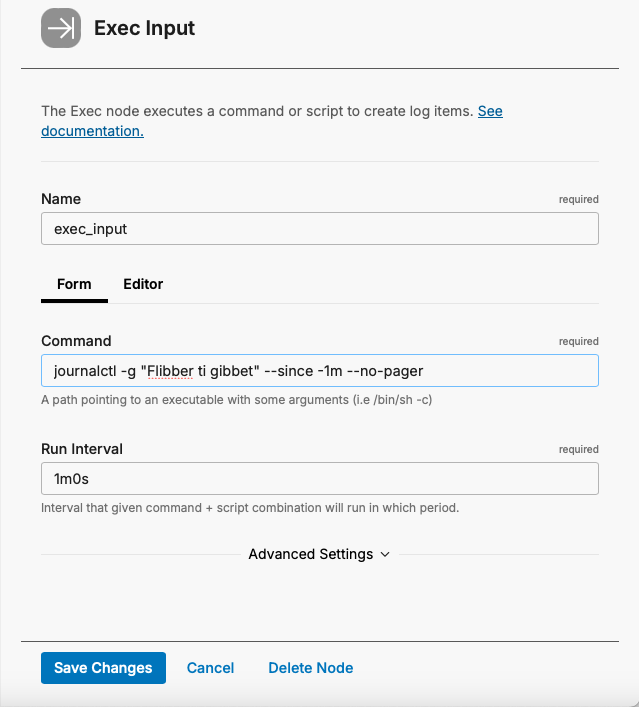
- For other options, please refer to the
journalctlman page: https://man7.org/linux/man-pages/man1/journalctl.1.html.
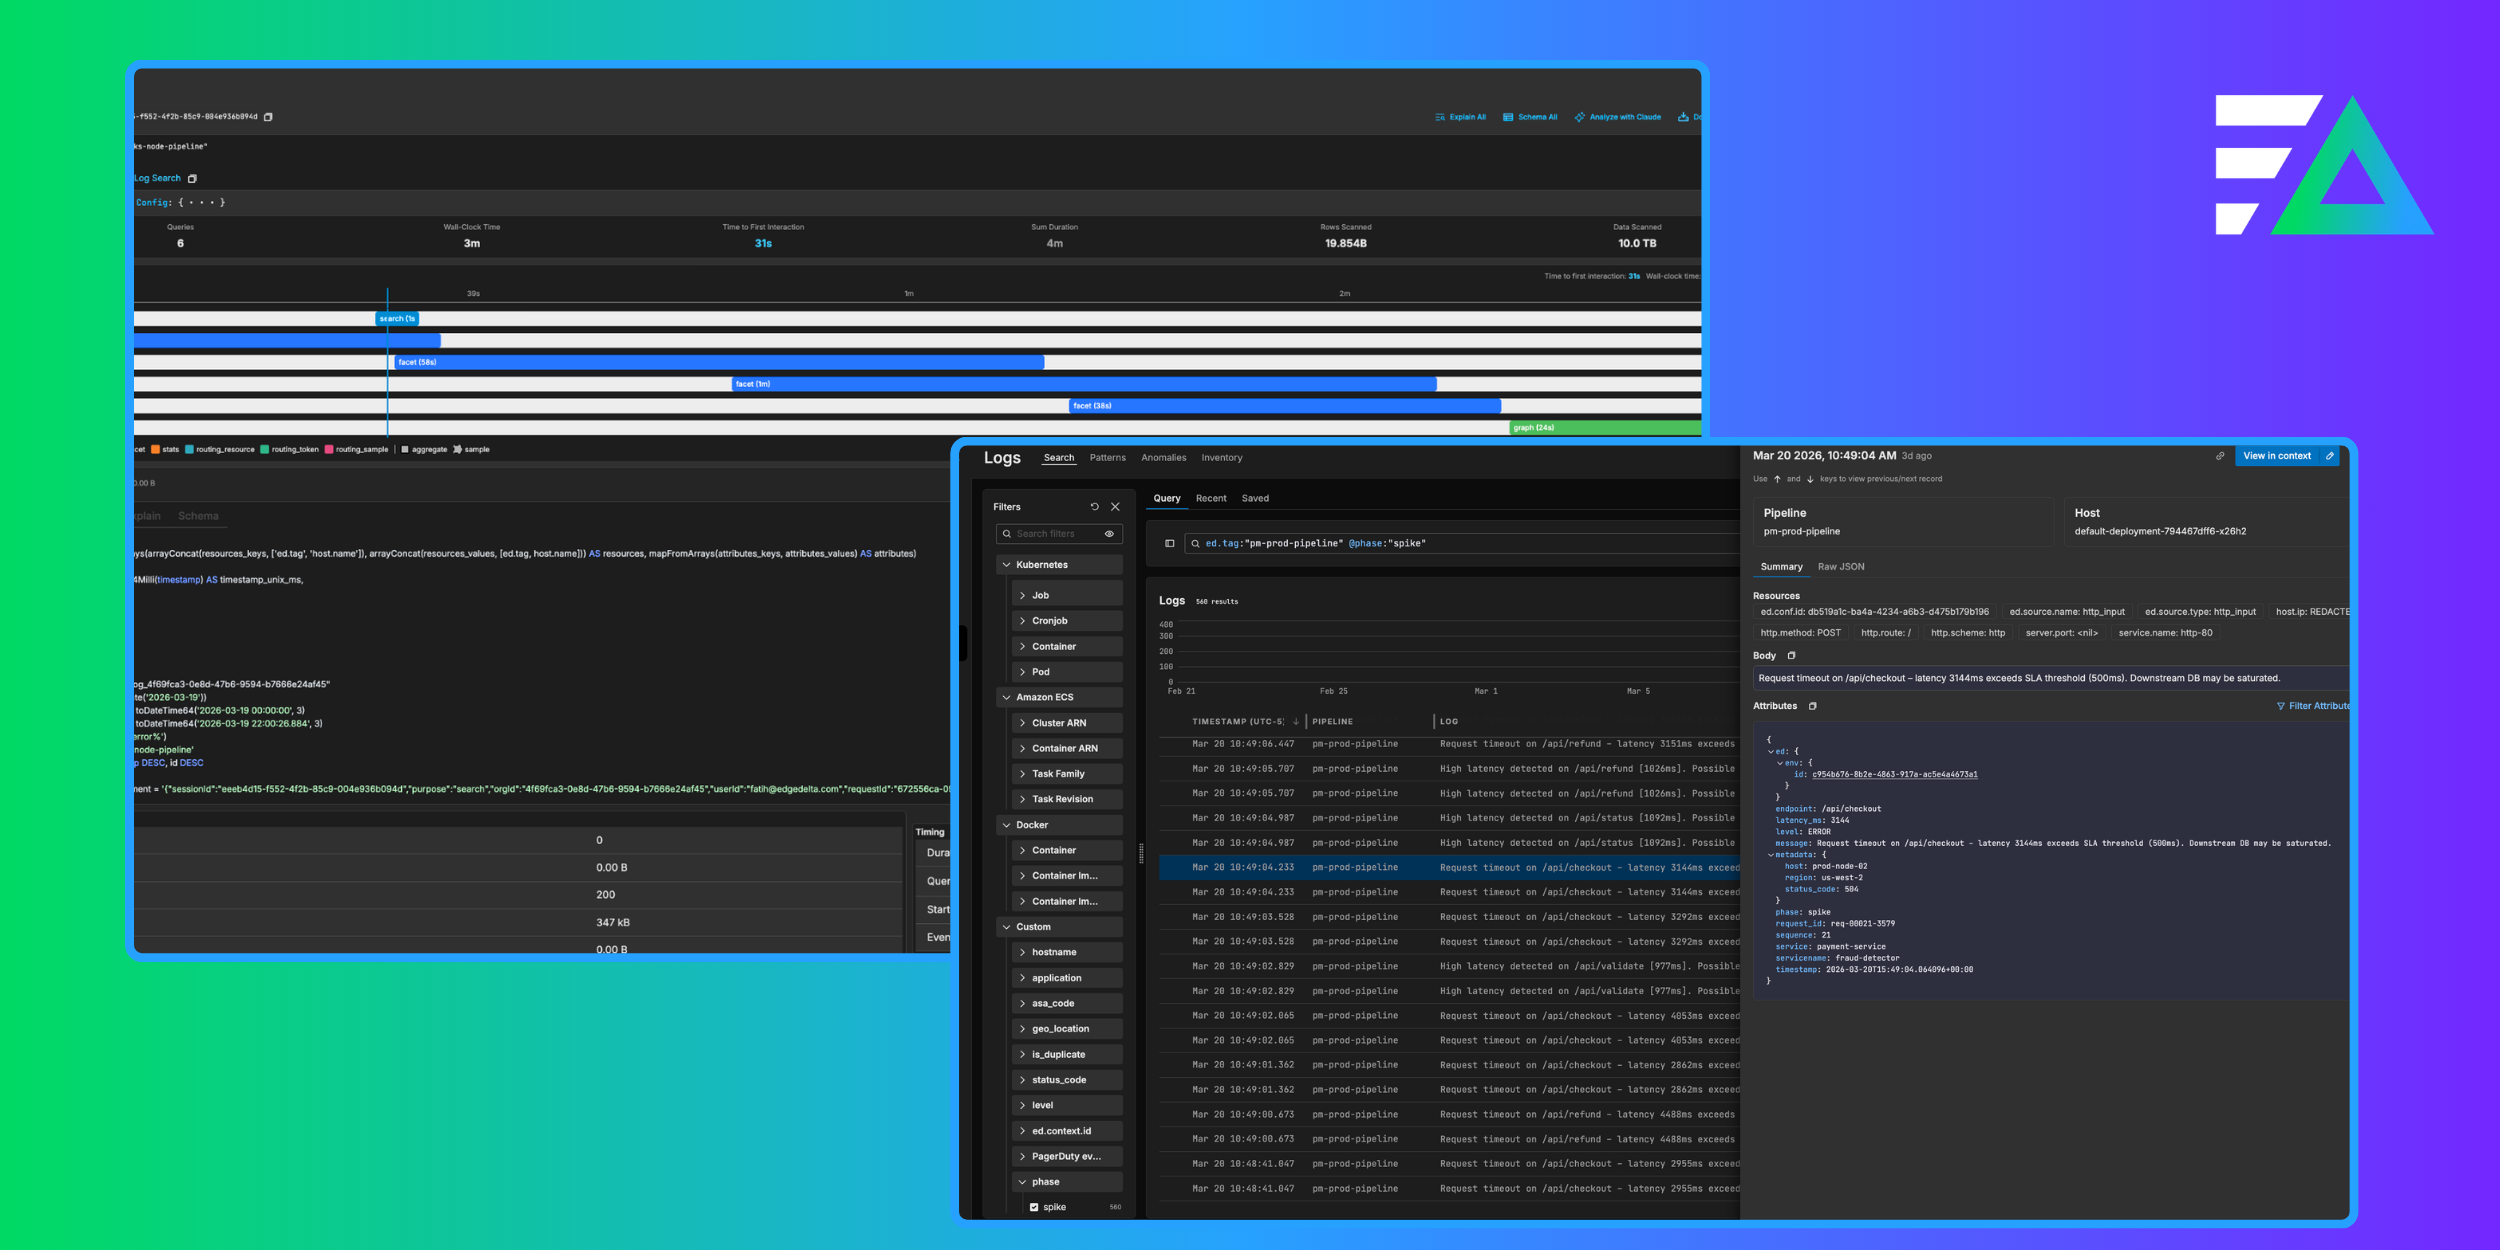
Once you have saved your Exec Input node, attach it to the ed_logs output node and apply the configuration. The changes will now apply to your agent(s) and you will be able to see logs in Edge Delta Log Search:
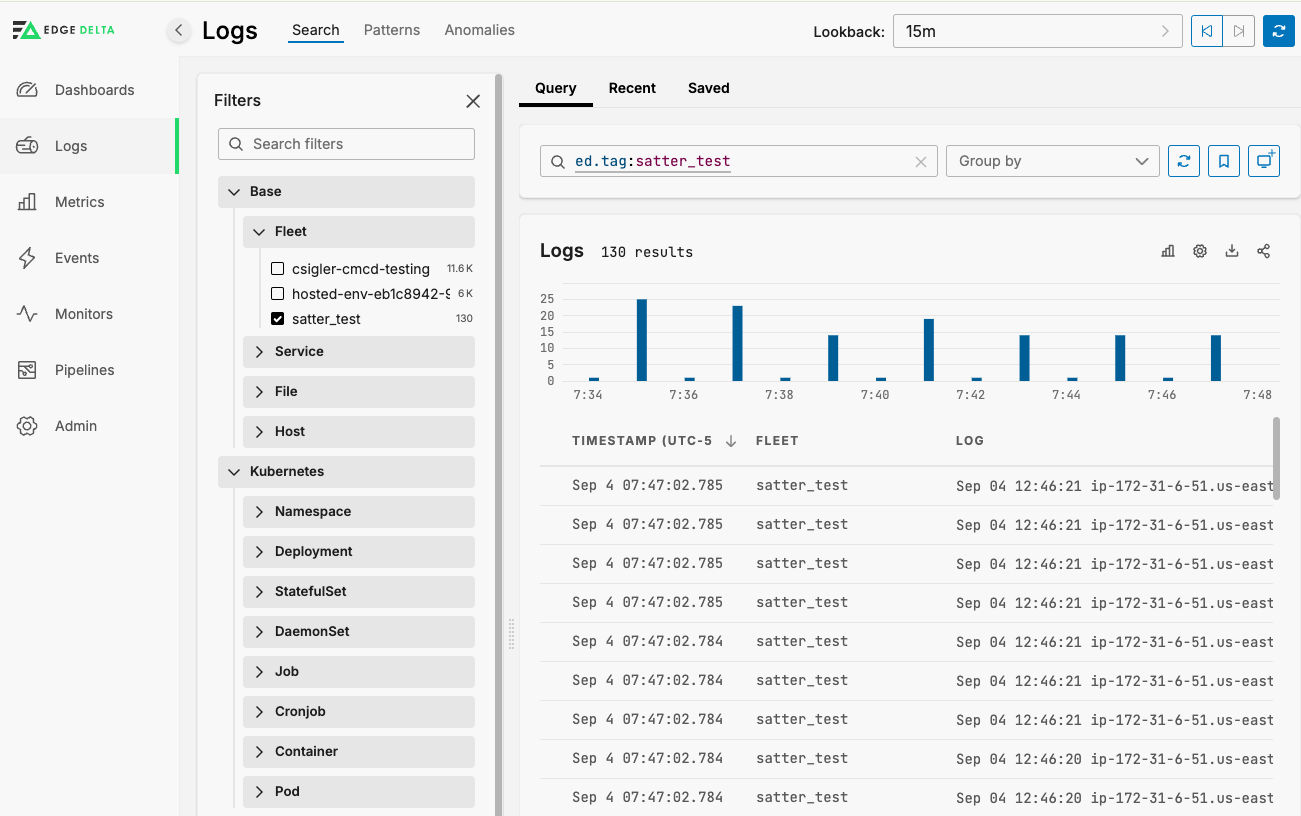
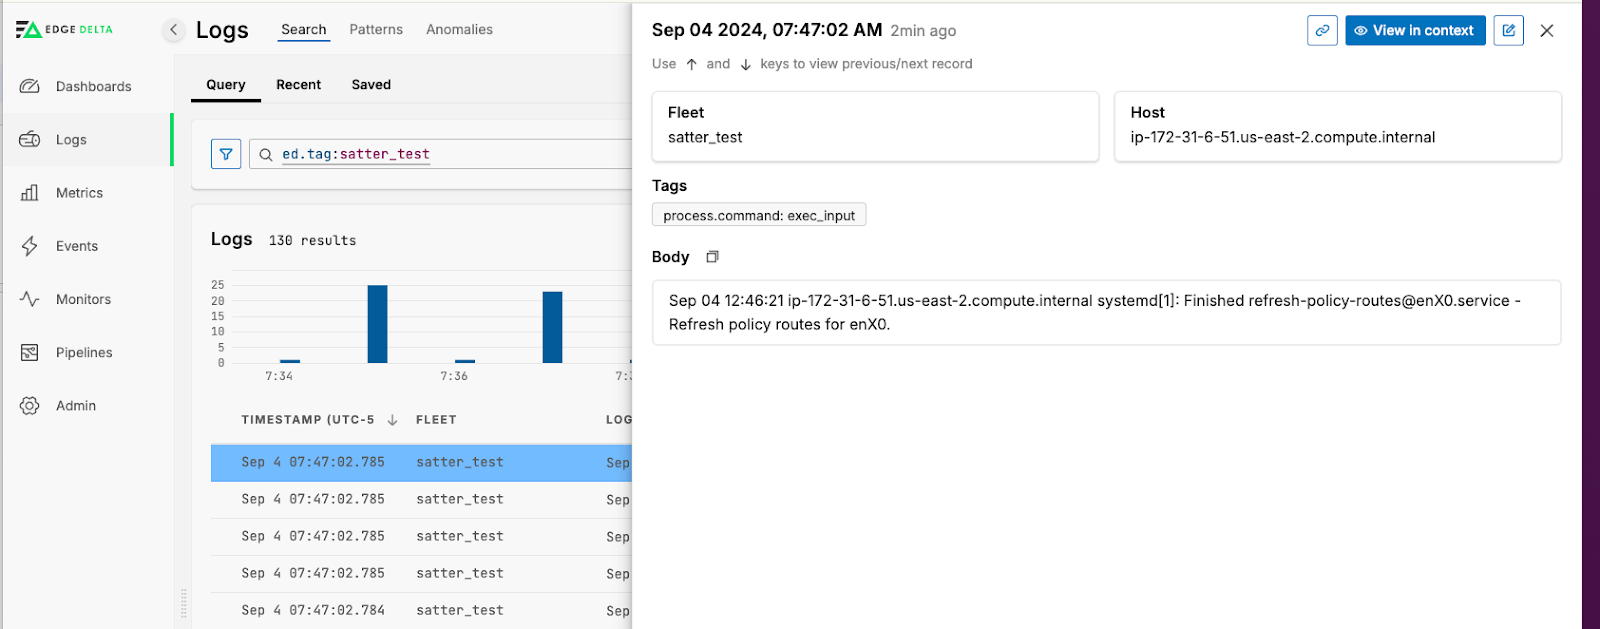
Next Steps
-
Send
journalctldata from the Exec Input to a Log to Pattern Node -
Inspect Anomaly Detection and configure alerts to inform you when things are abnormal.
Final Thoughts
Getting data from Linux systems stored in a binary format can be challenging. However, the process is simple and scalable when you’re pulling that data into a system like Edge Delta — which enables central mining of data for troubleshooting, debugging, and triage of issues.
Though the above details how the Edge Delta Execs Input Node gathers data using the journalctl utility, this method can also be adapted to extract all sorts of data from systems and then ship it to be leveraged within the Edge Delta platform.
Want to play around with Telemetry Pipelines yourself? Check out Edge Delta’s free-to-join playground, or for a deeper dive, sign up for a free trial!


