

Many modern Kubernetes environments generate petabytes of log, metric, trace, and event data every day. Without a scalable, efficient telemetry management solution, observability and security teams struggle to surface insights and identify performance issues when they occur.
Edge Delta’s Telemetry Pipelines are purpose-built for Kubernetes’ dynamic and ephemeral nature. They deploy seamlessly into any Kubernetes cluster and perform pre-index data processing — including standardization, enrichment, and patternization — to streamline analysis and filter noise in real time at enterprise scale.
Edge Delta’s new Coordinator and Gateway Pipelines extend our support for Kubernetes environments by adding a cluster-wide control plane and aggregation layer to our deployment model. This approach enables progressive deployment of observability infrastructure, improves agent-to-backend live communication, and introduces advanced processing capabilities at the cluster level.
In this post, we’ll dive into what Coordinator and Gateway Pipelines are, why they matter, and how they help DevOps and SRE teams control data volumes and reduce their MTTR.
What Are Coordinator and Gateway Pipelines?
Before exploring our two new pipeline types, let’s first go over Edge Delta’s baseline Kubernetes deployment model.
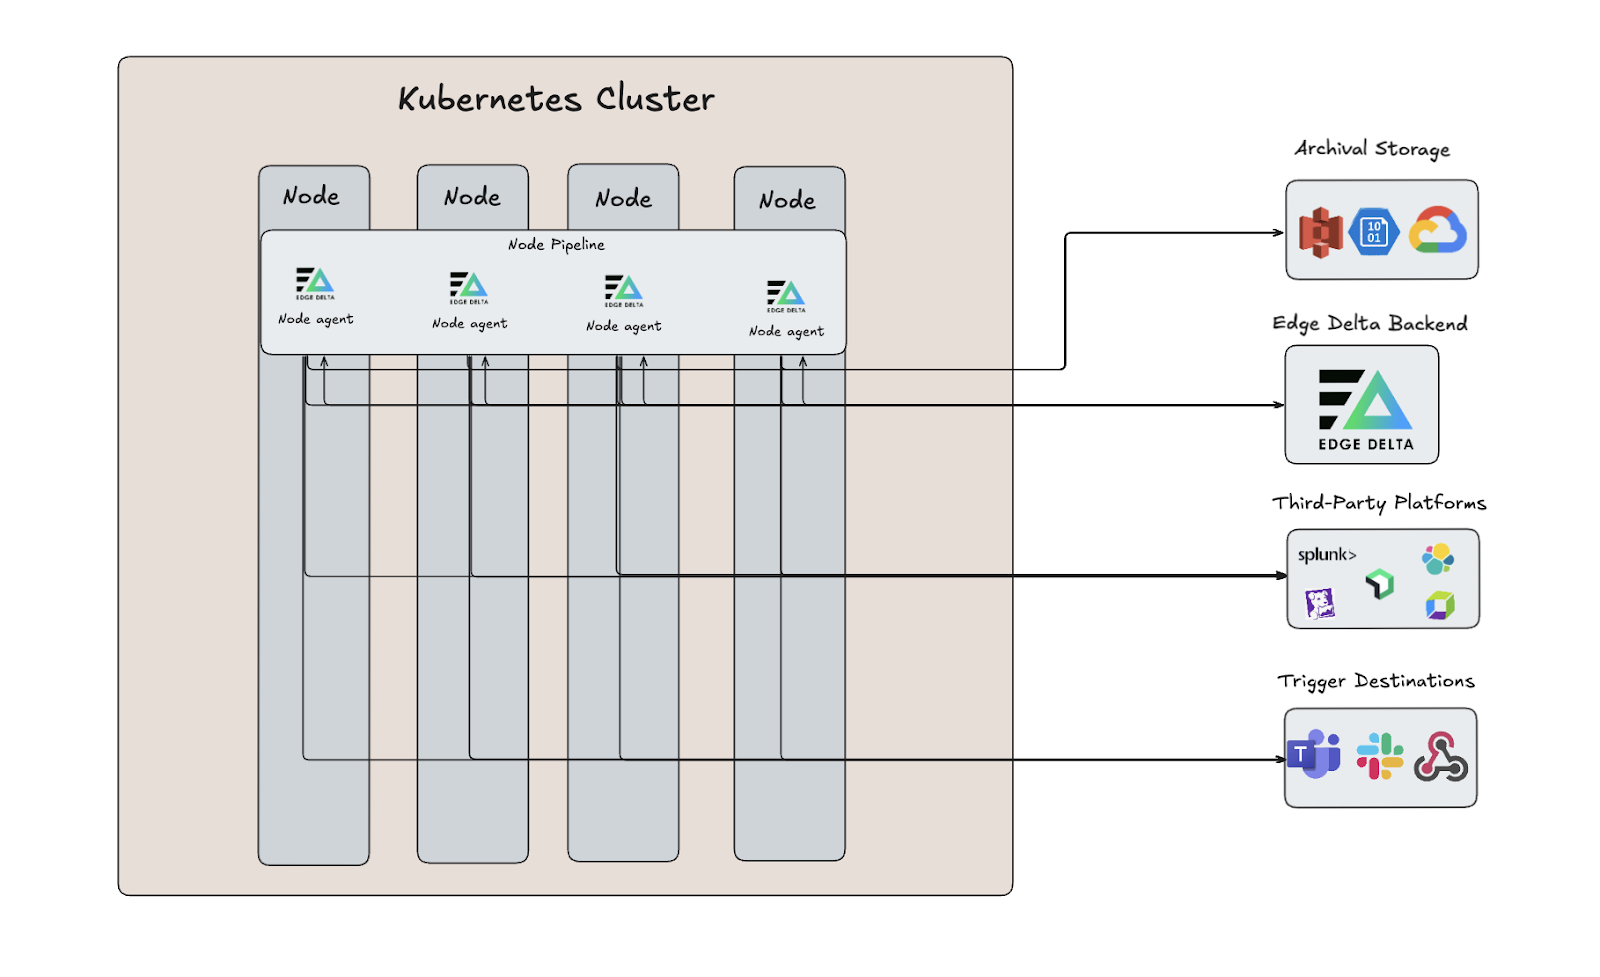
Our Node Pipeline serves as the foundation for the collection, processing, and routing of Kubernetes telemetry data. It consists of Edge Delta agents running as a DaemonSet within a Kubernetes cluster. These agents compress and filter data, extract key insights, and roll up logs into metrics at the node level. By processing data at the source, Node Pipelines reduce the amount of data that is shipped to expensive downstream destinations while preserving the data that’s critical for monitoring and analysis.
The Gateway Pipeline
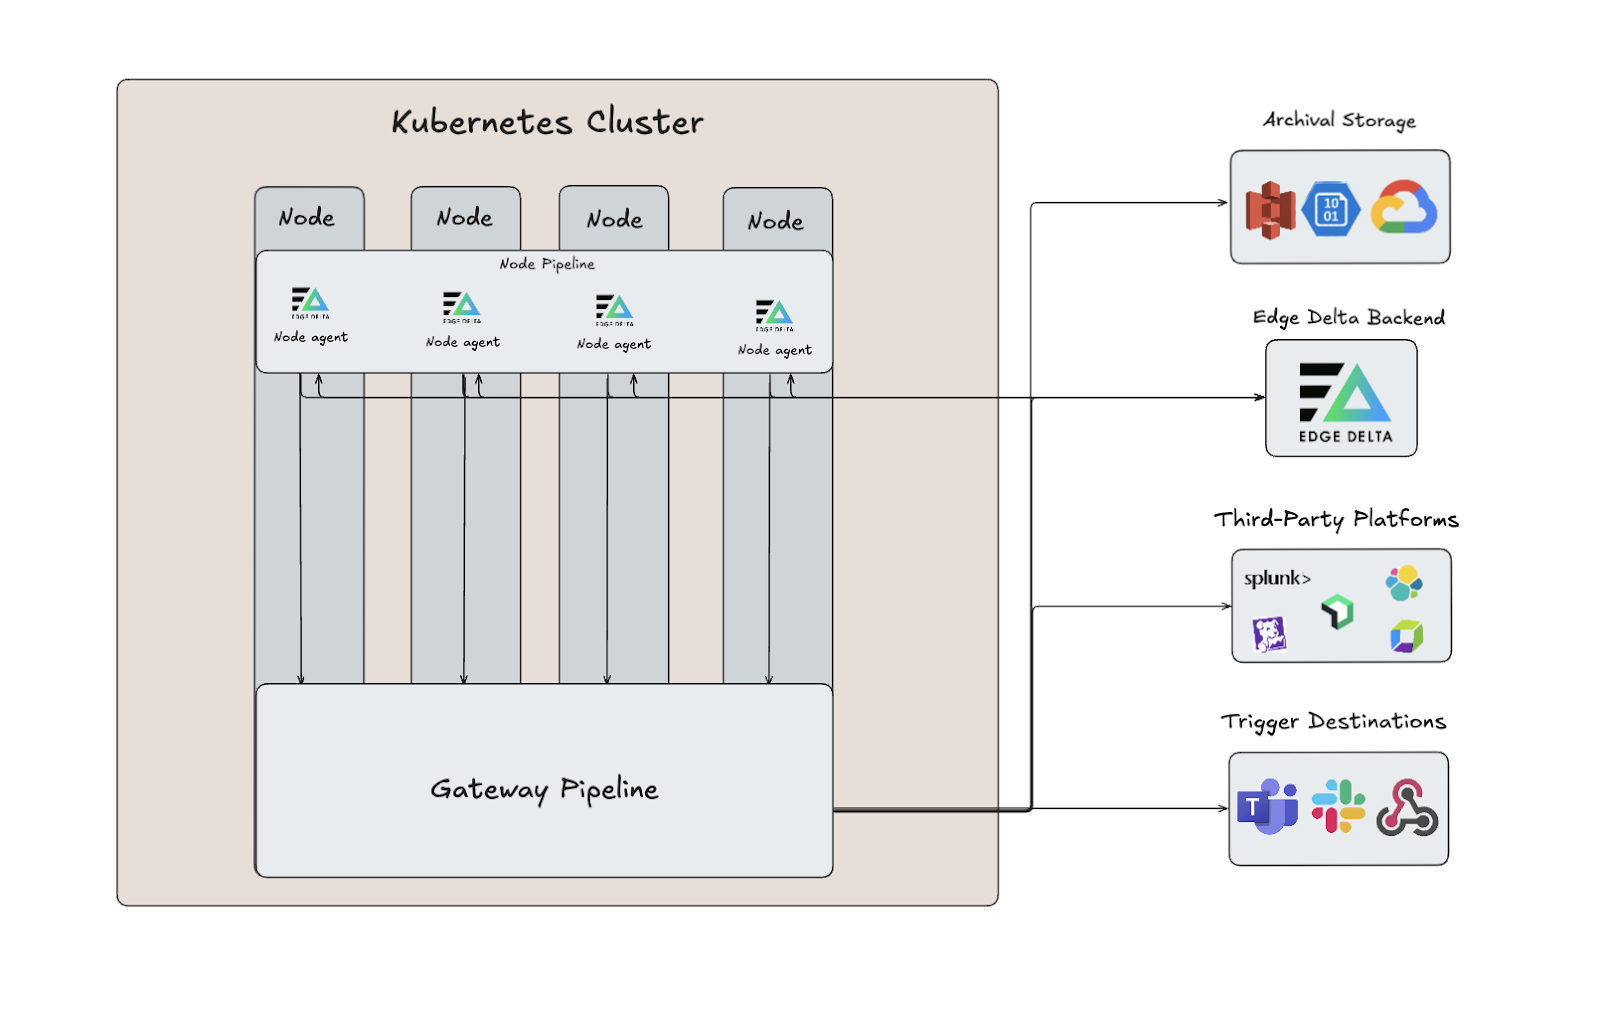
Edge Delta’s new Gateway Pipeline builds on this model by acting as the central aggregation and processing layer. It runs as a ReplicaSet and sits between your Node Pipeline agents and backend destinations, unifying node-level data streams and enabling cluster-wide visibility through log deduplication, multi-node metric aggregations, tail-based sampling for traces, and more.
For example, teams that use Gateway Pipelines can compute an accurate P95 latency or total error rate for a service that spans many nodes by aggregating the relevant node-level metrics at the Gateway level — before feeding that data into their monitors and dashboards downstream.
Gateway Pipelines are linked to Node Pipelines via special input/output nodes (more on these nodes later), and support for other external sources is coming soon. Teams that require advanced scalability or granular data type segregation can run multiple Gateway Pipelines, but one deployment is typically sufficient.
The Coordinator Pipeline
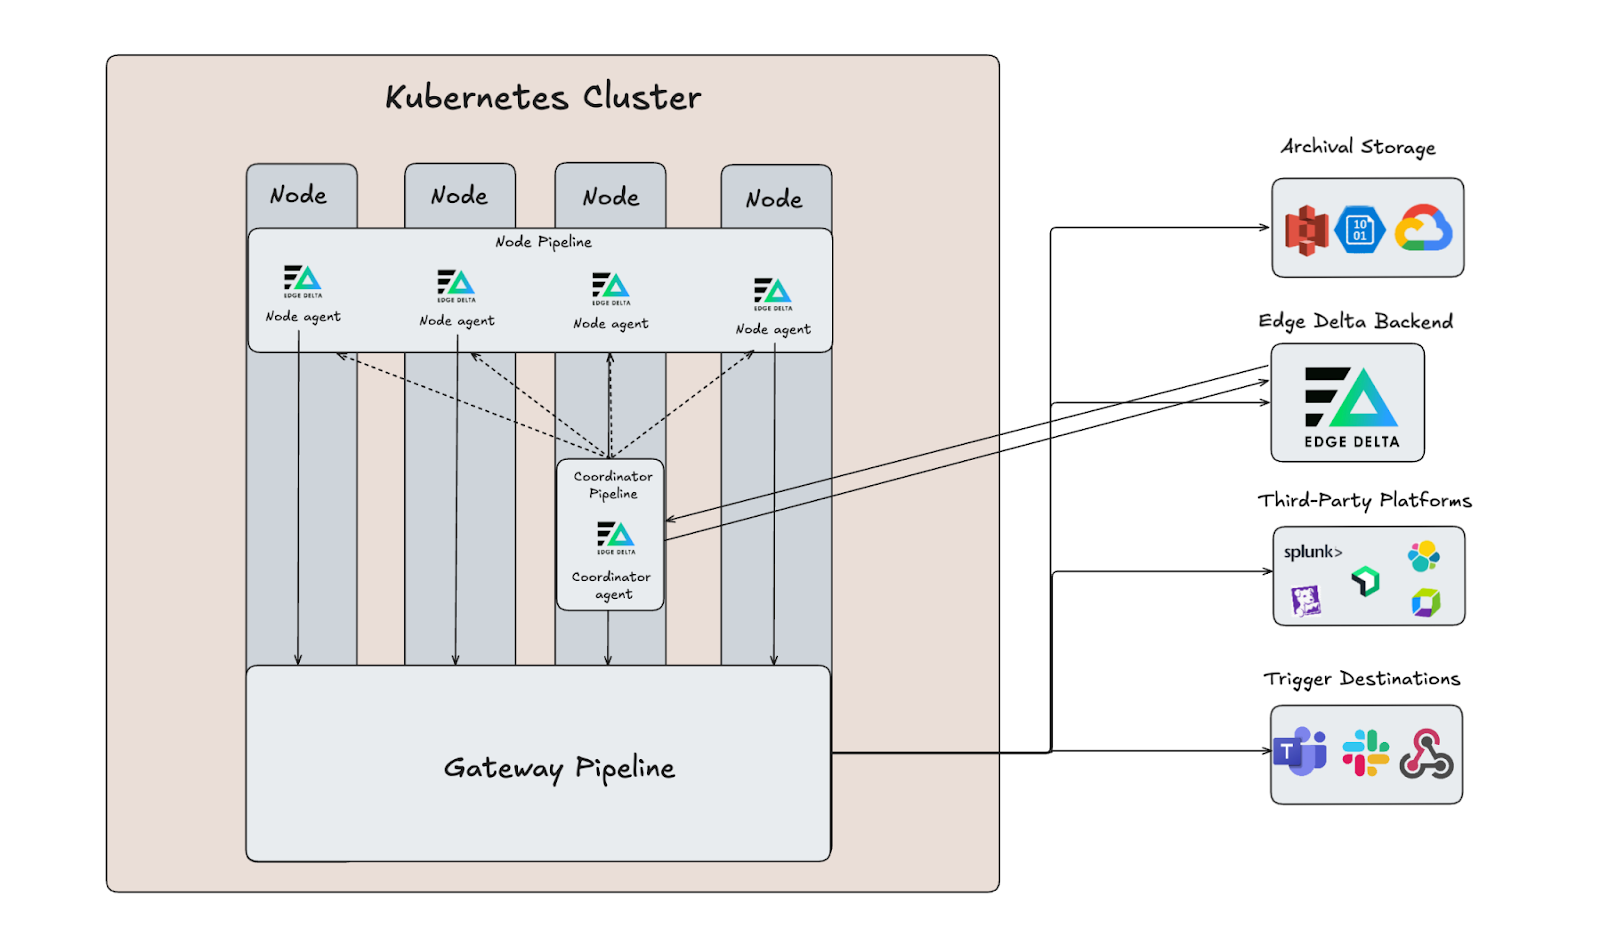
Edge Delta’s Coordinator Pipeline serves as the new control plane layer in our Kubernetes deployment architecture. It runs as a single agent per Kubernetes cluster in the same namespace as your node-level agents, minimizing redundant operations by coordinating work between agents and handling all agent-to-cloud backend communication. With this setup, individual agents don’t all have to connect to the backend independently — they can interface with it through the Coordinator Pipeline to more efficiently retrieve config updates and instructions.
In addition to automatically discovering and managing all Edge Delta nodes in the cluster, the Coordinator Pipeline also uses the Kubernetes API to automatically detect agent changes, such as new pods or nodes running Edge Delta on them.
In traditional observability setups, teams might push all data from every node to a central system, which can overwhelm networks and backends, or perform heavy filtering at each node in isolation, which leads to lost context. Edge Delta’s multi-tier pipeline architecture (Node → Gateway → Backend, with a Coordinator managing the Node tier) offers a balanced approach. The Node Pipeline continues to provide localized, real-time processing, while the Gateway Pipeline aggregates data for cross-node and cross-service visibility. The Coordinator Pipeline keeps it running smoothly by ensuring you can successfully scale to dozens, hundreds, or even thousands of agents running in your cluster.
Progressive Deployment and Improved Live Coordination with the Coordinator Pipeline
Both the Gateway and Coordinator Pipelines can be adopted easily and incrementally, which enables teams to evolve their architecture as their environment grows in complexity. This lets them harness the power of these new pipelines at their own pace, without needing to recreate pipeline infrastructure from scratch. The Coordinator Pipeline is particularly easy to deploy, as it will automatically discover all node agents and begin coordinating them without any manual reconfiguration.
Once deployed, the Coordinator Pipeline plays an important role in agent scaling. When your deployment is small — say, a single node or a tiny cluster — node agents can easily communicate directly with the backend without any problems. However, as you scale up to large Kubernetes clusters with many nodes, direct agent-to-cloud communication becomes inefficient and noisy. Separate heartbeats, status updates, and tailing requests from every agent are often redundant and can quickly flood the backend, and operations like live log tailing or cluster-wide querying begin to lag. The Coordinator Pipeline addresses these issues by centralizing every heartbeat and control message into a single communication stream, and efficiently orchestrates distributed features like live tailing of streaming logs by assigning them only to available agents.
Advanced Telemetry Processing in the Gateway Pipeline
Routing data streams from Node agents into a Gateway Pipeline unlocks powerful processing capabilities and is easy to configure in Edge Delta’s drag-and-drop pipeline builder interface. Simply add a Gateway Connection node as a destination in your Node Pipeline, and point it to the desired Gateway Pipeline.
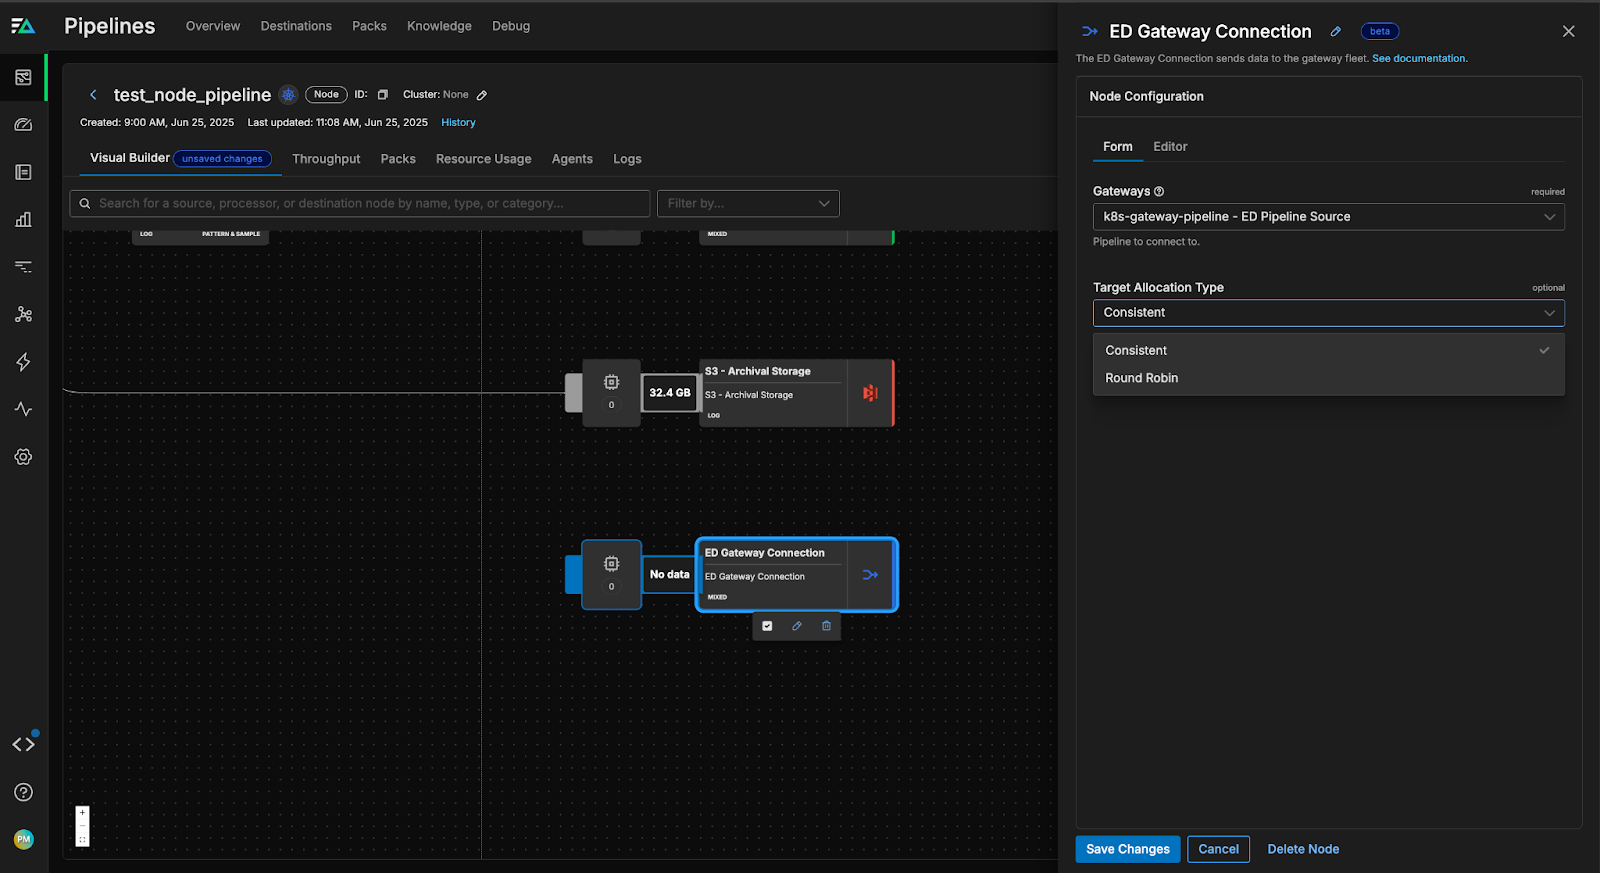
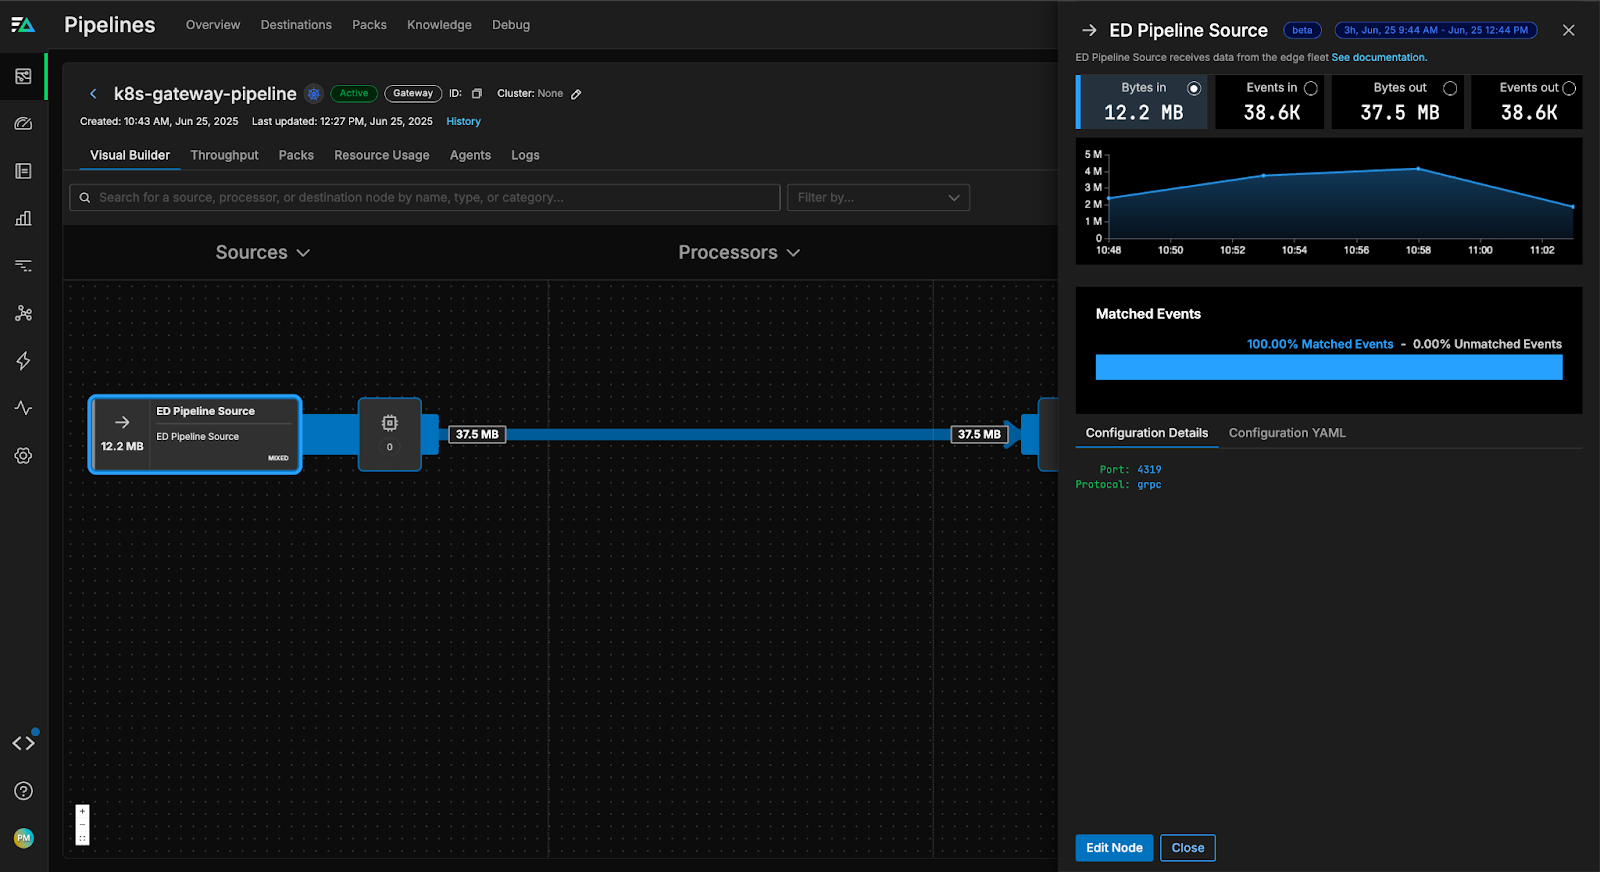
The Gateway Pipeline configuration includes an Edge Delta Pipeline Source node that listens for incoming data from node agents. By default, the Gateway Pipeline’s source listens on a dedicated port (4319 for gRPC) and the Edge Delta agents automatically discover the Gateway’s service when they’re in the same Kubernetes cluster.
If your Gateway Pipeline is running in a different cluster, you can configure the Gateway Connection to expose the Gateway endpoint via DNS name or static IP. This allows you to have a centralized Gateway that aggregates data from multiple edge deployments across regions, or deploy Gateways per region and direct local edge traffic accordingly.
Tail-Based Sampling
One of the Gateway Pipeline’s most game-changing capabilities is tail-based sampling. This sampling approach involves making a sample decision only after the trace has completed and the request can be evaluated holistically. Tail-based sampling is especially valuable when working with distributed traces that contain long-running spans from many services, and it can be performed at scale with Edge Delta’s new deployment model.
The Gateway Pipeline ingests all spans in a given trace before inspecting them and making a sample decision. This enables teams to apply tail-based sampling pre-index, which ensures only the most critical trace data is sent downstream. The Gateway Pipeline implements tail-based sampling logic with the Tail Sample Processor node, which aggregates spans by trace ID at the Gateway level and applies user-defined policies to determine if a trace should be sampled or ignored.
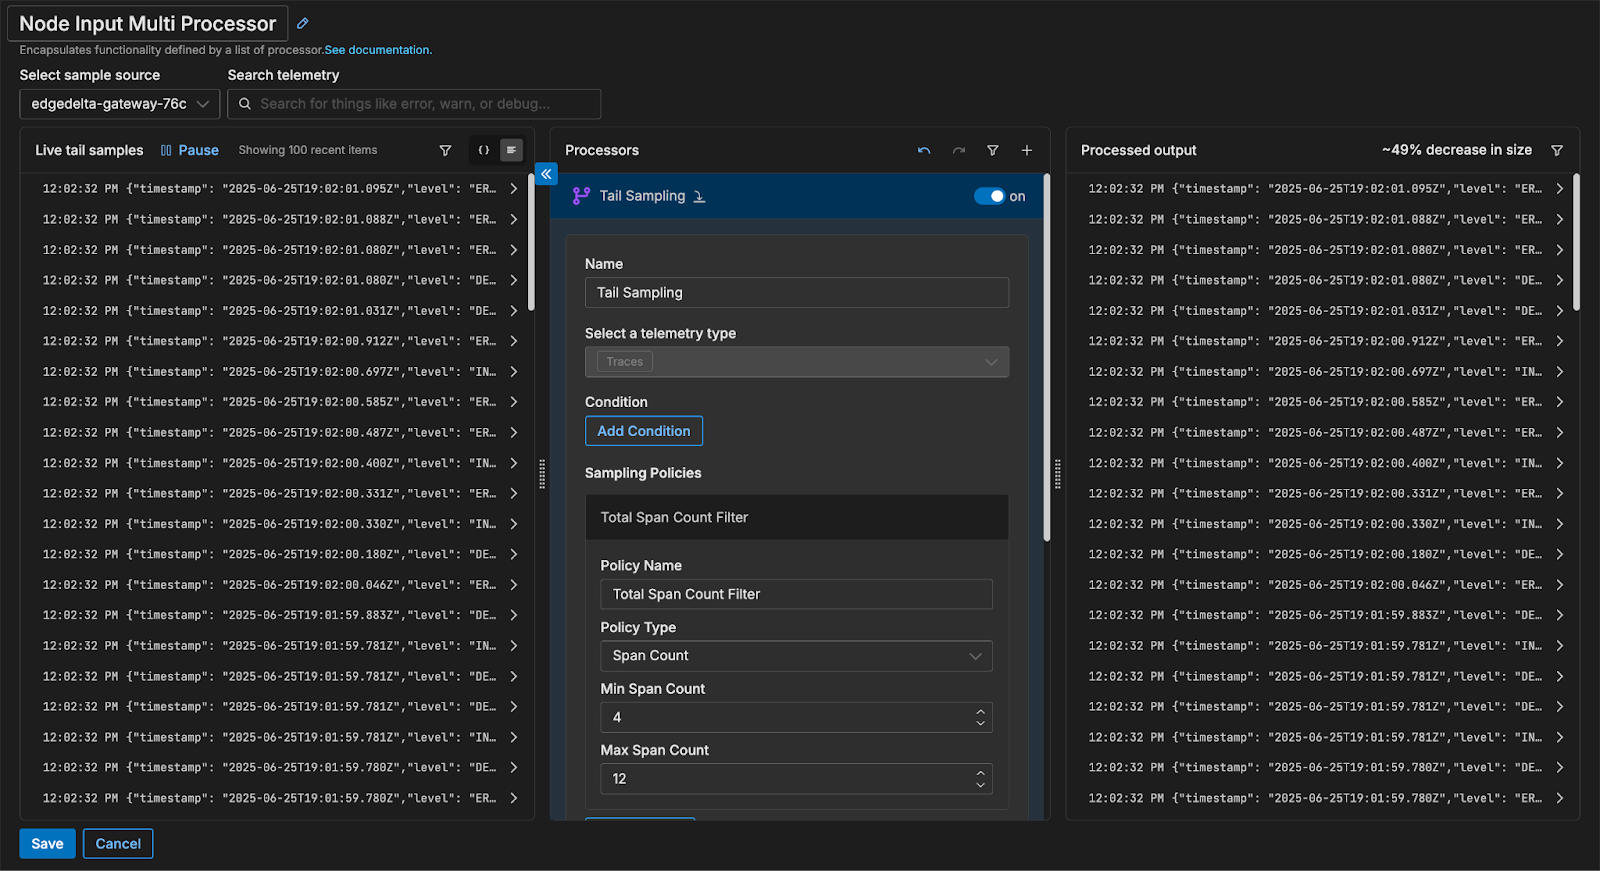
For example, consider a trace that touches five services on five different nodes. With tail-based sampling at the Gateway, you might configure a policy to keep traces that contain an error, or whose overall request duration is in the top 5% of all recorded request lengths. The Gateway then evaluates every span from every trace as they stream in from the Node agents. If the trace meets the criteria you defined in your policy, it will be forwarded in its entirety to the destination of your choice. If not, the trace can be dropped or even metricized, which allows you to retain some high-level information about trace behavior without the costs associated with preserving the entire trace.
Without a Gateway Pipeline, applying this logic requires a complex network of peer-to-peer agents or a separate aggregation layer. Some teams attempt to use an OpenTelemetry Collector aggregation tier for tail-based sampling, but this approach is extremely difficult to maintain. With Edge Delta, you simply add a Tail Sample Processor to your Gateway Pipeline and define your sampling policies, including latency thresholds, error codes, or success percentages, and Edge Delta takes it from there.
Conclusion
Edge Delta’s new Coordinator and Gateway Pipelines represent major advancements in Kubernetes-based telemetry pipeline architecture. By combining the best of node-level data collection and cluster-wide processing, Edge Delta allows DevOps and SRE teams to easily build a pipeline solution that consistently meets their needs — even as their environments become more complex and their data volumes grow.
If you’re new to Edge Delta, explore our free playground to get hands-on with our Telemetry Pipelines.
If you’re an existing user, you can deploy Coordinator and Gateway Pipelines today using our latest Helm charts or manifests.


