Grafana is a robust open-source platform for analyzing, monitoring, and visualizing telemetry from diverse data sources. It is an integral tool for environments that demand advanced data visualization, timely monitoring, and thorough analysis.
Known for its versatility, Grafana enables you to tailor visualizations and alerts to precise requirements. This article explores the pros and cons of using Grafana for monitoring and observability. Continue reading to find out if this tool fits your business needs.
Automate workflows across SRE, DevOps, and Security
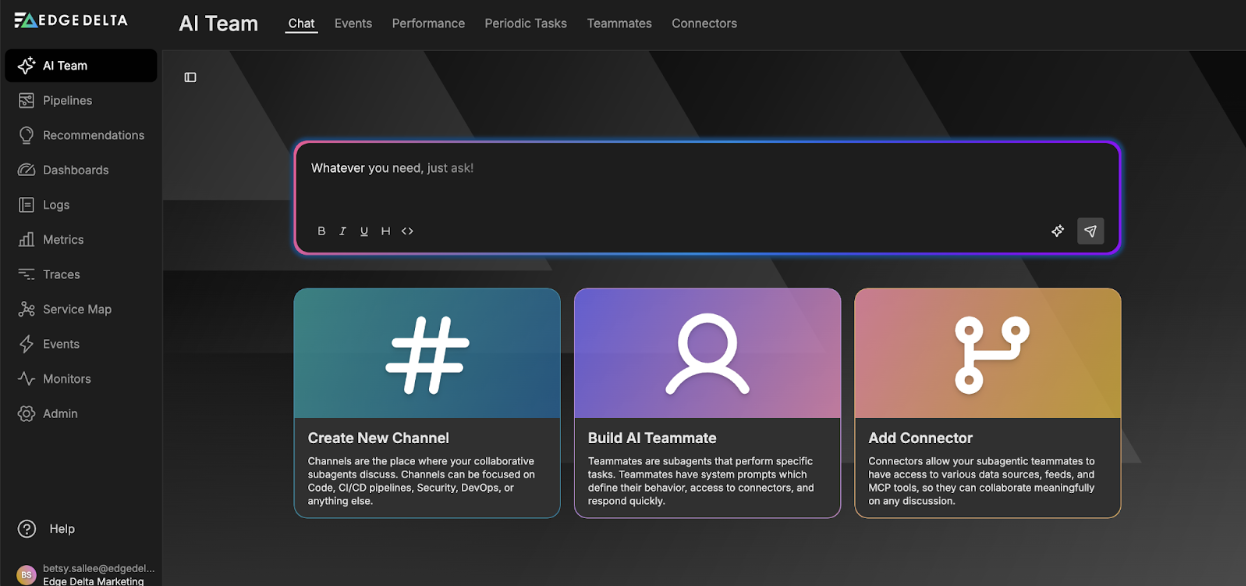
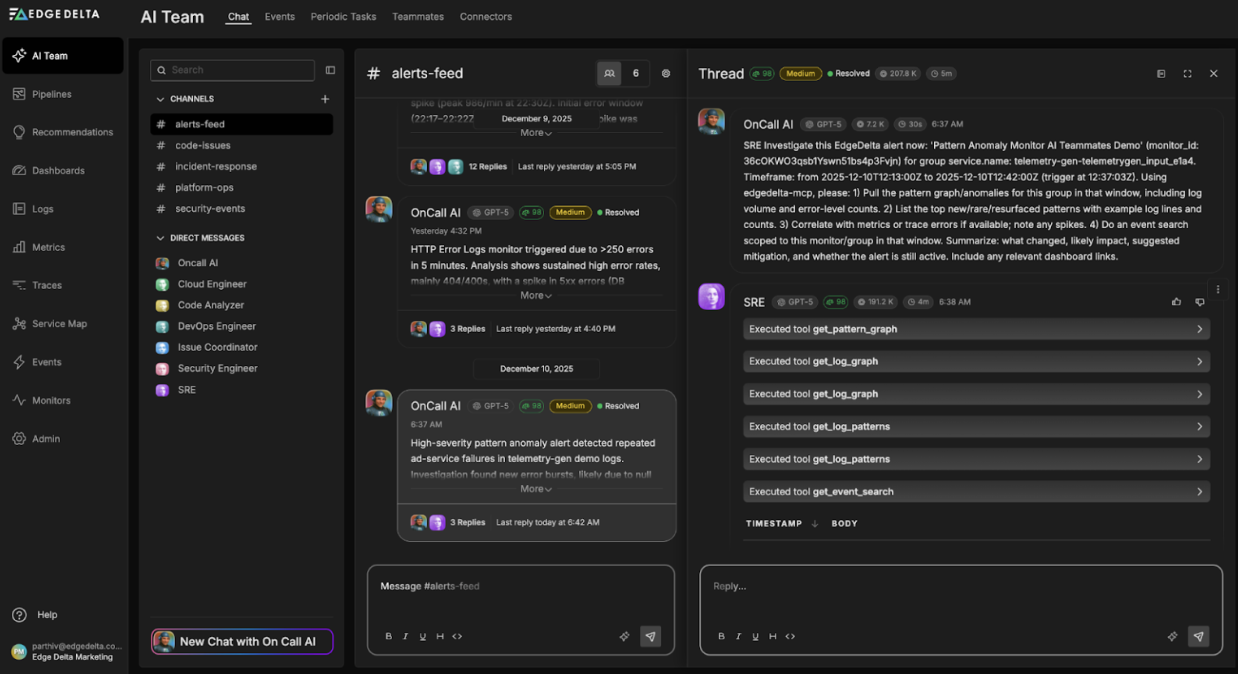
Edge Delta's AI Teammates is the only platform where telemetry data, observability, and AI form a self-improving iterative loop. It only takes a few minutes to get started.
Learn MoreKey Takeaways
- Grafana enables highly customizable visualizations to fit diverse data presentation needs.
- It integrates with various data sources, providing a cohesive view across different systems.
- Grafana scales effectively for large operations and offers robust security features, including multi-factor authentication.
- The platform requires a significant investment of time and technical skills to leverage its capabilities fully.
- While Grafana has extensive community support and plugins, access to official support is limited to paid plans.
Is it Worth It?: Unveiling Grafana Advantages and Downsides
Grafana empowers users to create customizable dashboards that present complex data in an easily understandable format. Moreover, Grafana facilitates integration with countless data sources, including the popular ones Prometheus, Elasticsearch, and various SQL databases.
Here’s a brief overview of Grafana:
| Criteria | Details |
|---|---|
| Deployment | Cloud-based (Self-hosted support is for enterprise only) |
| Mobile | No mobile app is available |
| Pricing Structure | Free, Pro, Advanced, Enterprise |
| License | Open-source |
| Customer Support | Unavailable for free accounts. Full customer support is only available for paid plans |
| Free Trial | Free forever plan |
| Number of Users | 2 million |
| Rating on Capterra | ⭐⭐⭐⭐ (4.6 out of 5) |
Grafana features excel at data monitoring and visualization, providing insights across operational domains. While Grafana stands out for its extensive capabilities and adaptability, navigating its features and maximizing its potential comes with challenges.
Read on to learn more about what it can do and what to watch out for when using Grafana.
Top 9 Benefits of Leveraging Grafana
Grafana is widely recognized for its powerful and user-friendly features that offer a variety of benefits across different use cases, particularly in monitoring, observability, and data visualization.
Here are some of the top advantages of Grafana:
1. Versatile Data Visualization
Grafana supports various data visualizations—including graphs, charts, tables, gauges, heat maps, and geospatial maps. It helps users create comprehensive and easy-to-understand visual representations of their data. Users can even leave annotations on graphs to mark essential points.
With its flexible data visualization, Grafana makes dashboard data representation appealing and easy to understand for specific contexts, improving utility and readability.
2. Support for Multiple Data Sources
Grafana can integrate with multiple data sources, including the following:
- Prometheus
- InfluxDB
- Graphite
- Elasticsearch
- Microsoft SQL Server (MSSQL)
- Datadog
Providing a unified view, Grafana’s integration capabilities help users combine data from various environments and platforms. Moreover, you can visualize these data sources without ingesting the underlying data into Grafana’s backend. This unified view eliminates switching between tools that streamlines the data analytic process.
Grafana also improves decision-making by providing data-wide insights and trends. Its support for multiple data sources boosts operational efficiency and performance monitoring capabilities.
3. Customizable Dashboards
Users can customize their dashboards in Grafana with a drag-and-drop interface. The dashboards can be tailored to suit specific monitoring needs—from IT operations to IoT devices.
Grafana’s customization uses template variables. Templates enable dashboard reuse across different servers, applications, and services without creating a new dashboard for each instance. It promotes efficiency and consistency in monitoring practices.
Moreover, Grafana dashboards are dynamic. Each dashboard offers interactive elements like time range selectors, variable filters, and drill-down links to allow active analysis platforms and let users interact with their data in real-time.
4. Alerting & Notifications
Grafana has a robust alerting system, notifying teams via email, Slack, PagerDuty, and more when data falls outside of predetermined thresholds. This feature helps users with proactive monitoring and incident management.
Its integrated alerting functions allow users to define alert rules based on the data presented on the dashboards. Grafana can notify team members when thresholds are breached, embedding operational responsiveness directly into the dashboard environment.
5. Community and Ecosystem
Grafana benefits from a strong community and ecosystem. The community contributes plugins, dashboards, and add-ons that extend Grafana’s functionality and ease of integration with other tools and platforms.
Moreover, Grafana is known for its comprehensive customer support through its premium plan. Software Advice even rated the tool 4 out of 5 stars for customer service.
6. Accessibility and Sharing
Dashboards and visualizations can be easily shared among team members or publicly with Grafana. This facilitates collaboration and data-driven decision-making. The tool also supports multi-tenancy, allowing different users and teams to have their own dashboards.
7. Security Features
Grafana provides security features such as administrative UI, compliance (SOC2, ISO 27001, PCI, GDPR, CSA, and HIPAA), and user and permissions management. It ensures that sensitive data remains protected.
The open-source analytics application also supports multi-factor authentication (MFA). It has regular infrastructure vulnerability assessments, independent third-party penetration testing, and independent audits for guaranteed security.
8. Scalability
Grafana is designed to efficiently scale from running on a single server to multiple nodes. Its scalability allows it to handle growing data volumes and user demands without performance degradation.
Grafana can expand seamlessly to accommodate growth by distributing the workload across several servers. Being scalable guarantees that organizations can maintain high-performance data analytics and monitoring while adapting to increased data and addressing user access needs with minimal disruption.
9. Cost-Effectiveness
Grafana provides powerful monitoring and visualization capabilities at a fraction of the cost of comparable tools. Being open-source, Grafana significantly reduces the costs associated with monitoring and data visualization—especially for startups and small businesses.
The tool offers a pay-as-you-go plan, allowing users to pay only for resources used. Grafana pricing plans also include an advanced premium bundle starting at $299 and an enterprise plan.
These benefits make Grafana an attractive tool for organizations looking to monitor their IT infrastructure, applications, and services effectively while also analyzing performance and operational data.
Key Drawbacks of Using Grafana
Despite its powerful data visualization and monitoring capabilities, Grafana still has drawbacks. Here are some detailed disadvantages of Grafana:
1. Complexity and Learning Curve
Grafana’s complexity and learning curve can pose challenges. Setting up dashboards and alerts often demands understanding specific query languages and navigating extensive options, which might be difficult for beginners.
The steep learning curve means users must invest time learning the platform before fully leveraging the tool’s capabilities. Customizing alerts and visualizations may even require technical skills, which can slow setup and adjustment.
2. Integration and Compatibility Issues
While Grafana supports many popular data sources, integrating with less common or proprietary databases without a native plugin can present complexities. Many advanced features and integrations in Grafana also rely on plugins, which can lead to stability and security issues.
3. Performance Concerns
Grafana can be resource-intensive, especially when loading complex dashboards or handling many queries simultaneously. The tool’s performance can be affected when it requires more powerful hardware or optimized configurations.
4. Alerting Limitations
Grafana’s alerting capabilities can still be basic compared to specialized alerting and incident management tools. It lacks advanced features like alert correlation, suppression, and escalation paths.
Moreover, Grafana has no built-in remediation, which means it doesn’t offer direct support for automated remediation or incident resolution workflows. Integration with external systems is required for these functionalities.
5. Security and Access Control
While Grafana offers role-based access control, managing permissions can become time-consuming in large organizations or complex setups. The granularity of permissions might not meet all organizational requirements.
For advanced security features such as single sign-on (SSO), Grafana often relies on external identity providers. This adds complexity and potential points of failure.
6. Visualization and UI Limitations
Although Grafana is highly customizable, its built-in visualization options have limitations. Extensive customizations can require development effort or reliance on community plugins.
Moreover, some users find UI aspects less intuitive or cumbersome for specific tasks, such as navigating between dashboards or configuring complex panels.
7. Community and Support
While Grafana has a strong community, reliance on community support and plugins can be risky. There may be variability in response times, support quality, and plugin reliability.
Access to official support and advanced features requires a Grafana Enterprise subscription, which might not be feasible for all organizations.
8. Difficulty Making Reports
Even though Grafana excels at creating dynamic, interactive visualizations for data analysis, some users find it challenging to generate static reports like PDFs or automated email reports. Reporting is not permissible in Grafana’s free versions; only premium Grafana does.
Grafana’s user interface and features are primarily designed for real-time data exploration rather than the specific layout and customization needs of static reporting. Grafana requires plugins or additional tools to customize reports or schedule automated report releases.
9. Dependency on External Data Sources
Grafana’s effectiveness depends on the performance and availability of the data sources it integrates with. Issues such as delays, downtimes, or inaccuracies in these sources can directly impact its effectiveness in delivering real-time analytics and monitoring.
While Grafana is a powerful data visualization and monitoring tool, it’s essential to consider its disadvantages when evaluating if it fits your specific needs. Balancing the advantages with potential drawbacks will help make an informed decision.
Conclusion
Grafana is a robust open-source platform for data visualization and monitoring, known for its adaptability and extensive visualization tools. It integrates seamlessly with multiple data sources and offers visualization components and collaborative features that enhance team efficiency.
However, its open-source nature means there’s a steep learning curve and reliance on external tools for data collection. Such factors complicate setup and impact performance with large datasets or complex dashboards.
Despite the challenges, Grafana remains a valuable data analysis and monitoring tool. Users should be aware of its dependency on external tools, potential performance issues, and the effort required to master its features.
FAQs on Pros and Cons of Using Grafana
Which is better—Prometheus or Grafana?
Prometheus and Grafana serve complementary purposes. Prometheus specializes in monitoring and alerting by collecting time-series data, while Grafana excels at visualizing this data through interactive dashboards. When used together, they offer a comprehensive solution for monitoring, alerting, and visualizing the performance of IT infrastructure and applications.
How is Grafana different from Kibana?
If you need a tool to monitor and analyze time-series data, Grafana is a good option. But if you are working with data stored in Elasticsearch and want powerful search and visualization capabilities, Kibana can be a better choice.
Is Grafana good for alerting?
Yes, Grafana is effective for alerting with flexible conditions and supports various notification channels. Additional tools may be necessary for large-scale or advanced needs.


