Many teams have chosen to address their telemetry needs by leveraging the power of telemetry pipelines — modern data management tools that facilitate the collection, processing, and routing of telemetry data from multiple sources to any number of downstream destinations. When optimized, telemetry pipelines provide organizations with greater control over their telemetry data, and can significantly reduce both observability and security costs.
However, organizations are constantly evolving, and as a result, so are their telemetry needs.
Whenever new applications or workflows are introduced, net-new telemetry data is generated. Additionally, when existing applications or workflows are modified, the format of previously created telemetry data can drastically change. Therefore, it’s crucial that you’re able to swiftly and securely update your telemetry pipeline to properly handle these changes.
To give you an idea of how significant this can be, imagine an organization that produces 100 terabytes of telemetry data per day at a constant rate — which, in the current technology landscape, is not at all uncommon. If after a change to their telemetry data, their production pipelines are down for only 10 minutes, they would lose roughly 700 GB of data! The possible evaporation of that much data is a massive risk, and could potentially result in the loss of critical context around production incidents. This example highlights the importance of deploying the necessary pipeline updates into production in a safe and effective manner.
In this post, we’ll discuss best practices and strategies for deploying changes to a Telemetry Pipeline, and cover a real-world example by applying them to build an Edge Delta Telemetry Pipeline.
Initial Deployment Strategy
Before pushing any changes, we first need to identify what specifically needs to be updated. In other words, how do we want to re-architect our current pipeline to ensure it can handle the system’s new requirements?
At a high-level, we first need to understand:
- What our new telemetry data looks like
- What we want it to look like after processing
- What operations to perform on it to achieve that transformation
(Check out our blog on architecting telemetry pipelines for the full breakdown)
Once we’ve identified the changes we want to make, we can begin the deployment process.
Before diving into pipeline deployment strategy, let’s quickly walk through the software deployment process. Software changes are rarely pushed directly into production environments — instead, they go through a software development life cycle that involves making changes to a “dev” environment and pushing them to a “staging” environment to thoroughly test them before publishing.

So instead of having only one pipeline that is in production, organizations should mirror this structure and include two more pipelines, one each for the “dev” and “staging” environments. This way, when implementing pipeline changes, you can follow the standard procedure of experimenting in the “dev” environment → heavy testing in the “stage” environment → implement changes in the “prod” environment.
Let’s now look at a real-world example, and demonstrate how this process might work in practice using Edge Delta.
Real World Example
Imagine that an organization has three separate Kubernetes clusters for “dev”, “staging”, and “prod”. Within each cluster, an Edge Delta agent fleet has been deployed, so each environment has its own separate pipeline. Then let’s say this organization has recently deployed an Apache HTTP server into production to help manage an increasing number of user requests. As a result, this deployment begins generating log data in the Apache access log format, a new type of telemetry data that looks like this:
192.168.2.20 - - [28/Jul/2006:10:27:10 -0300] "GET /cgi-bin/try/ HTTP/1.0" 200 3395where:
- “
192.168.2.20” represents Client IP address which made the server request - The first “
-” denotes the requested piece of information is not available - The second “
-” denotes the requested information doesn’t require authentication to access - “
[28/Jul/2006:10:27:10 -0300]” denotes the time the request was received - “
GET /cgi-bin/try/ HTTP/1.0” describes the request - “
200” is the status code sent back to the client - “
3395” is the size of the object returned to the client, in bytes
(For a full breakdown, check the official Apache documentation https://httpd.apache.org/docs/2.4/logs.html.)
This team’s Edge Delta Telemetry Pipeline isn’t currently working with this data, and therefore it’s crucial to swiftly deploy a pipeline update to ingest, process, and route it appropriately. More specifically, they need to:
- Capture all Apache access logs from the Kubernetes Source input
- Leverage Grok patterns to parse log data, and create corresponding attribute fields for each part
- Send all processed data into Datadog
They can leverage Edge Delta’s Visual Pipeline Builder to easily jump into editing mode, and modify their pipelines with ease. Let’s go through each environment to see how this works:
Dev Environment
The organization’s Edge Delta Telemetry Pipeline in the “dev” cluster environment currently looks like this:
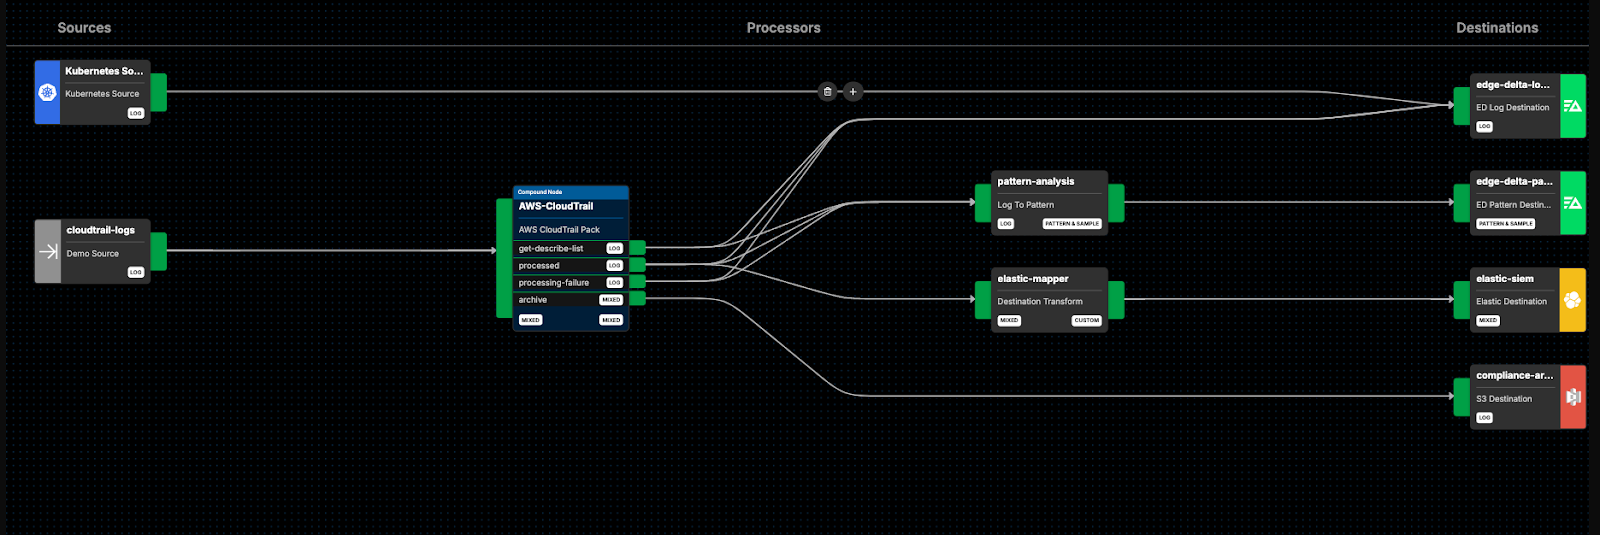
From here, we can add a few nodes and routes to accomplish our functional goals:
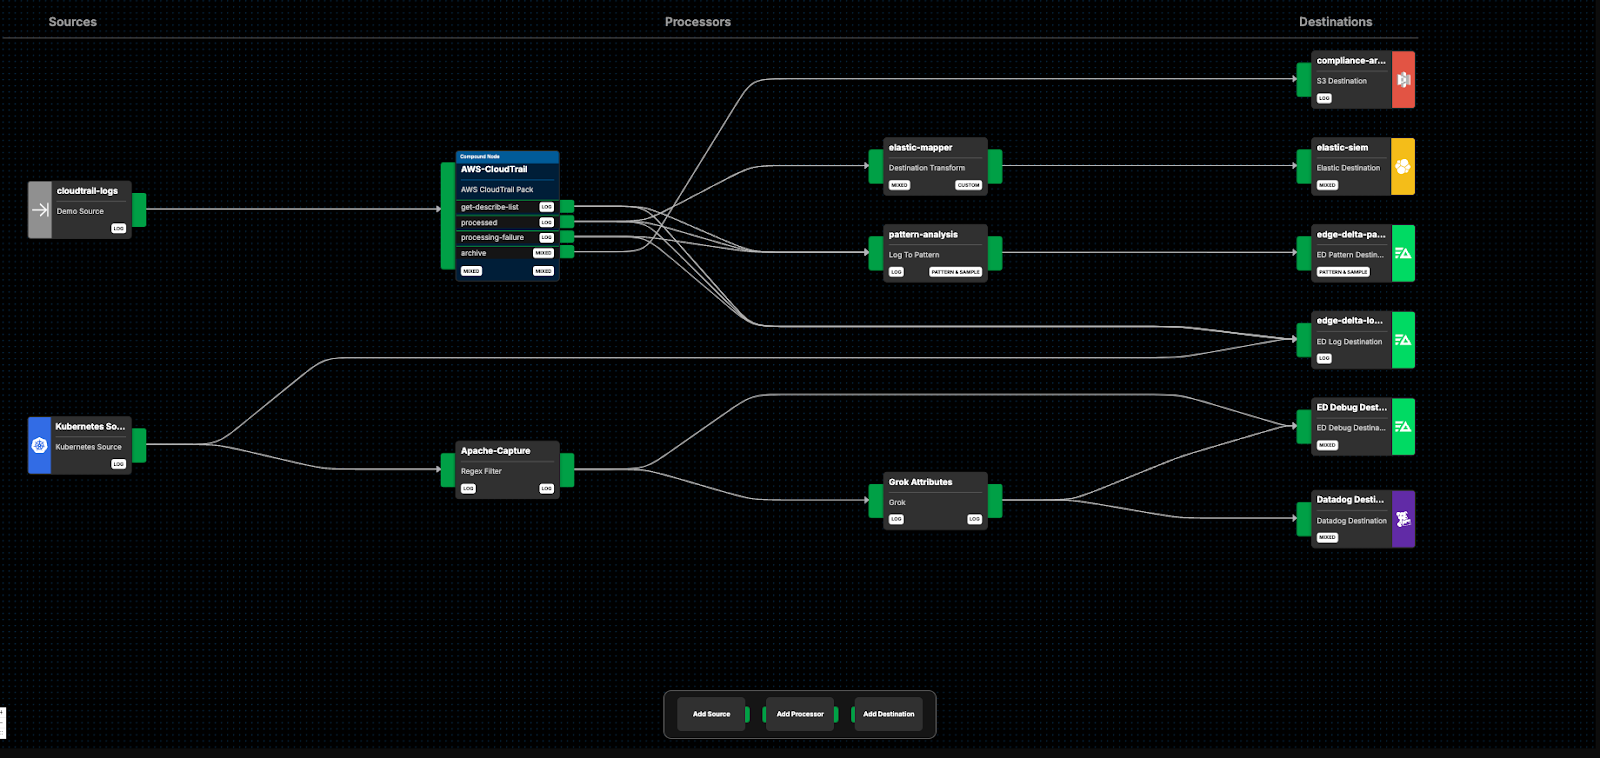
Here, we’ve added a new route from the “Kubernetes Source” node into a filter node called “Apache-Capture,” which captures all Apache access logs and removes everything else. From here, we route the Apache logs into the “Grok Attributes” node, which leverages Grok parsing to convert them into structured OTel format. From there, we route the processed data into Datadog for further analysis (we’ll keep the raw Apache access logs flowing into Edge Delta as well for now).
We’re currently also routing the outputs from the “Apache-Capture” and “Grok Attributes” nodes into the “ed-debug” output, which allows users to view data payloads in the Edge Delta UI.
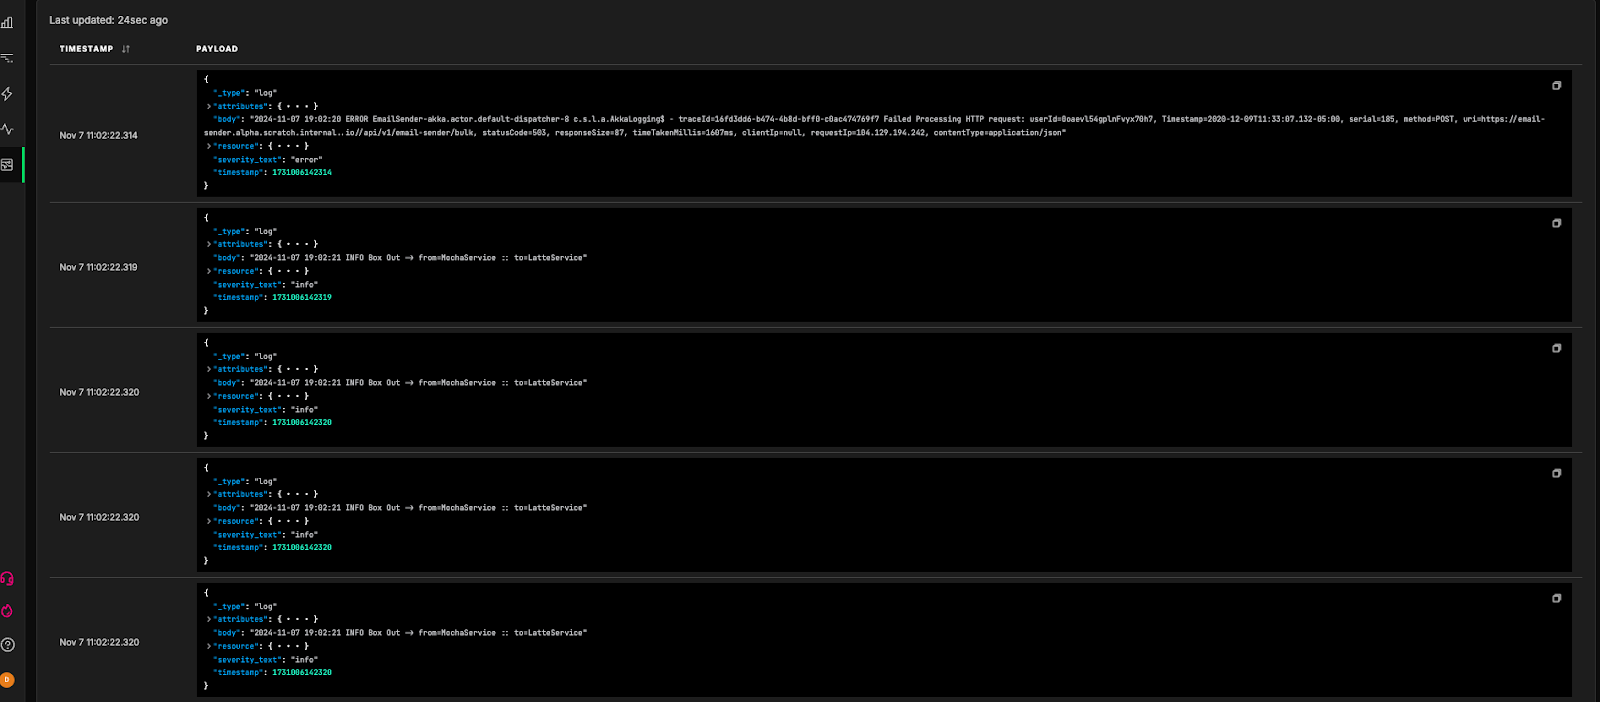
This way, we can check the outputs of each intermediary node, and confirm they look as expected.
Staging Environment
Once we’ve confirmed everything looks correct, we can push our changes to the staging pipeline. This will look similar to the dev pipeline environment, and will more closely mimic production (typically by sending subsections of production data through the pipeline). At this stage, rigorous testing takes place to ensure the pipeline works exactly as intended.
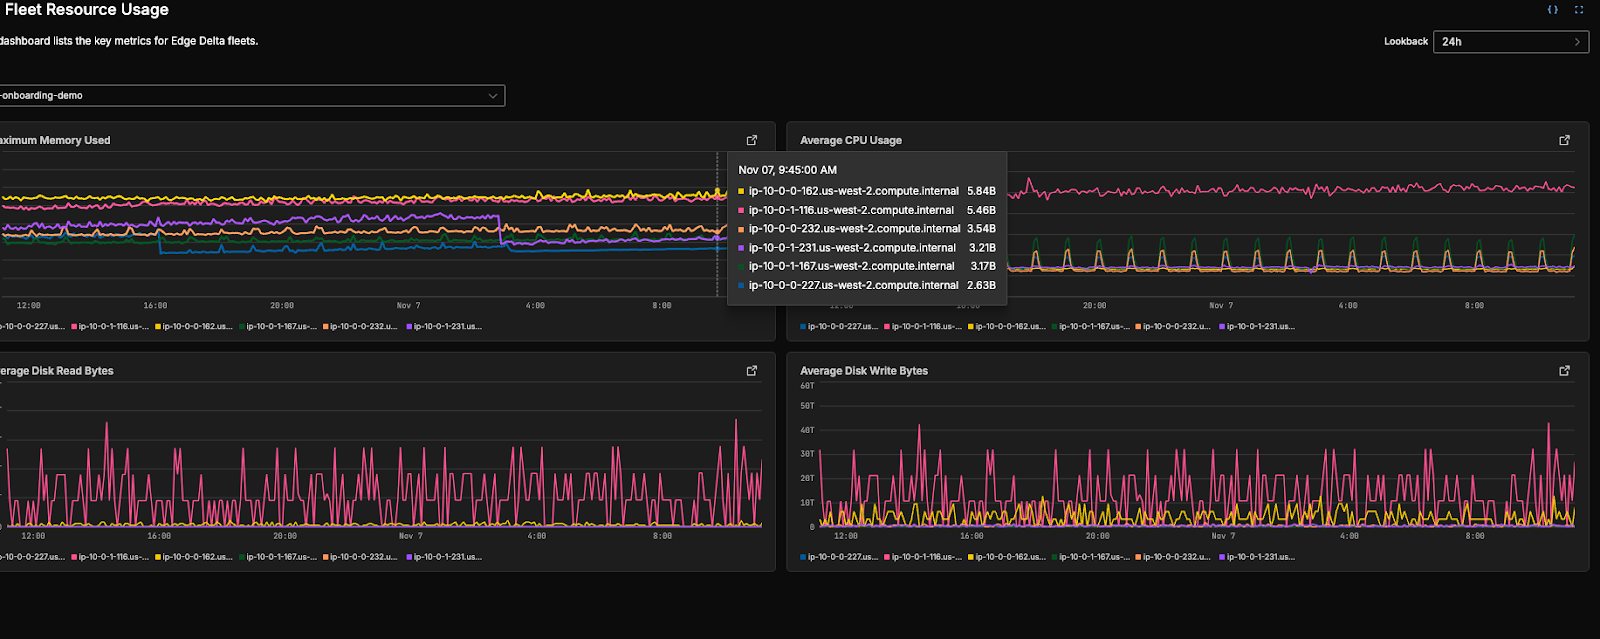
Usefully, Edge Delta has a powerful suite of tools built to help users test their Telemetry Pipelines. In particular, users can set up dashboards — or use pre-built dashboard configurations — to monitor the health and behavior of their environments and telemetry data.
For instance, you can use Edge Delta’s pre-built “Fleet Resource Usage” dashboard to monitor the health of your Edge Delta agent fleet while testing pipeline changes in staging. Unusual behavior, like abnormally high levels of memory being used, can be an indicator that your logs aren’t being ingested, processed, or routed properly.
Prod Environment
Once all tests have passed, and you’re confident that the changes are working as intended, it’s time to push to production. Since we’re pushing these changes live, it’s important to remove any unnecessary nodes or routes that existed solely for testing purposes. In our case, let’s remove the routes from the intermediary processing nodes into the “ed-debug” output, since we know the data is now formatted as expected:
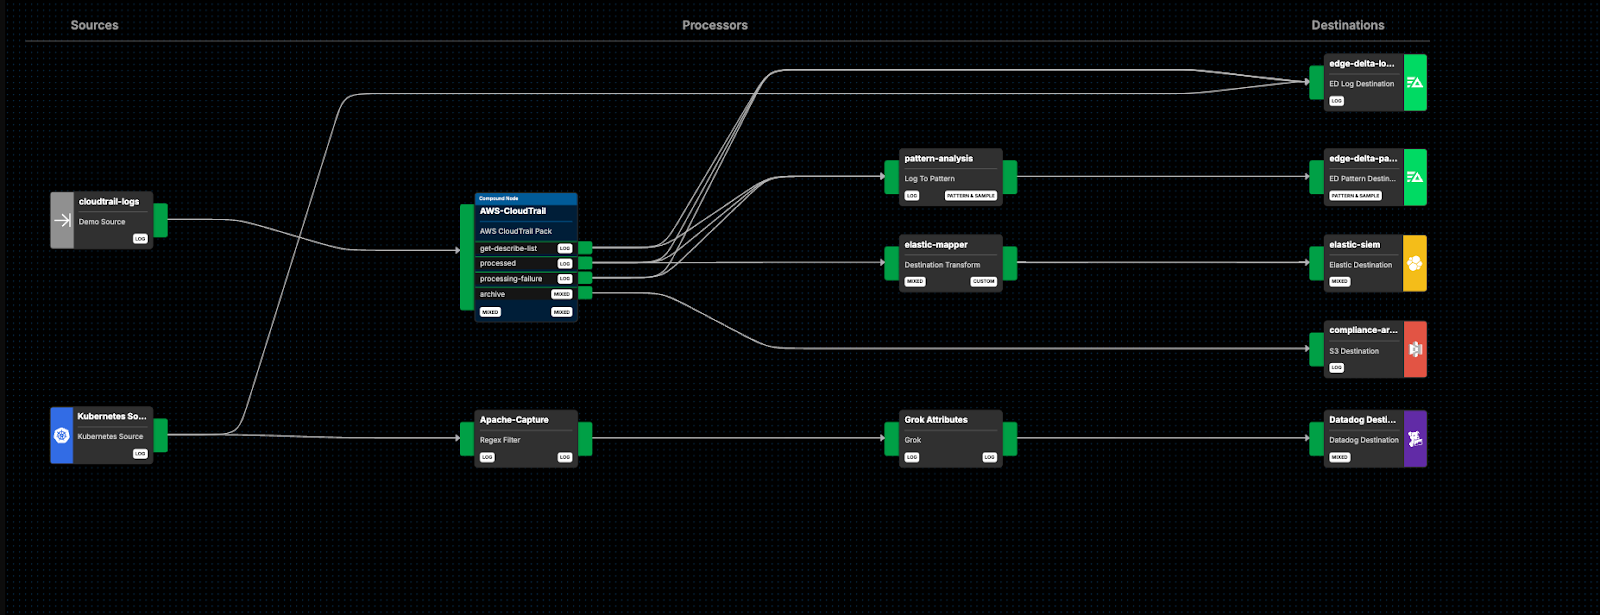
Once in production, however, the testing doesn’t stop. Make sure you’re leveraging more lightweight testing technologies, like dashboards and monitors, to ensure your Telemetry Pipeline is meeting all functional goals while limiting impact on performance.
Final Thoughts
Intelligent telemetry pipelines, such as those designed by Edge Delta, are powerful tools that provide you with complete control over your telemetry data. When making pipeline changes, it’s imperative that you properly test them before integrating into dynamic, real-world environments. Building separate telemetry pipelines for your “dev” and “staging” environments does indeed require more compute and oversight to run compared to a single live one, but it leads to a much more robust production pipeline with fewer issues to sort out down the road.
Want to give Edge Delta Telemetry Pipelines a try? Check out our playground environment. For a deeper dive, sign up for a free trial!

