The internet regularly grows as users discover new methods to consume info. With the rise of social media, people have come to rely on the internet to satisfy their daily data needs.
In 2020, users generated 64.2 ZB of data, which exceeded the number of detectable stars in the cosmos. Experts expect the figures to rise, with data creation reaching 147 ZB by the end of 2024.
Automate workflows across SRE, DevOps, and Security
Edge Delta's AI Teammates is the only platform where telemetry data, observability, and AI form a self-improving iterative loop. It only takes a few minutes to get started.
Learn MoreLet’s explore the stats behind data creation to discover how much data the world creates daily, analyzing key factors to reveal the bigger picture of data generation, such as:
- Daily Data Creation per Platform
- Daily Data Generation per Type of Content
- The Demographic of Daily Data Creation
- Data Creation Projections and Trends
Editor’s Choice
- With around 5.35 billion internet users worldwide, each person can potentially generate approximately 15.87 TB of data daily.
- Facebook produces approximately 4,000 TB daily, ranking #1 in most visited sites globally in 2023.
- X (Twitter) garners around 500 million tweets daily, which amounts to 560 GB of data.
- In 2024, on average, TikTok videos produce approximately 7.35 TB of data daily.
- YouTube hosted over 720,000 hours of videos daily in 2023, which is equivalent to about 4.3 PB of data.
- Google processes around 3.5 billion searches daily, amounting to 20 PB.
- In 2023, the average internet user created about 1.7 MB of data per second, equal to 146,880 MB daily.
- An average household of 4 can create about 506,736 MB of data daily.
Shedding Light on the Amount of Data Created Daily
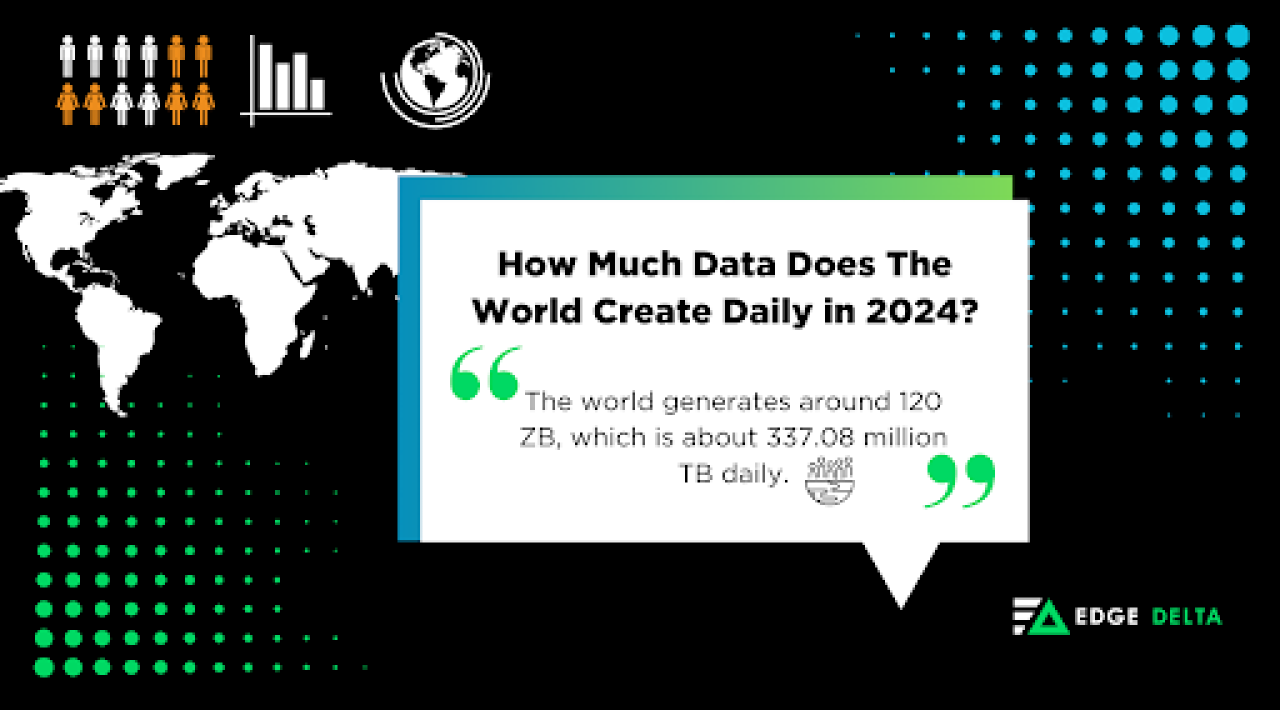
In 2023, the world created around 120 zettabytes (ZB). Breaking down the figures will give a rough estimate of 337,080 petabytes (PB) of daily data. In context, there are around 5.35 billion internet users globally, meaning each user can create about 15.87 TB of data daily.
Exploring the Figures Behind Daily Data Creation on Various Platforms
Internet platforms have led the charge for Internet usage. Of the 5.35 billion internet users, 5.04 billion were social media users. These platforms generate continuous data streams driven by the complex mode dubbed “Internet of Things (IoT).” IoT includes user-generated content, data collection, and storage.
Here’s a quick look at the amount of data created daily on different platforms:
The section below discusses how much data the top websites produce daily, categorized by type of online platform.
1. In 2023, Facebook produced around 4 PB on average per day.
(Medium, Kinsta, Statista)
Facebook ranked #1 in most visited sites globally in 2023, with around 3.049 billion daily active users. The social media site generates about 4 petabytes (PB) daily, which Facebook stores in its server called the “Hive.”
The social networking platform has consistently grown its daily user base, from 1.562 billion daily users in the first quarter of 2019 to 2.11 billion by the end of 2023, a 35.08% increase.
2. An average IG account uses around 9.6 GB to 14.4 GB daily.
(Finances Online, Bernard Marr, Mint Mobile)
At the start of 2024, Instagram garnered around 2 billion monthly active users. The photo and video social media platform hosts around:
- 95 million videos and photos
- 67,305,600 daily posts
- 999,360,000 IG reels sent via direct messages.
Instagram is among the biggest social media apps globally, tied with WhatsApp for 3rd place on the most popular social networks list.
3. With 619 million active users, X creates around 12 TB daily.
(Woodward Avenue, Statista, Stack Overflow)
X, formerly known as Twitter, generates about 4.3 PB annually. The social media platform amasses around 500 million tweets daily, amounting to 560 GB of data. The figures can be broken down into:
- 6,000 tweets per second
- 350,000 tweets per minute
- 200 billion tweets annually
4. WhatsApp users send approximately 2 billion voice and video calls per day.
(Verloop, Statista, TechCrunch, Make Use Of)
On average, Whatsapp users send around 2 billion calls. The numbers can amount to 740 kb for a minute of call, equating to around 2.13 million TB per day, spread around 2.78 billion users.
WhatsApp users also send over 100 billion messages to each other daily. This totals 4.32 TB of data produced via chats since WhatsApp chats average around 30 kb or less.
Fun Fact:
On June 17, 2020, WhatsApp recorded the most processed messages daily. The social networking platform processed over 27 billion messages in a single day.
5. TikTok users spent around 840 MB per hour on the app in 2023.
(Mint Mobile, Statista, The Video Animation Company)
In 2023, TikTok users uploaded about 490,000 videos daily, with an average size of around 15 MB (60-second format). This means that TikTok videos create an average of 7.35 TB daily.
Did You Know?
TikTok started as Douyin in 2016, with around 100 million users. The app became an international success after merging with another Chinese social app, Musical.ly, in 2018.
The video-and-music combo proved effective and overtook the world, especially during COVID-19 lockdowns, as the platform gained around 465.7 million users in 2020.
6. The YouTube global community uses approximately 440,000 TB daily.
(Whistle Out, Android Authority, Statista)
YouTube hosts around 720,000 hours of videos per day, equating to around 4.3 PB of data. The figure is around 0.17% of the video-sharing platform’s daily storage of 2,500 PB.
| Video Quality | Data Used Per Minute | Data Used Per 60 Minutes | Data Used Per 24 Hours |
|---|---|---|---|
| 144p | 0.5 MB – 1.5 MB | 30 MB – 90 MB | 720 MB – 2.16 GB |
| 240p | 3 MB – 4.5 MB | 180 MB – 250 MB | 4.32 GB – 6 GB |
| 360p | 5 MB – 7.5 MB | 300 MB – 450 MB | 7.2 GB – 10.8 GB |
| 480p | 8 MB – 11 MB | 480 MB – 660 MB | 11.52 GB – 15.84 GB |
| 720p (HD) | 20 MB – 45 MB | 1.2 GB – 2.7 GB | 28.8 GB – 64.8 GB |
| 1080p (FHD) | 50 MB – 68 MB | 2.5 GB – 4.1 GB | 60 GB – 98.4 GB |
| 1440p (QHD) | 45 MB – 135 MB | 2.7 GB – 8.1 GB | 64.8 GB – 194.4 GB |
YouTube will have approximately 2.49 billion users by 2024, making it the world’s second-largest social networking site. The platform was also the second most popular in 2023, with over 3.76 billion daily views.
7. Google manages approximately 20 PB every day.
(Skill-Lync, Tech Guard, Statista)
Google is the most visited site worldwide, with around 480 million unique visitors daily. The search engine processes approximately 3.5 billion searches daily, about 40,000 searches every second.
The data that Google processes include:
- Google searches
- YouTube videos
- Gmail messages
- Google Smart devices
- File sharing
- Cloud storage
- Google Maps requests.
Statistics on Daily Data Generation Per Type
The internet contains content such as videos, audio, and images, sourced from the 200.12 active websites globally. These types of content are either user-generated, created by websites, or produced by AI, all requiring certain amounts of data.
| Type of Content | Amount of Data Generated Daily |
|---|---|
| Videos | 2.71 Hours of Videos |
| Images | 3.2 Billion Photos Shared |
| Audio | 1.38 Hours of Listening Session |
Figures behind the data types suggest that over half of people worldwide go on the web to watch videos, TV shows, or movies, at 52.3%. In comparison, 45.1% use the internet to listen to music.
Let’s explore the facts and figures behind how much data the types of internet content generate daily.
8. Internet users spent around 2.71 hours daily, on average, watching online videos in 2023.
(Statista, Mint Mobile, Variety, Domo)
In 2018, people spent over 10.5 hours watching digital videos per week or 1.5 hours per day. This number grew to about 19 hours per week or 2.71 hours daily in 2023.
Netflix, the second biggest streaming platform in the US, creates around 1 to 3 GB of data per hour, with viewers spending about 3.2 hours daily on the site. A study also claimed that Netflix users streamed approximately 404,444 hours of video every minute in 2020, amounting to 532.89 million hours daily.
Interesting Fact:
Netflix accounts for 7.6% of the US viewership time. This figure amounts to 2.6 times the duration people spend on Amazon and 1.4 times the amount they spend on Disney+Hulu.
9. Approximately 28.08 billion photos were stored online daily in 2023.
(Mediaclip, Response MA, LocaliQ, Photutorial, Queensland University Technology)
Studies mentioned that around 10 trillion photos were stored online in 2023 through cloud storage and other media platforms. These images come from various platforms, such as social media and image-hosting sites.
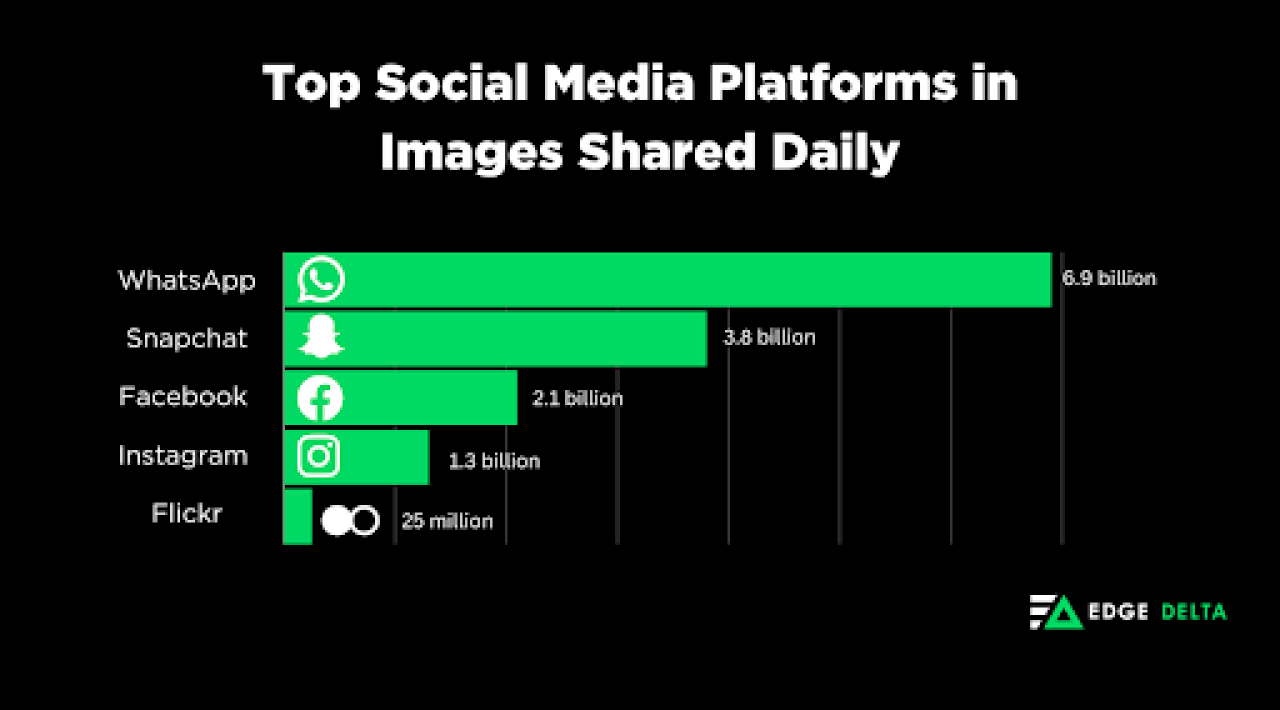
WhatsApp users share the most images on social media sites, with 6.9 billion photos shared between users daily. Second on the list is Snapchat, with 3.8 billion photos shared.
10. Internet users worldwide spent about 1 hour and 38 minutes per day listening to music on audio streaming services in 2023.
(GWI, DataReportal, Digital Music News, Apple)
The daily average grew by five minutes per day from the previous year, a 5.4% rise in Q3 of 2023. During that year, the average listener spent around 36 days a year on audio streaming services.
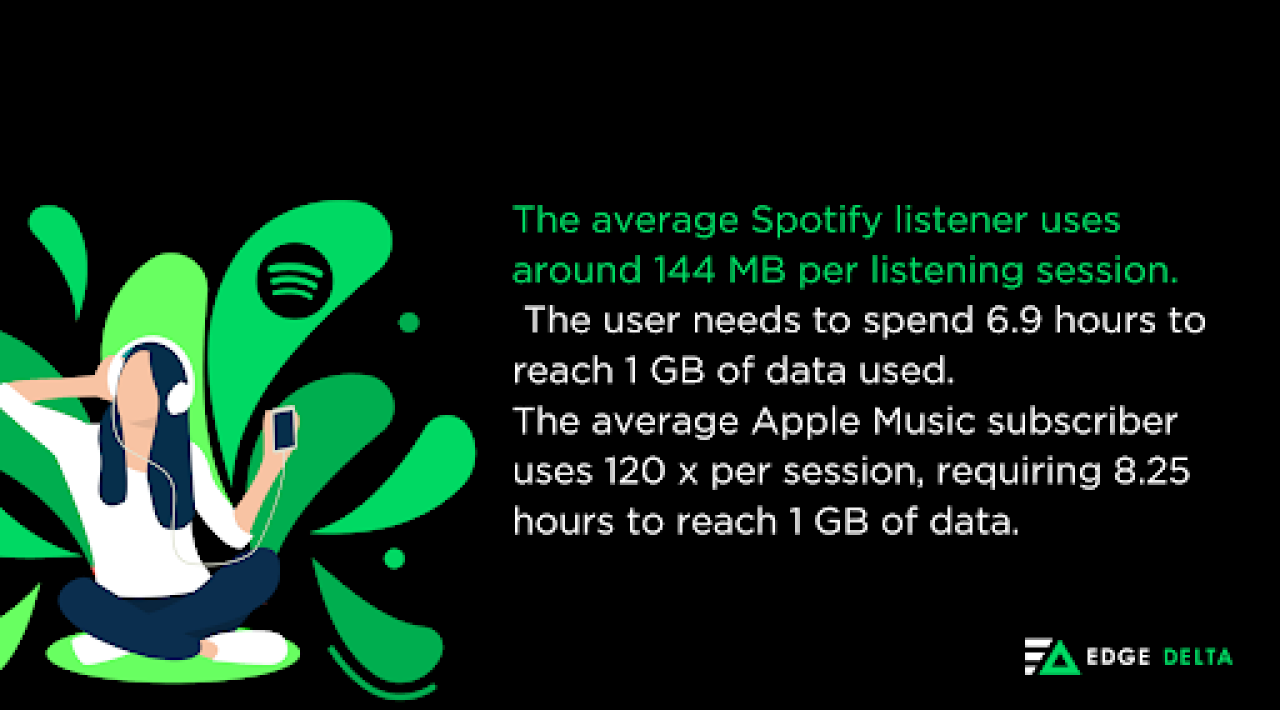
On Spotify, the average listener uses around 144 MB per session, needing 6.9 hours to reach 1 GB of data. Meanwhile, users spend 120 MB on Apple Music per session, requiring 8.25 hours to reach 1 GB of data.
Facts and Figures on the Demographics of Daily Data Creation
The Internet is home to various users, each with distinct reasons for going to the web. For example, 60.9% of users browse the web for information, while 56.6% use it to keep in touch with others.
Did You Know?
Experts project that by 2025, over 463 exabytes (EB) of data will be generated daily worldwide. The numbers are equivalent to 212,765,957 DVDs per day, equal to watching “The Social Network” non-stop for 17,878,250.55 days.
The next section explores these types of users, diving deep into the statistics behind the demographic of users and how much data these users create daily.
11. An internet user generates an average of 146,880 MB daily.
(Domo, World Population Review)
Researchers have stated that the average person produces 1.7 MB per second or 6,120 MB per hour. The average number of members globally is 3.45 on a household scale, meaning a family can create about 506,736 MB daily.
12. Experts project that Chinese internet users will produce around 133,000 PB daily by 2025.
(The China Project, 21Jingji, 36Kr, Cloud Scene, HKTDC Research)
Despite 441 data centers, China held only 5% of the overall trading market 2021. The Red Dragon ranked second in global data output rankings, generating 9.9% of the total. China also led the world in technological patent applications, filing about 440,000 artificial intelligence (AI) patent applications from 2018 to 2021.
13. Daily mobile data usage in Singapore stood at 237,000 GB during the third quarter of 2023.
(Statista)
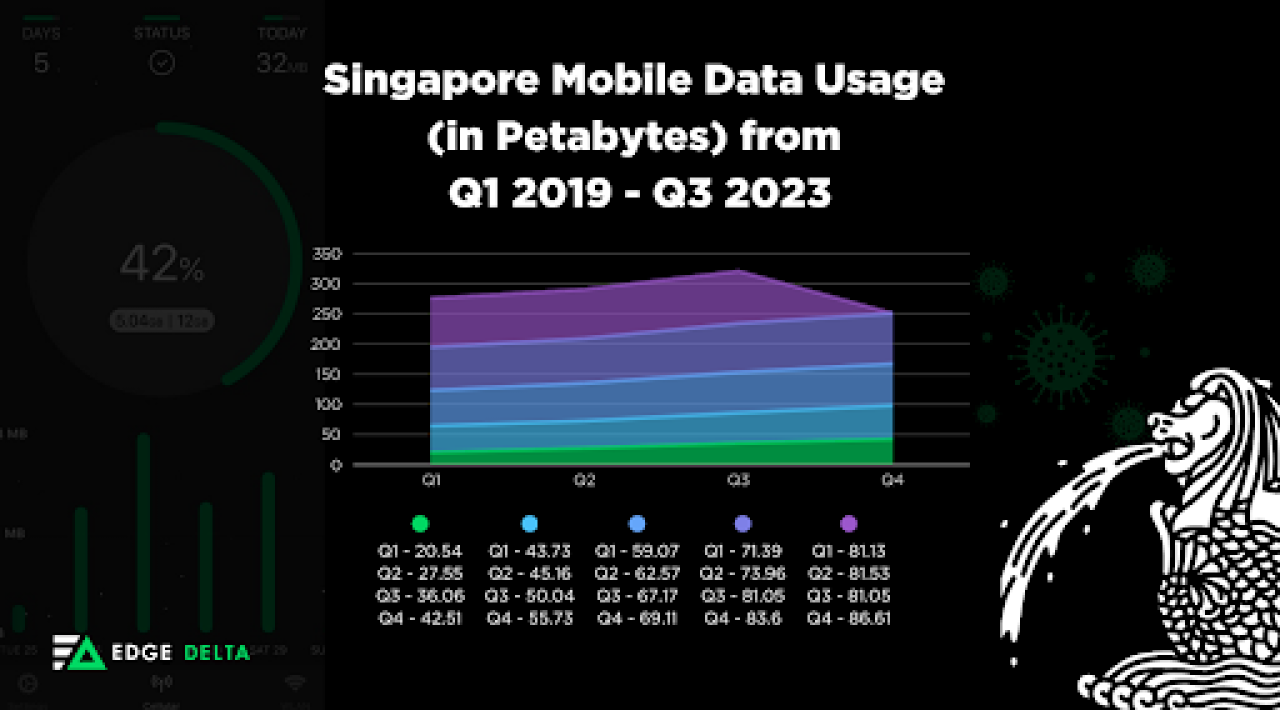
In 2019, the Lion City recorded 20.54 PB of usage, which reached 86.61 PB in Q3 of 2023. Despite the country’s expansion of public WLANs for its citizens, mobile data growth remained on the rise.
Data Generation Projections and Trends in 2024
Technology and progress are interconnected. The more the world changes, the more technology and data adapt. On the other hand, data creation also adapts to the changes the world experiences.
Many factors drive the growth and changes in how data is treated, stored, managed, and created. Data creation has experienced exponential growth, from 2 ZB in 2010 to 64.2 ZB in 2020.
Let’s explore the projections and trends behind data creation by diving deep into the statistics and facts that drive the evolution of data generation.
14. Analysts project the global data generation to grow to approximately 0.495 ZB daily in 2025
(Statista, Seagate, Insight Slice)
From 2019 to 2020, the global “datasphere” grew significantly, from 41 ZB to 64.2 ZB, a 56.58% increase. The numbers amounted to 0.18 ZB of data created daily. Experts attributed the growth to COVID-19, which caused people to stay at home and use more internet-related products.
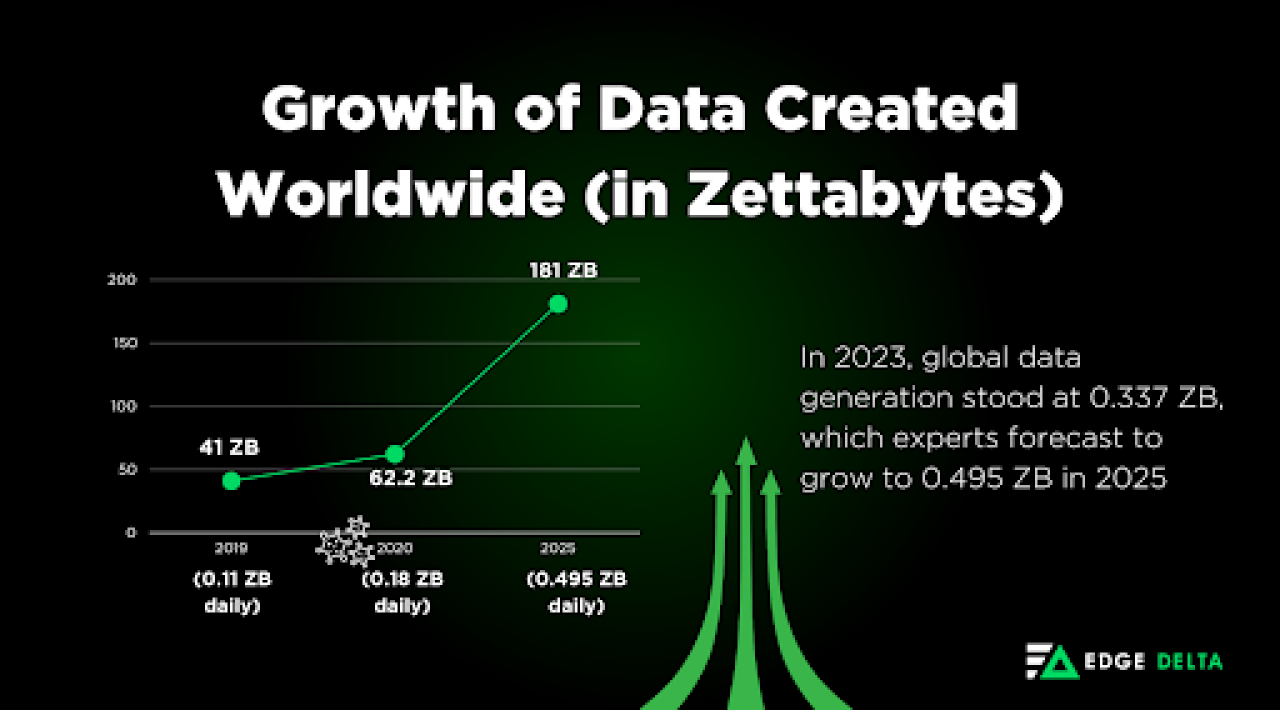
Another study claimed that the global data generation volume would increase 150 times by 2027 compared to 97 ZB in 2022. According to the report, by 2032, this number is expected to increase 300 times above the data collected in 2027.
15. The synthetic data generation industry shall grow to around $2.1 billion by 2028.
(Markets and Markets)
The synthetic data market amounted to just $0.2 billion by the end of 2022, which grew to $0.3 billion in 2023. Experts project a CAGR of 45.7% over the forecast period, expecting the industry to reach $2.1 billion in 2028.
Definition
Synthetic data generation involves producing artificial data that resembles real-world data by utilizing algorithms programmed on real-world data samples.
16. Experts predicted the global healthcare data science market to generate around $63.97 billion by the end of 2023.
(USDSI, LinkedIn)
Data analysts foresee the healthcare industry’s increased demand for data generation as the sector can leverage data science to enhance the quality and efficiency of healthcare services.
Data generation for the healthcare sector also aims to evolve medical innovations, enabling the industry to employ personalized medicine and predictive analytics, two effective healthcare data science applications.
Final Words
The data creation landscape has thrived as countries continue to develop their data science sector, with regions establishing more data centers to support the growing data generation world.
The internet, data, and technology are all intertwined. As the global internet user base grows, daily internet usage also means more data shall be used, produced, and stored. While studies on data creation are limited, it’s only a matter of time before experts capture the data creation landscape and reveal the specificities of how much data the world produces daily.
List of Sources
- World Economic Forum
- Statista
- Statista
- Cloudflare
- Medium
- Statista
- Kinsta
- Statista
- Finances Online
- Bernard Marr
- Mint Mobile
- Woodward Avenue
- Statista
- Stack Overflow
- Verloop
- Statista
- TechCrunch
- Make Use Of
- Mint Mobile
- Statista
- The Video Animation Company
- Whistle Out
- Android Authority
- Statista
- Statista
- Statista
- Skill-Lync
- Tech Guard
- Forbes
- Statista
- Statista
- Statista
- Mint Mobile
- Statista
- Variety
- Domo
- Mediaclip
- Response MA
- LocaliQ
- Photutorial
- Photutorial
- Queensland University Technology
- GWI
- DataReportal
- Digital Music News
- Apple
- Statista
- World Economic Forum
- Domo
- World Population Review
- The China Project
- 21Jingji
- 36Kr
- Cloud Scene
- HKTDC Research
- Statista
- Statista
- Statista
- Seagate
- Insight Slice
- Markets and Markets
- USDSI


