Telemetry data comes in a variety of types — including log, metric, trace, and event data — and essentially limitless formats. Practically every tool or technology that is used in production environments constantly emits telemetry data, and at modern-day scale this can mean complete chaos.
Telemetry pipelines have emerged as a powerful solution to control telemetry data at scale, by appropriately handling its collection, processing, and routing. Additionally, telemetry pipelines are highly configurable. They can be tailor-made for any scenario, and as such teams must first properly architect their pipelines to ensure they’re able to provide maximum value and handle their specific telemetry needs.
In this blog post, we’ll discuss in detail how to architect a telemetry pipeline, cover key architectural principles, and walkthrough a step-by-step guide for constructing a pipeline solution from scratch. We’ll also include a real-world example, by applying these principles to build an Edge Delta Telemetry Pipeline for a popular telemetry data use case.
Telemetry Pipeline Architectural Principles
A telemetry pipeline solution must efficiently collect data from the relevant sources, properly process it, and route it to the appropriate downstream destination(s).
The two most important performance metrics for telemetry pipelines are effectiveness and efficiency; in other words, they must collect, process, and route telemetry data accurately, and do so at minimal cost. Therefore, from a functional perspective, the goal of the pipeline architecting process is to construct a telemetry pipeline that can maintain the utility and integrity of data processing at the most optimal computational cost.
So, how do we reduce computational cost?
For one, computational operations should only be performed on the necessary parts of telemetry data. It is far less efficient to parse, filter, mask, or otherwise process data that contains hundreds or even thousands of fields instead of a few dozen. The solution here is quite simple: remove what isn’t necessary. Whenever data is processed in your pipeline, make certain that it has no extraneous fields or information before beginning processing.
Another way to reduce computational cost is to identify computational “hotspots” in your pipeline — that is, functions or operations that require significant computational effort. Once identified, determine if there are ways to reduce the compute necessary to fulfill the functional requirements of that pipeline segment.
One common example is extracting log values via regular expression. Let’s imagine that you are using regex to extract a particular log field and perform multiple different upsert operations with it. Currently, you are parsing the log via regex before each individual upsert.

The problem?
Regexes are expensive to perform.
Instead of applying the same regex command within each separate upsert, we can perform the regex first, save the result locally (as an attribute within the log), and reference it within the context of each upsert.

The number of regex operations is reduced from three down to one, significantly lowering computational cost while ensuring full pipeline functionality remains. This is one small (albeit powerful) example of identifying and reducing the cost of computational hotspots, by cleverly re-architecting the telemetry pipeline.
Furthermore, you must have a comprehensive understanding of your organization’s data requirements to properly architect an effective telemetry pipeline. This can include business-driven factors to reduce operational cost, legal mandates that must be adhered to, and security concerns, to name a few. Once confirmed, you can begin building a conceptual model of your pipeline and address each requirement as necessary.
(Read more about efficient pipeline design in our docs: https://docs.edgedelta.com/efficient-pipeline-design/ )
Step-by-Step Guide for Architecting Telemetry Pipelines
With these architectural principles in mind, let’s now go through a step-by-step guide on how to architect an Edge Delta Telemetry Pipeline. Consider the following set of logs which, for the purposes of this scenario, we can say are being emitted from a single application source running in some environment:
{"timestamp": "2024-09-16T01:55:00.745903Z", "logLevel": "ERROR", "serviceName": "APIGateway", "nodeId": "node4", "message": "Incorrect password, user failed to authenticate.", "clientIP": "192.168.1.202", "username": "user982", "event": "login_failed", "outcome": "failure"}{"timestamp": "2024-09-16T01:54:51.192456Z", "logLevel": "INFO", "serviceName": "DataService", "nodeId": "node3", "message": "The user has logged in successfully.", "clientIP": "192.168.1.166", "username": "user209", "event": "user_logged_in", "outcome": "success"}{"timestamp": "2024-09-16T01:54:48.346160Z", "logLevel": "WARN", "serviceName": "InventoryService", "nodeId": "node4", "message": "Authentication process is taking longer than expected.", "clientIP": "192.168.1.248", "username": "user316", "event": "login_delayed", "outcome": "delayed"}#1 – Understand your telemetry data
Before beginning the architectural process, you must first fully understand the data that the workloads are generating. For instance:
- What type of data are we working with?
- What is the structure (types of fields, format type, etc), and are these data formats homogenous across data streams?
- What do you want the data to look like once processing is finished?
- What do you want to add or remove from the individual data items?
- Do you want to transform groups of individual data items into a net-new piece of data?
In this particular example, we have a single data stream with a homogenous structure, meaning each log is formatted the same. This log format contains a number of different fields, including “timestamp”, “logLevel”, “clientIP”, “username”, and more. Let’s say that in this scenario, we want to do a few things:
-
Standardize log data on the OTel schema
-
Process only data from “node4”, and send a full copy of raw telemetry to S3 for compliance
-
Normalize log data by:
- Masking the “clientIP” field
- Enriching each log with an attribute that matches the value in the “outcome” field
-
Create a new “Count_Error_Logs” metric that aggregates all “Error” level metrics across a one-minute window
#2 – Architect a conceptual design
After identifying the transformations that will be performed on your data, you can begin to create a high-level conceptual pipeline outline which fulfills all functional requirements. Consider the sequences and series of functions and paths you want to include, and understand how you want the pipeline to look after each step.
Here’s an outline of the corresponding telemetry pipeline, which accomplishes all functional goals mentioned above:

Before continuing on to the next step, check to ensure that all functional and data requirements are met with the pipeline outline. This is the most challenging part of this process — once you’ve identified a pipeline architecture that covers all the bases, mapping individual nodes onto it is a far simpler process.
Note that this step doesn’t require jumping into the weeds of individual processor nodes and transformation logic — it is a much more abstract process that allows you to map specific nodes onto it once you’ve created the full picture.
#3 – Implement the design in Edge Delta
Once you’ve confirmed the outline, it’s time to create the real pipeline!
It’s important to mention that not all telemetry pipelines are built equally. There are a number of ways teams can go about implementing their pipeline solution, and some methods are much more challenging than others.
For one, building homegrown pipelines is an incredibly arduous process — teams must allocate time and energy to manually construct configurations to properly collect, analyze, and route data, which only becomes more difficult at scale. On the other hand, utilizing a pipeline product from a premium observability vendor might work, but it is not financially sustainable over time.
Edge Delta’s Telemetry Pipelines make building and managing pipelines easy, enabling you to quickly build pipeline solutions that reduce telemetry cost and provide you with complete control over all your telemetry data. Additionally, Edge Delta’s Visual Pipeline Builder makes creating telemetry pipelines an incredibly simple, drag-and-drop process; just add an agent fleet into your environment and jump right in:
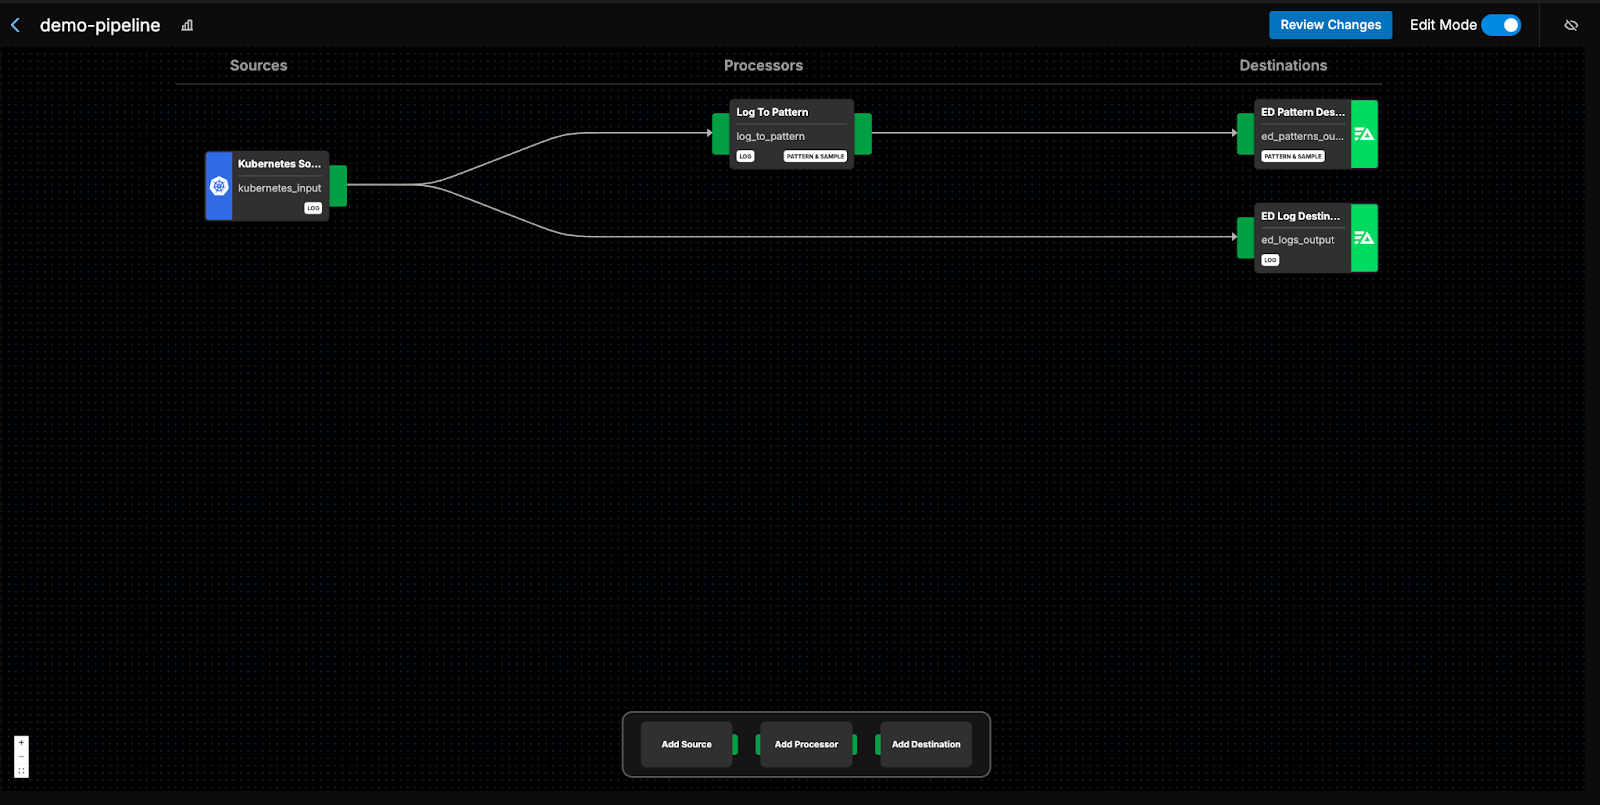
Let’s modify the pipeline to align with the outline we created in the previous step:
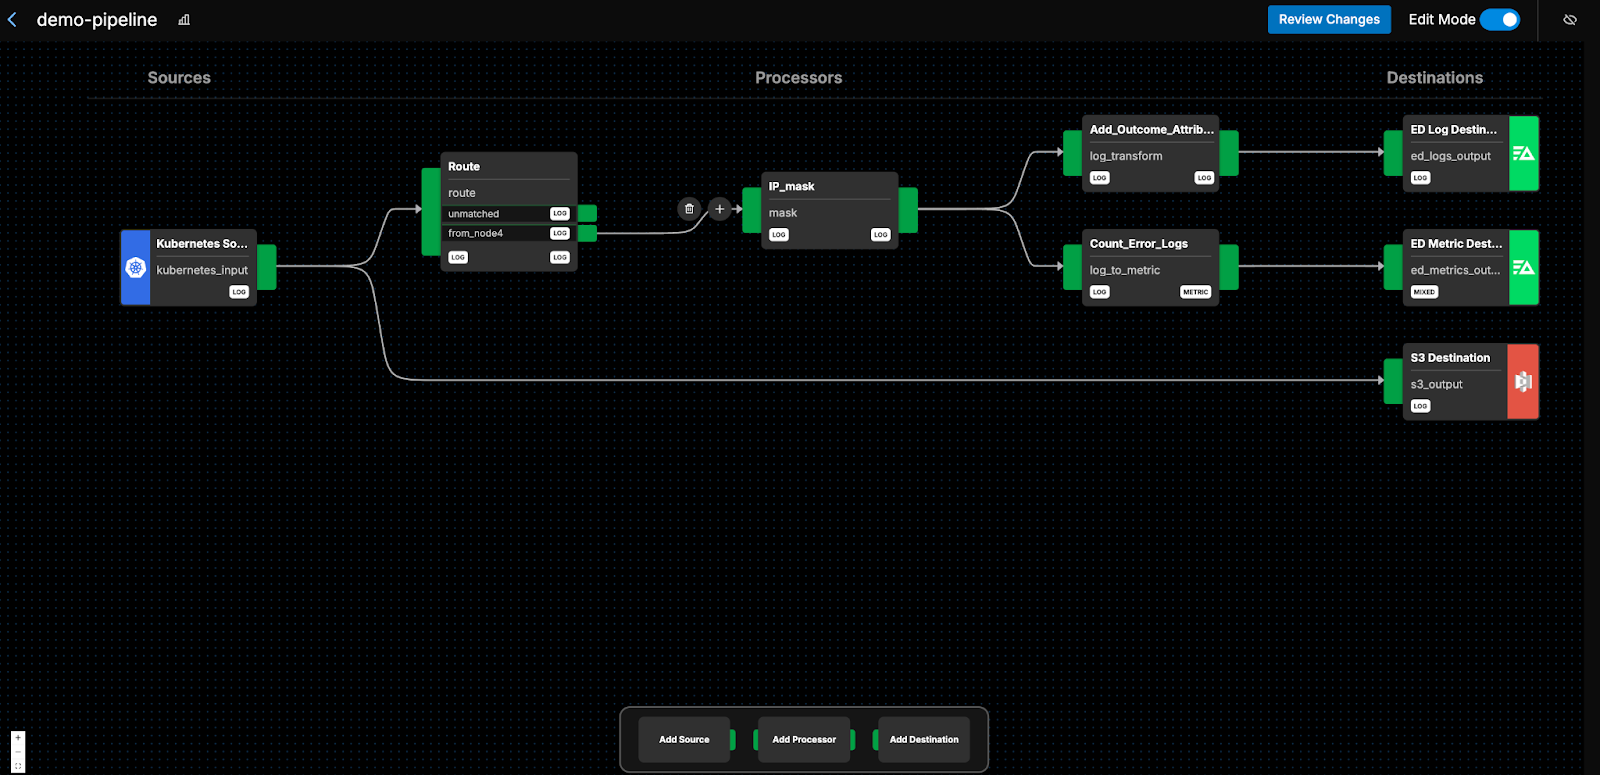
We begin by ingesting the log data into the pipeline, and immediately send a full copy to S3 for compliance purposes. We create an identical stream that runs through the “Route” node, filtering out all logs that aren’t from “node4”. We then mask the remaining logs’ “clientIP” field, before creating two new identical egress streams.
The first stream enriches the log messages by adding an “outcome” value in the “attributes” path, and the second stream converts logs into metrics by counting up all “error” logs every minute. These streams are then shipped off to their respective destinations.
And formatting to the OTel schema? Edge Delta automatically reformats logs to the OTel schema upon ingestion — no extra work required!
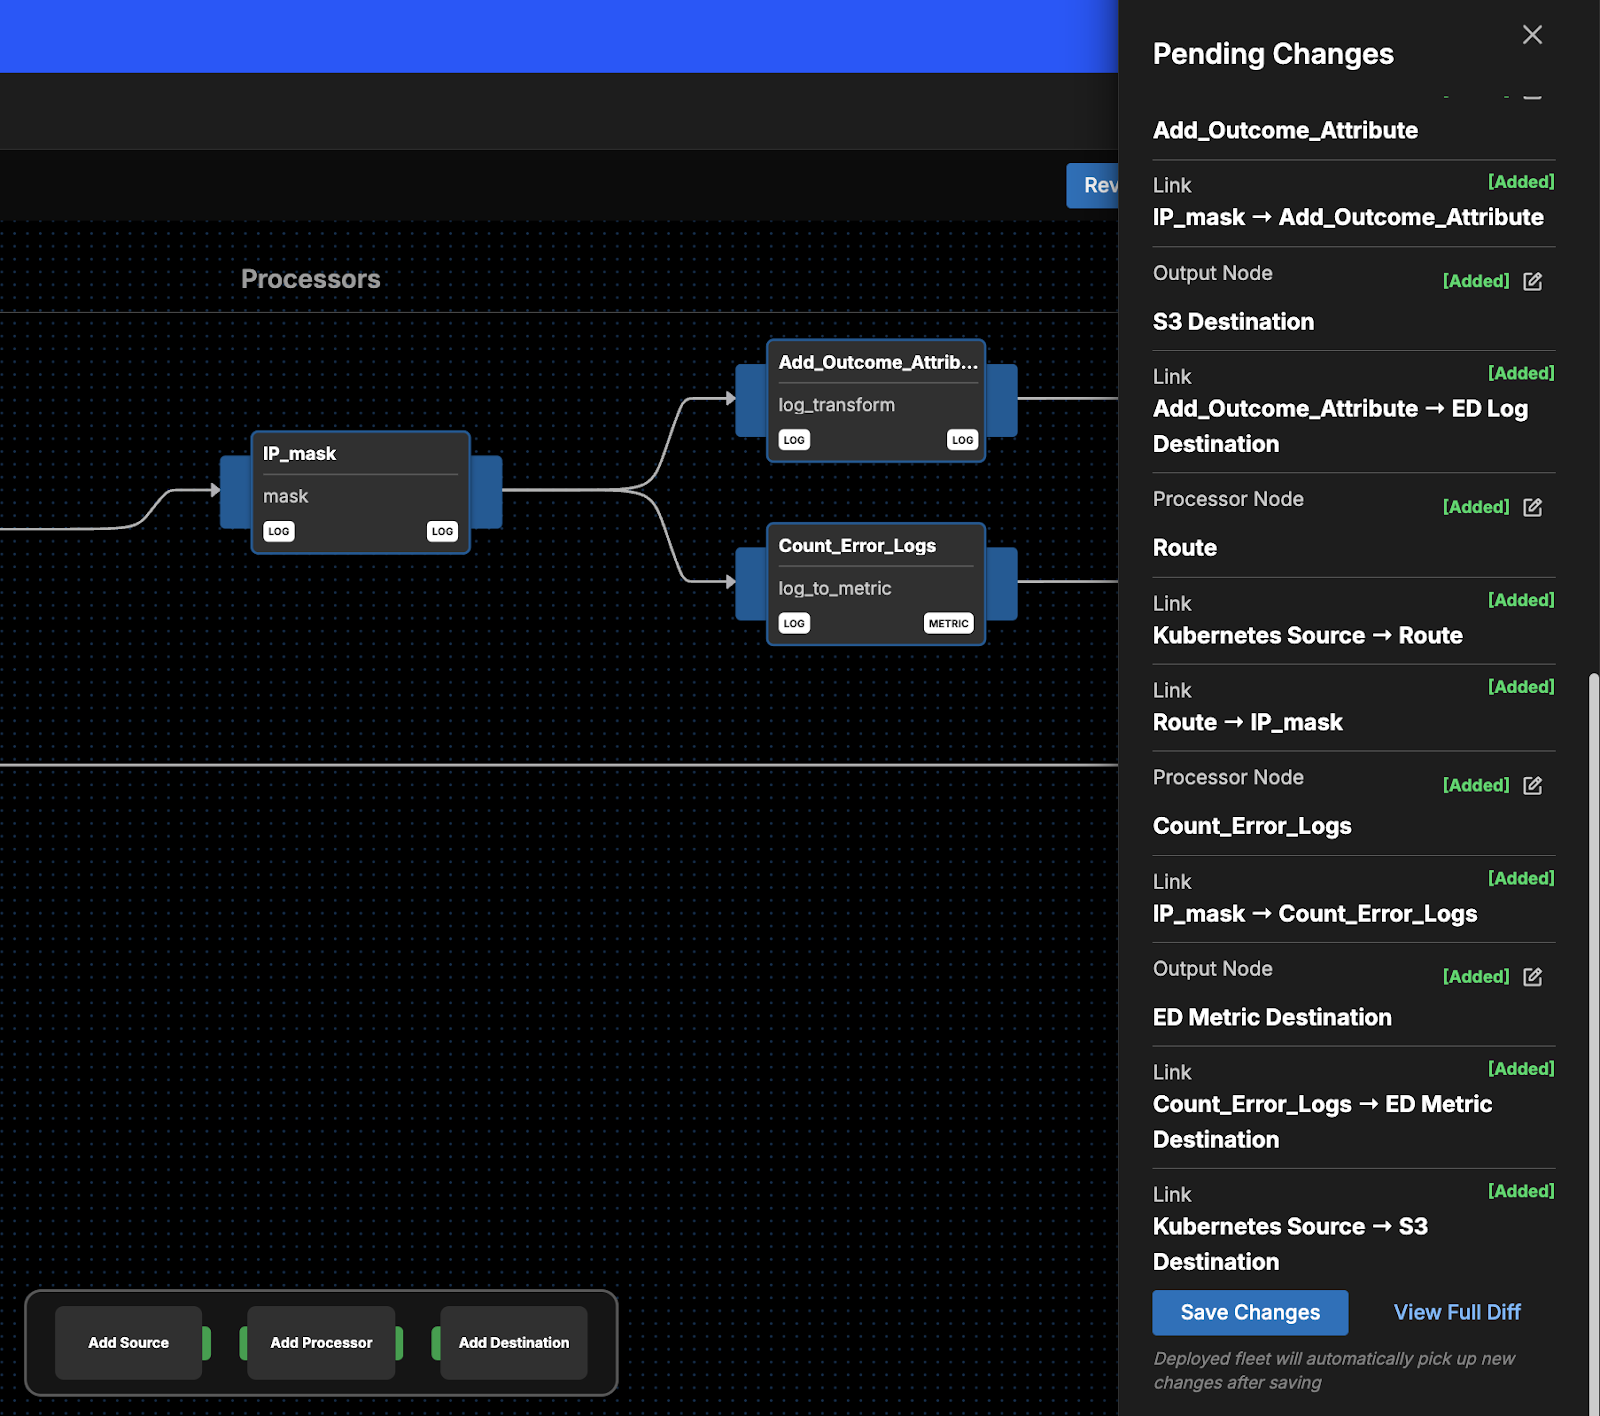
In a matter of minutes, we have a fully functioning Telemetry Pipeline within Edge Delta. And before publishing this pipeline, you can review all changes to ensure everything looks as expected:
(For a more technical dive into this process, visit our docs: https://docs.edgedelta.com/design-test-nodes/#efficient-pipelines)
Telemetry pipelines are powerful tools which, when used correctly, provide you with complete control over your telemetry data.
As with any highly-configurable tool, it’s imperative that you give considerable forethought to what your telemetry pipeline will look like before integrating it into dynamic, real-world environments. Spending time architecting a pipeline requires some investment up front — but a functioning pipeline with fewer issues to sort out will save you significant troubleshooting time down the road.
Want to give Telemetry Pipelines a try? Check out Edge Delta’s playground environment. For a deeper dive, sign up for a free trial!

