

Traditional monitors and notification systems often behave like a refrigerator: the door opens, the light turns on; the door closes, the light turns off. This approach is functional but limited — especially in dynamic, distributed environments, where failures can span multiple system components.
Some observability platforms offer “full-stack” monitoring with more advanced capabilities, such as correlation, root cause analysis, and automated resolution, but they typically leverage proprietary data formats, which leads to vendor lock-in. This is a major limitation for teams that work across multiple tools, environments, and data types and for whom consolidation on a single platform is unrealistic.
Edge Delta takes a different approach.
Rather than forcing consolidation, Edge Delta embraces your existing stack for a flexible, unified approach to observability. Our Telemetry Pipelines can be deployed at the edge, in the cloud, or within your core infrastructure, and they can ingest and process logs, metrics, traces, and events from any source. This data can then be enriched, tagged, and correlated, which enables teams to define custom equations and thresholds that support nuanced, context-aware alerting.
Ultimately, this flexibility empowers organizations to reimagine how they define alerts and notifications, building logic and context that align with their environments — not a vendor’s limitations.
In this post, we’ll show how to lay the groundwork with tags and custom metrics. Then, we’ll walk through how to build precise monitors that factor in multiple signals — and how to use conditional logic to route the right notifications to the right teams.
Understand and Classify Your Data
Once data is ingested into the Edge Delta platform, you can either leave it in its raw form or enrich it with additional context and structure. This includes actions like tagging and creating custom metrics, both of which make your data more actionable and easier to analyze.
Adding Tags
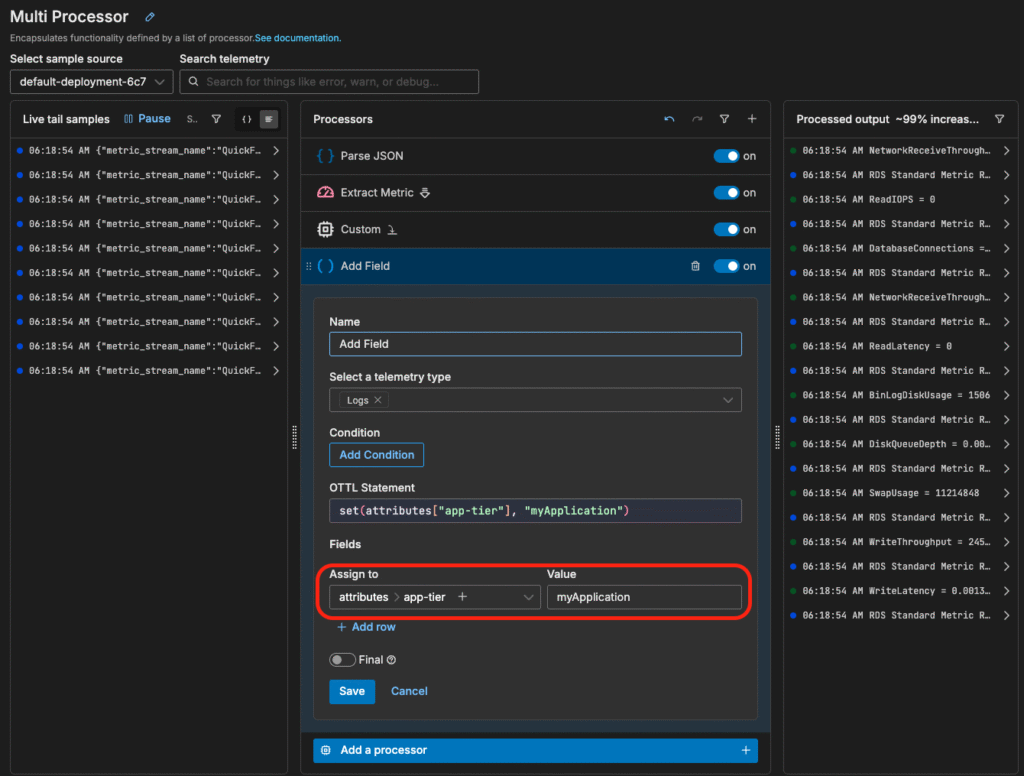
Edge Delta’s built-in processors make it easy to add tags to your data at any point in the pipeline. Tags can be applied to all data or to specific data based on relevance, enabling more precise filtering, correlation, and routing of observability signals:
Extracting Metrics
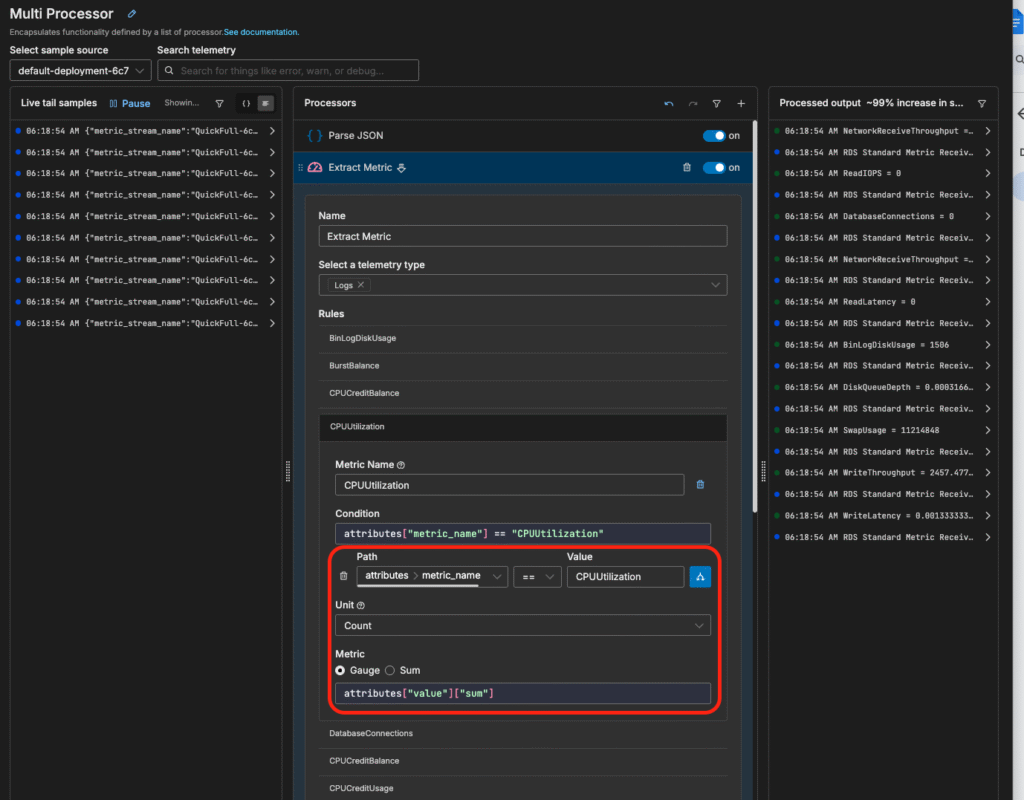
You can also extract metrics directly from your data. For example, if a log entry contains CPU utilization values, Edge Delta can parse that information and convert it into a time series metric, enabling you to visualize trends, create alerts, or correlate it with other telemetry data:
By leveraging tagging — either by adding new tags or utilizing existing ones in your data — and summarizing the data through metrics, you create a structured foundation that’s ready for correlation and deeper analysis.
Create Nuanced Alerts with Custom Formulas
With Edge Delta, you can apply custom formulas to correlate multiple types of observability data — such as logs and traces — and define nuanced thresholds based on your unique requirements.
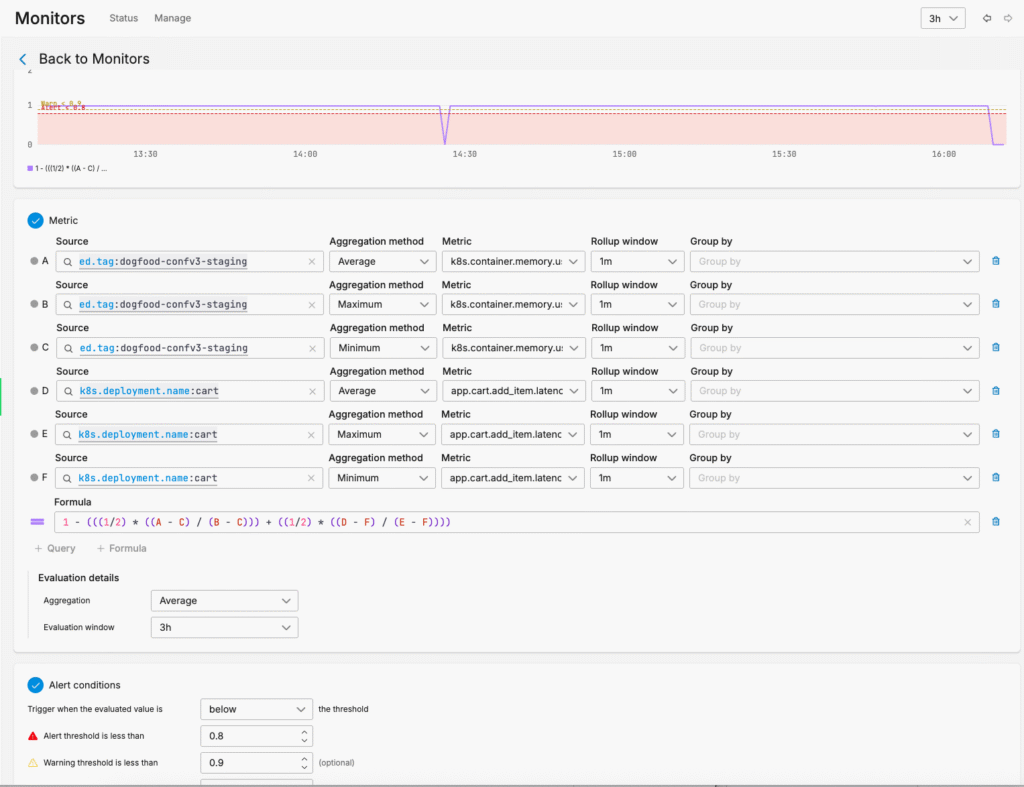
For example, instead of monitoring memory usage in isolation, you can create a monitor that correlates log-based memory metrics with trace-based latency data to trigger alerts only when both conditions indicate an issue. In this case, we want to say:
“Only notify me when memory usage is higher than expected and transaction latency is slower than normal.”
Here’s how we might define that logic using a health score:
Normalized score = 1 - (w1 * normalized_memory_usage + w2 * normalized_latency)

Where:
normalized_memory_usage = (memory_used - min_mem) / (max_mem - min_mem)
normalized_latency       = (latency - min_lat) / (max_lat - min_lat)

w1 and w2 are weights (e.g., 0.5 each)- A score close to 1 indicates a healthy state.
- A score below 0.9 triggers a warning.
- A score below 0.8 is considered critical.
This approach can be applied at the service or organization level, depending on your specific needs. It gives you fine-grained control over alerting logic and removes the guesswork from threshold setting — essentially enabling you to “boil the ocean” with precision.
While other vendors may offer similar scoring mechanisms, they often lack flexibility. Either you can’t adjust the logic, or you only have limited control over the variables. Edge Delta changes that. It gives you full ownership of your observability data, letting you define what “normal” and “critical” mean for your environment.
Only Notify the Appropriate Teams
Not every alert needs to go to everyone, and with Edge Delta’s flexible notifications, they don’t have to. It’s like having a first responder built into your pipeline.
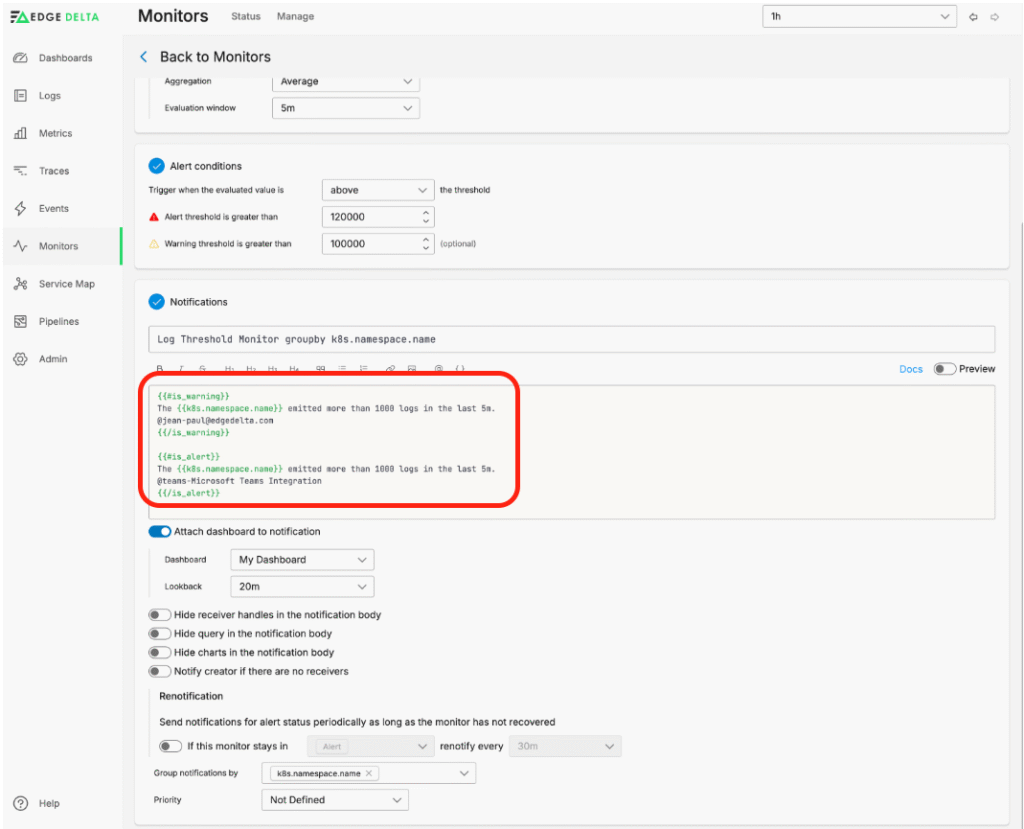
Using conditional formatting variables, Edge Delta can determine the severity of an event and route notifications accordingly. For instance, you might configure a warning to be sent directly to a specific team via email. However, if something truly critical occurs, that alert can be escalated to a collaboration app channel to ensure the right people are looped in as quickly as possible.
Edge Delta offers a wide range of built-in integrations with chat apps and notification tools, but our webhook support means you aren’t locked into them. You can plug into just about any tool or system that accepts an HTTP request.
For more information on how to set this up, please refer to Edge Delta’s documentation for monitors, thresholds, and notifications.
Conclusion
In today’s complex, multi-tool environments, traditional observability platforms often fall short — either limiting flexibility through vendor lock-in or requiring heavy upfront investment and full-stack integration. Edge Delta flips that model by meeting you where you are, empowering you to work with the tools and data you already have.
With Telemetry Pipelines at its core, Edge Delta allows you to ingest, enrich, and correlate logs, metrics, traces, and events from any source. By enabling custom tagging, metric extraction, pattern recognition, and cross-data-type correlation, Edge Delta helps you move from reactive monitoring to proactive, intelligent observability.
You’re no longer constrained by what a single vendor thinks is important. You define what matters. Whether it’s setting alerts that trigger only when multiple conditions are met or sending context-rich notifications to the right teams at the right time, Edge Delta gives you full control without complexity or lock-in.
If you’d like to experiment with Edge Delta’s alerting capabilities, check out our free, interactive Playground. You can also start a free trial.


