


Tracing and logging are two concepts associated with computer science that serve different purposes in software development, security, and observability and monitoring.
Logging showcases events related to changes in a system’s state. The logs show a history of specific instructions executed by each system component. In contrast, tracing records a request or transaction as it travels across system components. Each trace describes communication between components, indicating who communicated and what was communicated.
This article provides an in-depth discussion of logging, tracing, and related examples to help you better understand.
Key Takeaway
- Tracing records the journey of a request or transaction traversing system components.
- Logging records events, activities, or operations that occur within a stem, containing details such as the timestamp and source.
- Overhead cost can be introduced when tracing is widely used.
- The severity of events when logged in to a computer system can be determined by log levels.
- The intricate pathways of requests across services are illustrated by tracing while logging delves into specific events.
The Key Difference of Tracing vs. Logging
Tracing and logging are both helpful in monitoring the performance and health of modern software systems. Although logging and tracing involve capturing information during program execution, their primary distinctions lie in their objectives and the level of detail they provide. The table below shows the key differences between these two concepts.
| Aspect | Logging | Tracing |
|---|---|---|
| Purpose | Records events related to the system to cater to possible changes in the system. | Records interactions between systems and components. |
| Content | Records of events with a timestamp and contextual payload. | Provides timestamps and contextual payload with additional information on the source and destination of interactions. |
| Level of Details | Varies according to instrumentation and can be filtered by log levels. | Captures detailed and precise interaction events between components. |
Discover what tracing is, its types, level of detail, and more in the following section.
What is Tracing?
Tracing details the journey of a transaction or a request as it passes through different components of your distributed environment. A trace delivers a detailed view of the transaction or request’s interactions. This can include:
- The sequence of operations
- The components that it interacted with
- The duration of each interaction
Tracing is one of the three pillars of observability. With trace data, you can understand how your application performs and track which programs are running and where the latency occurred within the system.
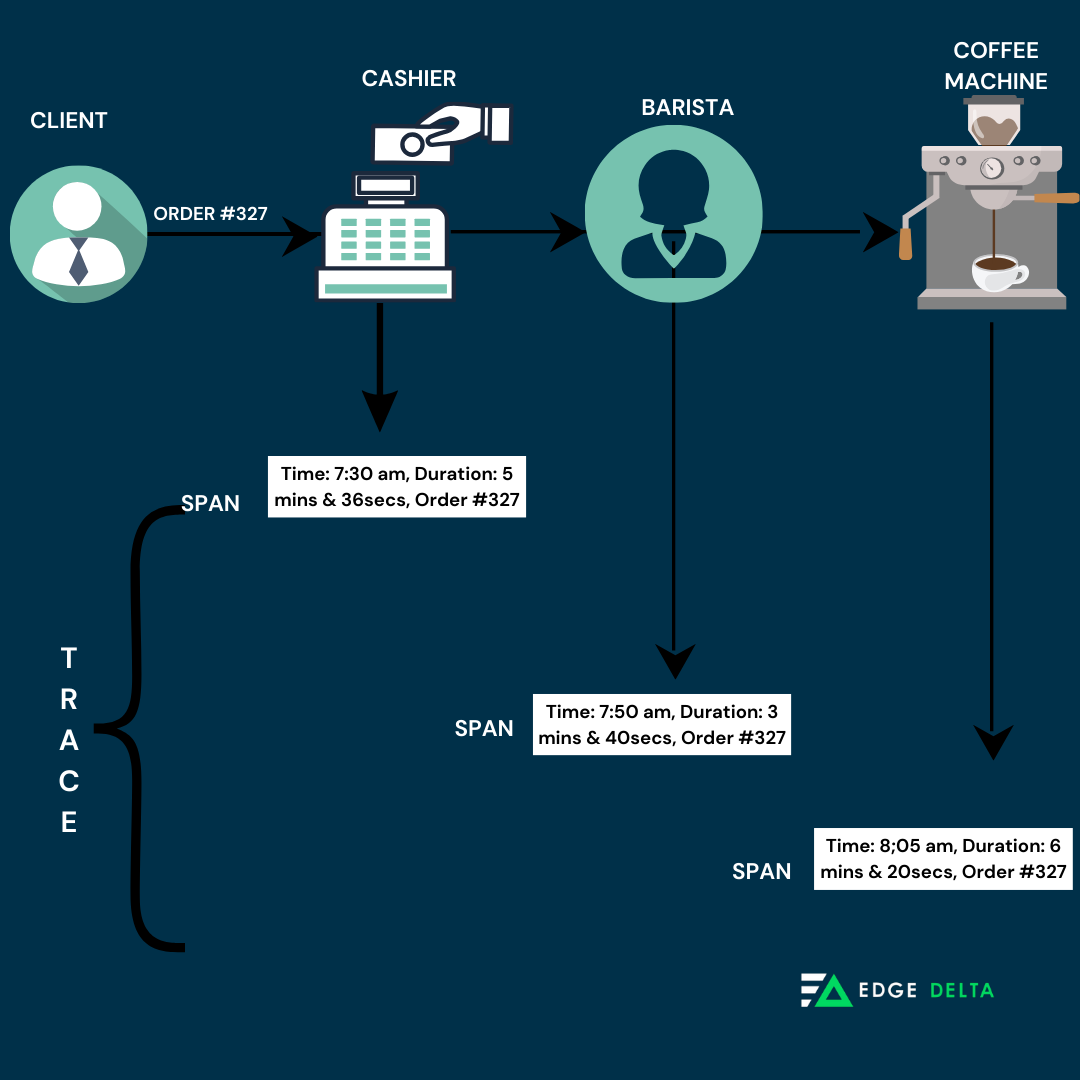
This tracing method has a unique identifier for each piece of data that travels together; each lifecycle is recorded through microservices. When a trace is started, a parent span or the operation representation is generated to represent the entire transaction. If a transaction comprises different operations, a span is created for each transaction. Additional spans are made if these operations are added and break down even more.
Each span records the operation’s time and other valuable attributes, allowing users to identify every request and process, the time each took, and the order in which they occurred. Here’s an illustration showing the tracing process in the cafe system.
Systematic Profiling and deep debugging are made easier with tracing as it provides a selective and distributive approach that focuses on specific events or transactions. By tracing through a stack, developers can determine jams and focus on improving performance.
To better understand the concept of tracing, read the following section.
The Different Types of Tracing
Tracing provides diverse details and complements logs. It tells users about the interactions between services and components. Developers use different types of tracing, including:
- Program tracing: A method developers use to examine the addresses of infrastructures and variables signaled by an active application. It enables developers to diagnose issues like memory flow and excessive resource consumption.
- Code tracing: A process that inspects the flow of source codes in an application when performing a specific function.
- End-to-end tracing: Tracks data transformation together with the service request path. When an application commences a request, it sends data to other software components for further processing.
Tracing Granularity
The tracing granularity refers to the ratio of computation to communication—and also, in the classical sense, to the breaking down of larger holistic tasks into smaller, more finely delegated tasks.
Different tracing backend stacks support varying granularity on timestamps, which mark the beginning of tracing spans. This increases the granularity in tracing, which can be coarse-grained or fine-grained, depending on the tracking unit.
- Fine-grained: Detailed, capturing every function call
- Coarse-grained: less detailed, capturing only high-level events.
The Level of Details of Tracing
Distributed tracing provides end-to-end visibility. Its process includes an HTTP request, then a call to a database, or executing a message from a queue. When a problem arises, tracing allows developers to see the following
- Which function entry and exit
- The function’s duration
- Parameters passed
- Variable values
- Timestamps
- Memory usage
- How deep into the function the user could get.
The following level of detail helps programmers and end users understand their program’s exact behavior and performance characteristics. It thus provides end-to-end visibility into a request’s flow by capturing timing and contextual information as it moves through various services and components.
Performance Impact of Tracing
Among the many benefits of tracing, it also has several drawbacks, one of which is that it can introduce overhead.
Introducing tracing often involves adding extra code or instrumentation to capture relevant data. This can increase complexity and potentially introduce performance overhead, necessitating careful management. While tracing is highly informative, it should be used judiciously to avoid significant performance degradation.
Use Cases of Tracing
Tracing, specifically distributed tracing, has become prevalent due to the rise of microservices and large-scale cloud systems. Distributed tracing provides end-to-end visibility and tracks a request’s journey across numerous services, visualizing its interconnected paths and unveiling confidential insights.
The most prominent use cases for distributed tracing include:
- Profiling: Identifying performance bottlenecks and optimizing your code for efficiency.
- Troubleshooting and Debugging: Helps identify slow response rates and other performance concerns across numerous services, systems, and components in real time. Developers can trace a request as it travels through numerous services and pinpoint where problems are occurring.
- Performance Optimization: Optimizes slow or inefficient code, reducing latency and improving performance.
- Real-time System Monitoring: Used in systems where real-time performance tracking is critical.
- Root Cause Analysis: This method determines the root cause of issues, including system oversight and performance problems, by supplying end-to-end visibility of requests and transactions across diverse services and components.
- Capacity Planning: Recognizes performance bottlenecks and service dependencies, allowing organizations to plan for and allocate resources accordingly.
- Compliance and Security: Tracks and monitors usage and data access, ensuring compliance with regulations and security policies.
Understanding how racing is used is crucial for optimizing performance, troubleshooting complex issues, and ensuring the smooth operation of your microservices ecosystem. The following are some examples of distributive tracing in real-life applications.
Example #1: Autonomous Vehicle Control System
In autonomous vehicles, tracing in distributed systems streamlines monitoring communication and control signals among interconnected vehicle components.
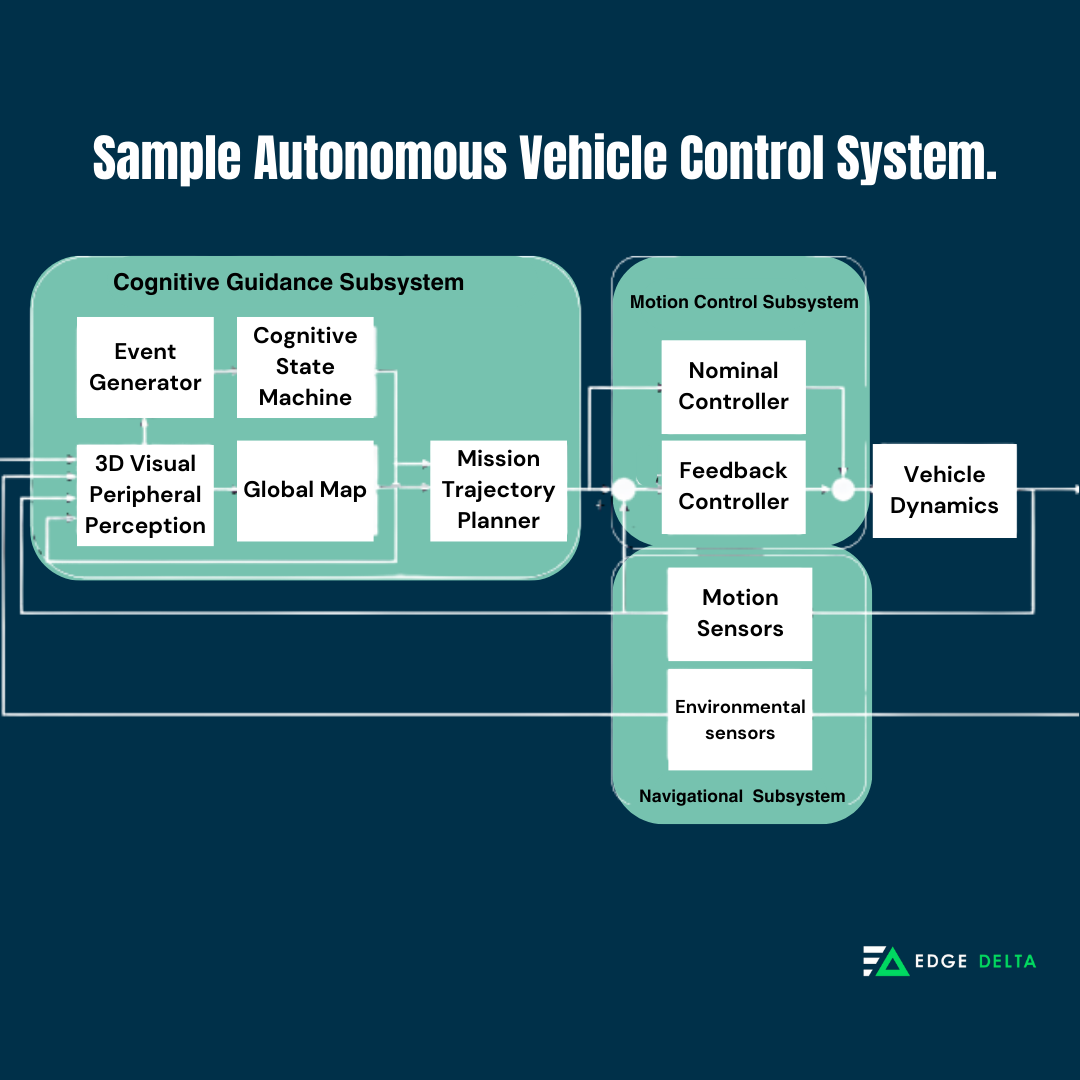
By leveraging distributed tracing, engineers gain critical insights into the performance of distributed control algorithms, providing safe and efficient automobile operations in complex, real-world scenarios.
Example #2: Tracing in Healthcare Data Analytics
Within healthcare data analytics, tracing offers valuable visibility into the interchanges between distributed data processing channels and machine learning models. This understanding enables healthcare practitioners to identify and address performance inefficiencies, enhancing the accuracy and efficiency of diagnostic and predictive AI models.
The diverse applications of distributed tracing underscore its pivotal role in optimizing AI operations across various industries and use cases, fortifying its position as a cornerstone of operational excellence within distributed environments.
Now that you have learned about tracing in computer science, its applications, and specifications, read on and discover important aspects of logging.
What is Logging?
Logging automatically produces a timestamped record of events relevant to a specific system. Software applications and systems produce log files, which are aggregated in log management systems and SIEM solutions for analysis. They can be generated in various formats, including plain text, XML, JSON, and syslog. Additionally, logs can originate from multiple sources, which include:
- A server
- Application/software
- Client
The purpose of log files is to generate events and messages and serve as a historical record for analysis and troubleshooting. They also show whether resources are performing correctly and optimally.
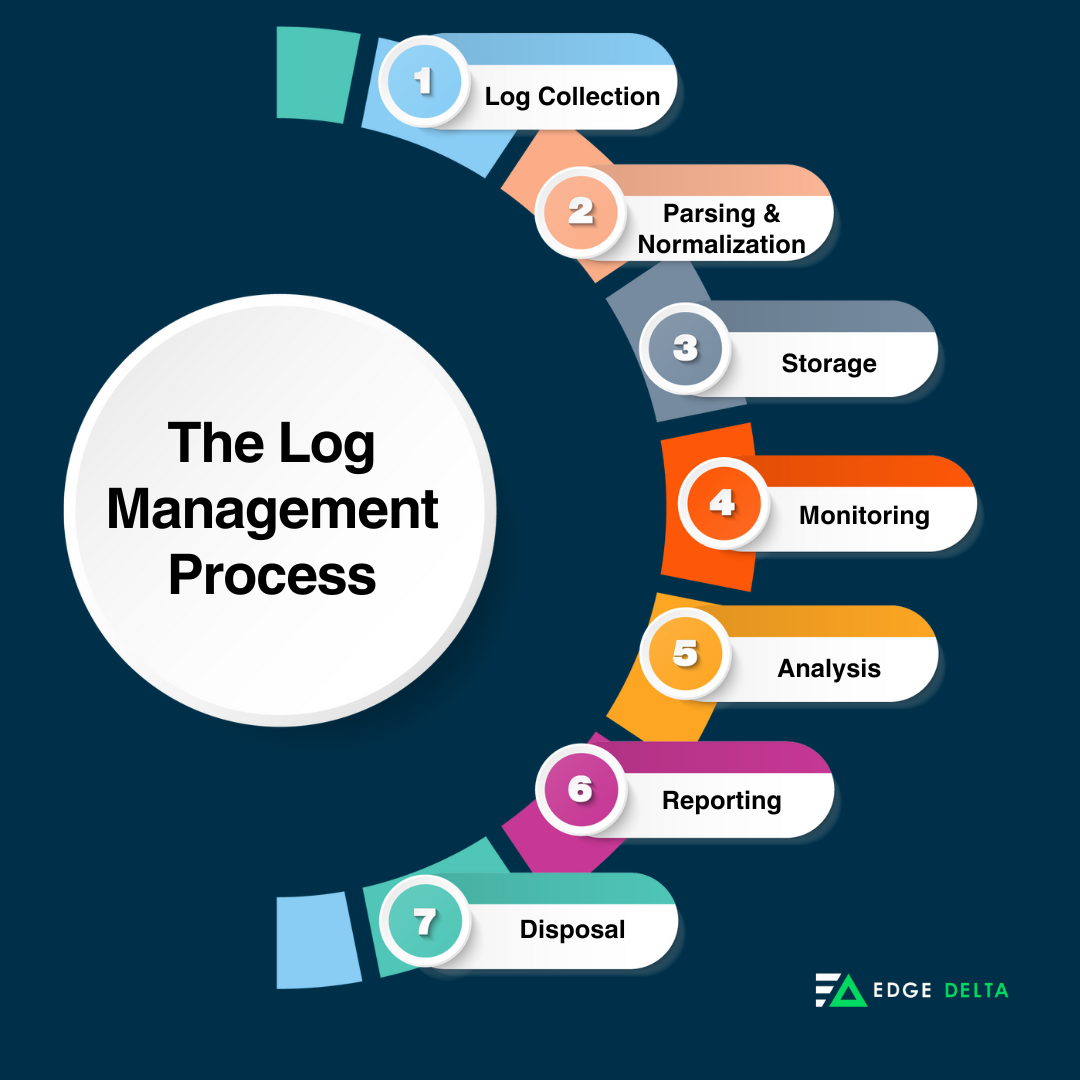
The Log Management Process
The log management process continuously gathers, stores, processes, synthesizes, and analyzes data. Typically, the logging process includes the following:
- Log Collection: Collecting log messages from diverse systems into centralized locations.
- Parsing and Normalization: Converting logs into normalized and standardized formats.
- Storage: Where logs are stored in centralized systems for real-time and long-term analysis.
- Monitoring: Logs are monitored in real time for potential issues or security breaches.
- Analysis: Logs are analyzed for system monitoring, security, and troubleshooting purposes.
- Reporting: Features of logs are reported, which allow for the creation of detailed reports on system activities.
- Retention/Disposal: Where logs are retained for a specified period and disposed of accordingly when not in need.
In the following section, you will discover the different types of logging, their performance impact, and more.
The Different Types of Logging
There are different types of log files, each serving a specific purpose in monitoring, troubleshooting, auditing, and analyzing activities within systems, applications, and networks to maintain operational efficiency, security, and compliance. Here are the different types of logging:
- Security Logs: These logs are complex computer systems that handle sensitive data. They usually maintain logs of critical information to guarantee data integrity and monitor access attempts.
- Authentication, Recognition, and Access Logs: Logs that record user access to a system are often called log-in or log-on events. These logs are stored in a designated file and can be examined to detect anomalies and identify issues related to user access.
- Application Logs: Many applications generate logs that record application-specific events and can be utilized as a protocol for tracking input and output.
- Database Logs: Database management systems (DBMS) record database operations, such as record insertion, updates, and deletions. Depending on the system configuration, these logs can also capture other types of information.
- System Logs: Network servers log essential events between the operating system and its clients through its logging mechanism. They can, for instance, log the beginning and end of each service and any unusual circumstances.
Logging Granularity
The logging granularity varies significantly depending on the logs captured in every event and its logging level. Events come in many shapes and sizes. Here are some examples of events:
- An HTTP request hitting an API
- A CPU instruction is being performed
- A database operation completing
- A batch job is running
The Level of Details of Logging
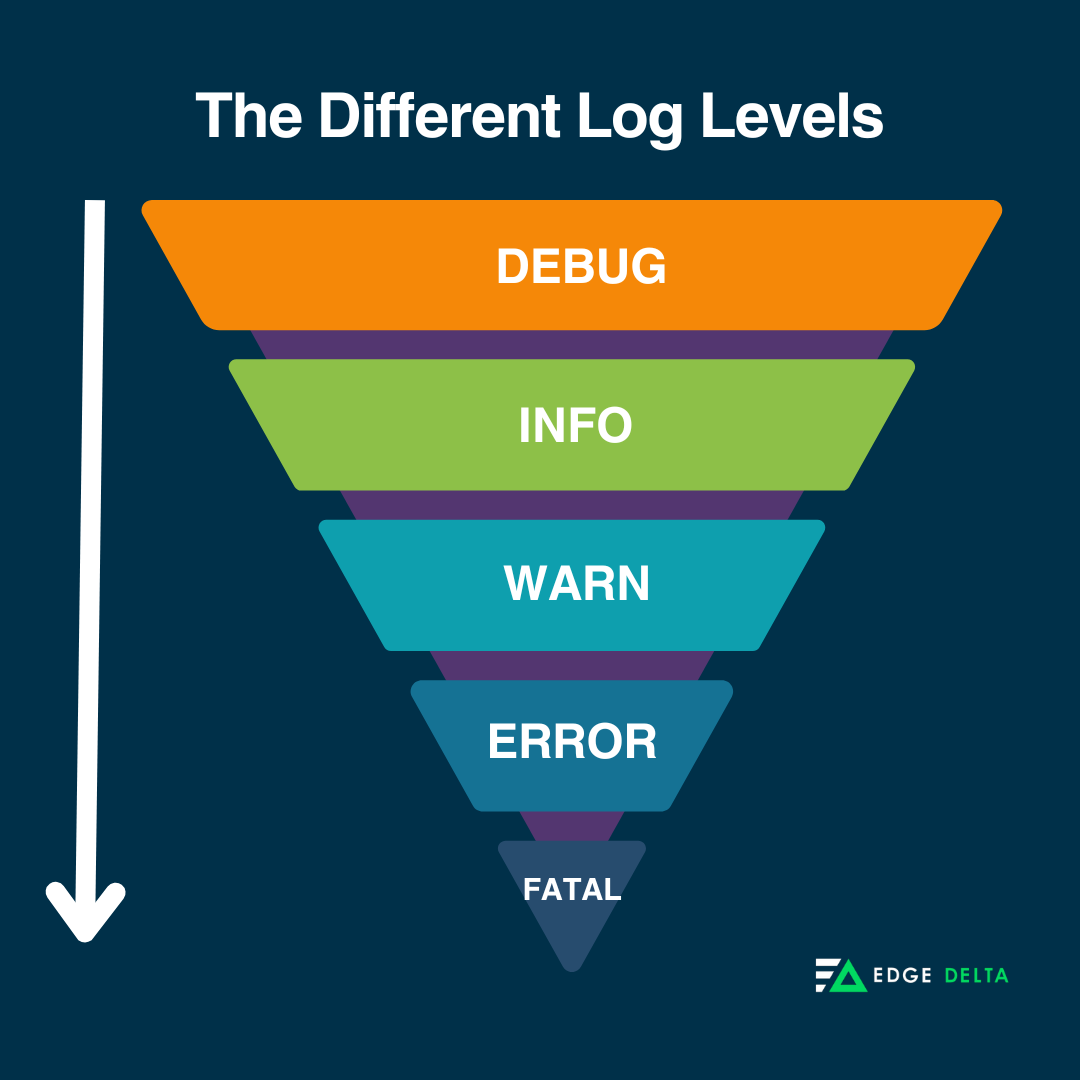
Logging levels indicate the severity of events when logged in to a computer system. They are also beneficial for alerting purposes, filtering, and restricting the amount of information displayed during searches and troubleshooting activities. Categorizing events into levels gives importance, as only the most significant can be recorded and ignored in real time.
Each message in an application log has different levels of severity or urgency for logging. These levels allow administrators to distinguish messages that indicate normal functioning from those that suggest potential issues and allow for dynamic control over log output volume.
Choosing the appropriate log level helps administrators filter and prioritize log messages; the different logging services include the following:
- Debug: Detailed information for deep-dive analysis (rarely used in production).
- Info: Routine events and state changes in your application.
- Warn: Potential issues that take time to avoid failure.
- Error: Situations that prevent regular operation or cause unexpected behavior.
- Fatal: Critical errors that will terminate the application.
Performance Impact of Logging
Logs are indispensable for various reasons. These logs provide a chronological record of specific events and invaluable insights into how your application behaves under different events, which can be crucial for identifying and diagnosing issues.
While logging everything is tempting, excessive logging can have an adverse effect, leading to increased log management costs, reduced search efficiency, and noise.
Use Cases of Logging
Logging records vital events and messages microservices generate, tracks user activity, and captures errors. It provides valuable insights into:
- Error identification: Analyze error messages to understand the root cause of issues.
- Debugging: Use log statements to inspect variables and track code execution.
- Application behavior: Track the execution flow and pinpoint specific actions within your services.
- Auditing: Maintains a record of user activity and service actions for compliance or security purposes.
In IT operations, logs are predominantly used to monitor system performance, identify suspicious behavior, troubleshoot issues, and generate reports for security and compliance purposes. System administrators can use logs to detect unforeseen environmental changes and address potential problems or breaches quickly. Commonly, logging is used in the following cases
- Operational monitoring (for operators)
- Security and audit monitoring (for security engineers)
- Performance tuning (for application developers)
- Network logging (for operators)
- Infrastructure analysis and health assessment
- Analysis of repeated failed access attempts:
- Correlation and prediction of attacks in SIEM
- Restoration of previous system states.
In the following section, you will learn the benefits and limitations of logging and what to use between the two processes in your system.
Should You Use Tracing or Logging?
It is important to note that these two elements of observability—tracing, and logging—are not exclusive entities. Both data types are pillars of observability and most teams use tracing in tandem with logging. When tracing discovers a faulted service, developers will check the log files to pinpoint the exact problem, including the time it occurred and its effect on other related services.
Tracing illustrates the intricate pathways of requests across services, while logging delves into specific events.
Now that you have understood the benefits and limitations of tracing and logging, learn the general guidelines for when to use them.
When to Use Logging and Tracing
Suppose a digital marketing company conducts end-to-end testing. Customers complain about irregularities or downsides when purchasing digital products. To resolve this, developers must identify which application triggers the issue—this includes:
- Identifying whether it is the payment module
- The billing service
- The interaction of the billing service with the fulfillment service
Developers require both logging and tracing to understand the cause of an issue better. Logs can help them identify the problem, while tracing enables them to attribute it to specific applications. Tracing and logging can give developers powerful insights into services and systems, detect anomalies when they arise, and quickly understand the root cause of performance issues.
Bottom Line
Tracing and logging make monitoring, troubleshooting, and root-cause analysiseasier in today’s digital landscape. Both methods can give developers a concerted view of all the services running on your platform and provide a strong analysis of its health and performance.
Modern software systems demand vital monitoring to ensure health and functionality. Observability, encompassing logging and tracing, goes beyond mere issue detection to ensure system integrity, whether in monolithic or microservice architectures.
FAQs on The Difference Between Tracing and Logging
What is the difference between distributed tracing and centralized logging?
Distributed tracing is discerning data requests as they navigate through a distributed system. On the other hand, centralized logging is a process that involves collecting logs from infrastructure, applications, and networks and placing them in a specific location for storage and analysis.
What is tracing used for?
Tracing is mainly used for anomaly detection, fault analysis, debugging, or diagnostic purposes in distributed software systems, such as microservices or serverless functions.
What are log and trace files?
Logs and trace files contain essential information about system operations.

