


Metrics are a foundational part of any observability strategy. They offer a high-level, efficient way to monitor system health, trigger alerts, and identify anomalies — without the complexity that often comes with processing large volumes of verbose, unstructured log data.
Many teams use metrics as a complement to logs, or even as a lower-cost alternative for gaining visibility into performance trends and incidents. But metrics come with their own set of challenges. Teams must choose how and where to collect them, which often means deploying new tools, instrumenting services, and accounting for additional operational overhead.
Edge Delta’s Telemetry Pipelines give teams the control and flexibility to generate metric insights with ease through real-time log-to-metric conversion. Not only does this pre-index conversion help teams save significantly on costs by reducing their downstream ingestion volumes — it also eliminates the need to deploy new infrastructure or instrument additional services by leveraging existing log data flowing through the pipeline.
In this blog post, we’ll demonstrate how to configure pre-index log-to-metric conversion in an Edge Delta Pipeline — and how to visualize the resulting data on a customizable dashboard.
Real-World Log-to-Metric Conversion Example
Consider the following scenario: we have a system generating high volumes of Apache log data, and we need to monitor the associated request metrics to better understand how our services are being used. By sending these logs through an Edge Delta Pipeline, we can extract request behavior metrics from them in real time.
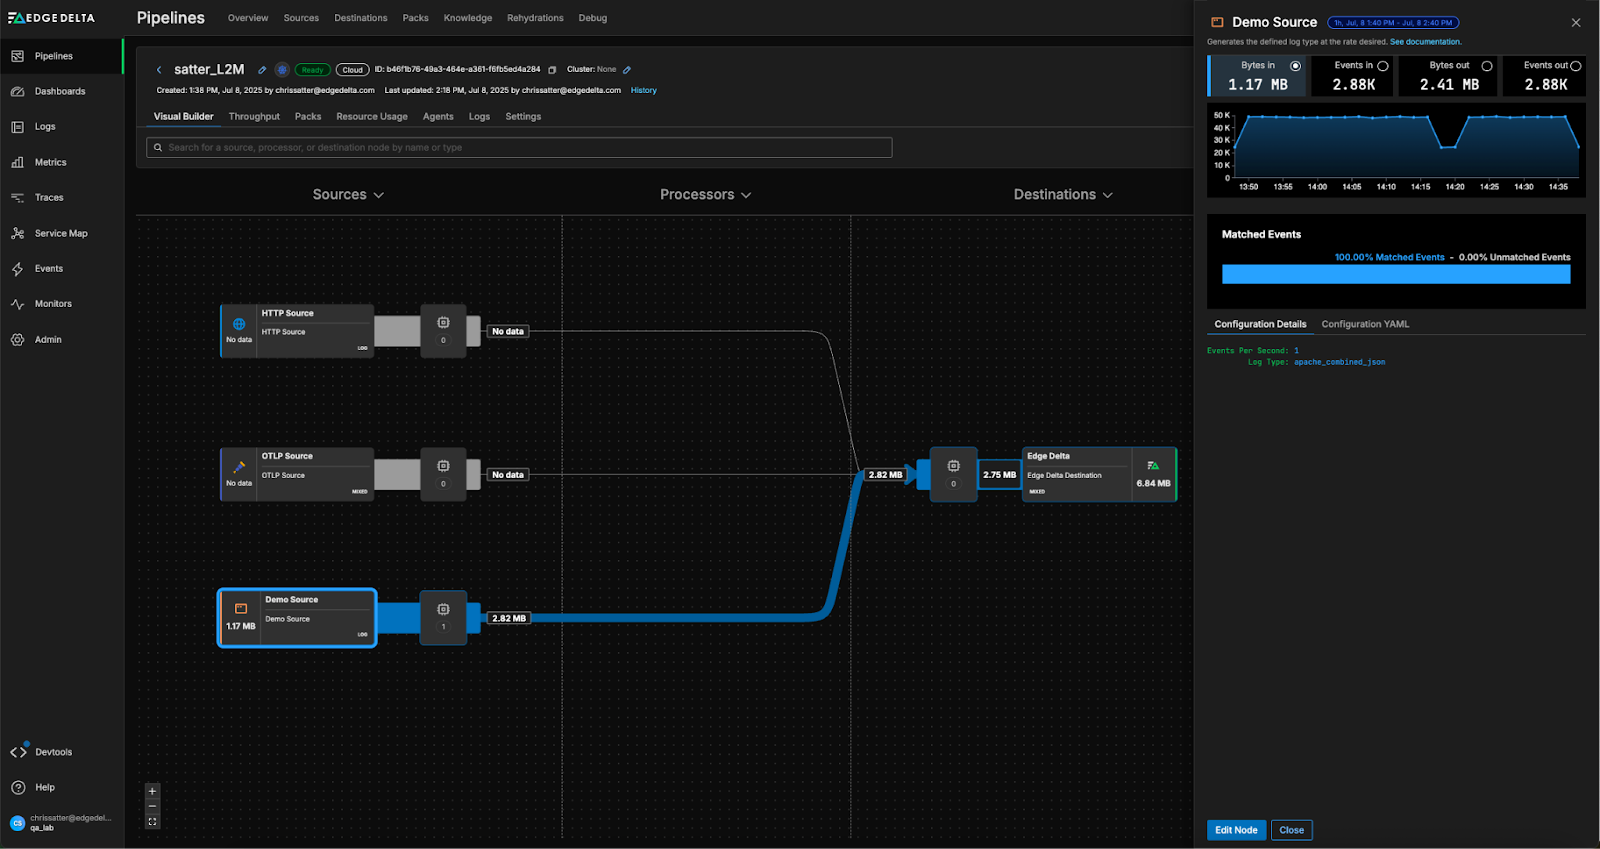
To demonstrate, we’ve set up an Edge Delta Pipeline that’s configured to collect Apache log data via a demo input and route it into Edge Delta’s Observability Platform.
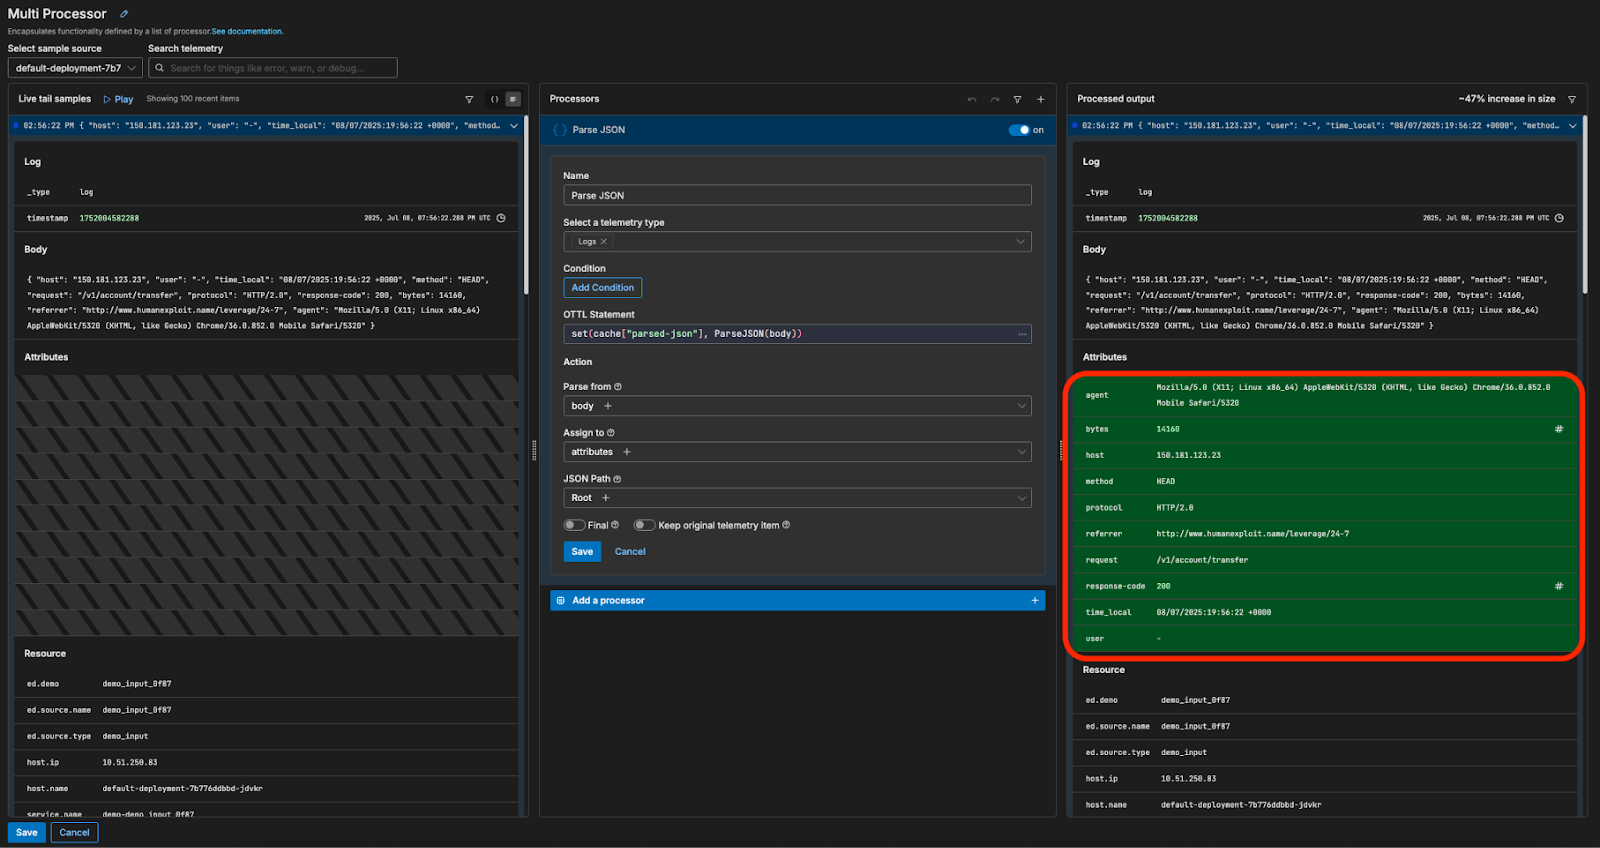
We’ll first add a Parse JSON processor to the pipeline, which will parse the Apache log data and store its attributes in a structured format:
For this example, we’re interested in the frequency at which the Apache server is generating different response codes. Once parsed, each Apache log has an associated response code stored under its “response-code” attribute — all we need to do is extract those values as metrics and ship them downstream. First, we’ll send the Apache logs through an “Extract Metric” processor:
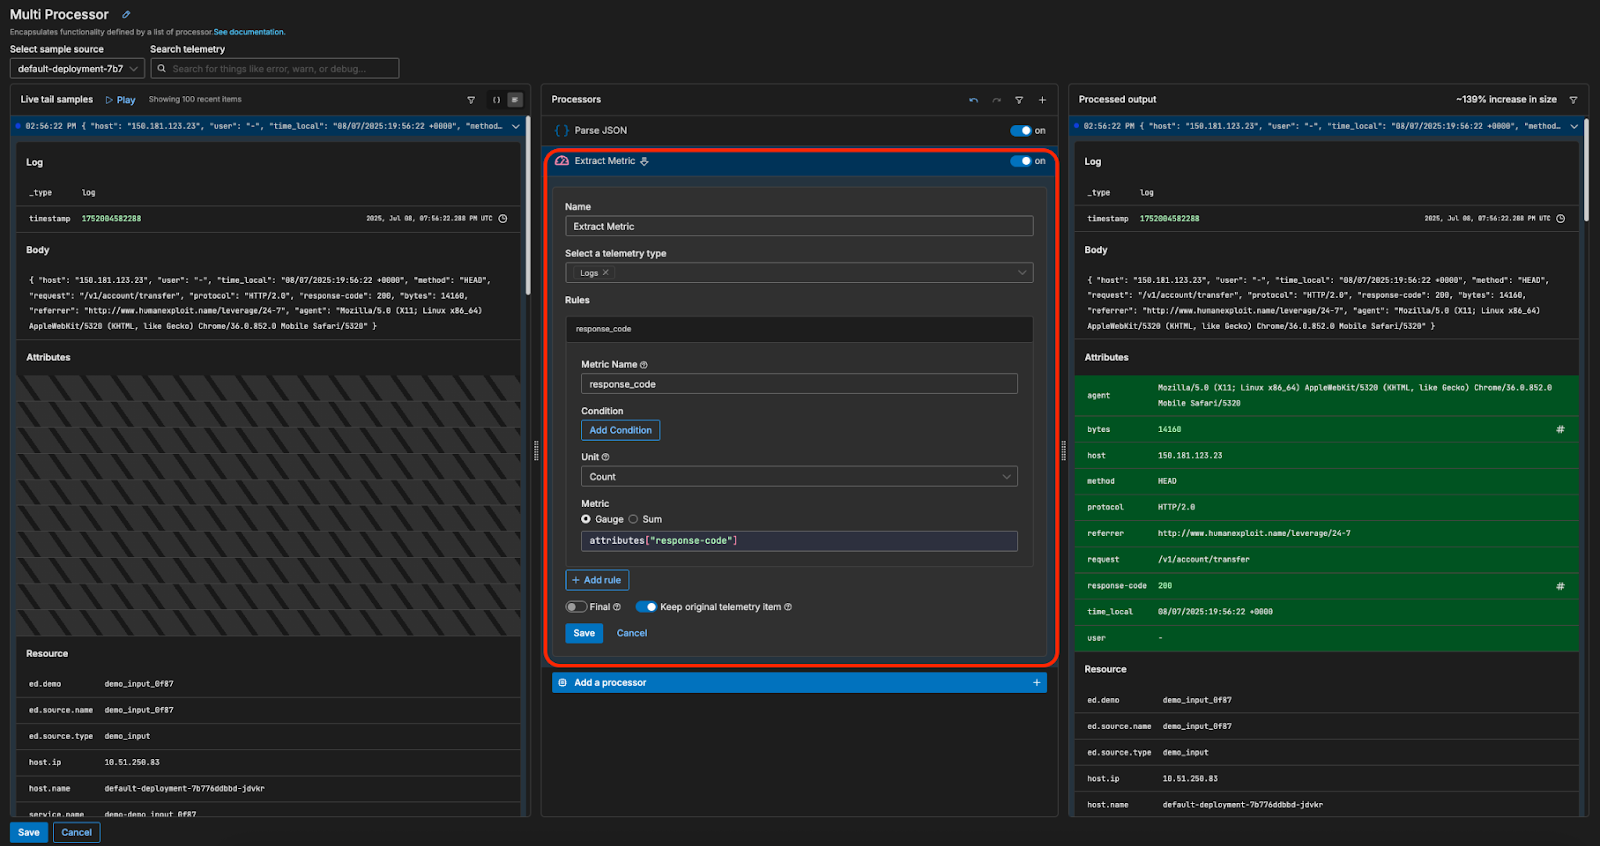
This will duplicate each log item, and convert the duplicated copies into a count metric corresponding to the associated response code (e.g., a log item with a response code of 200 is duplicated, and the duplicated log is converted into a metric with a value of “200” and a count of “1”). This way, we can extract and ship response code metrics downstream, while still preserving the original log items.
Monitoring Response Code Metrics in Edge Delta’s Observability Platform
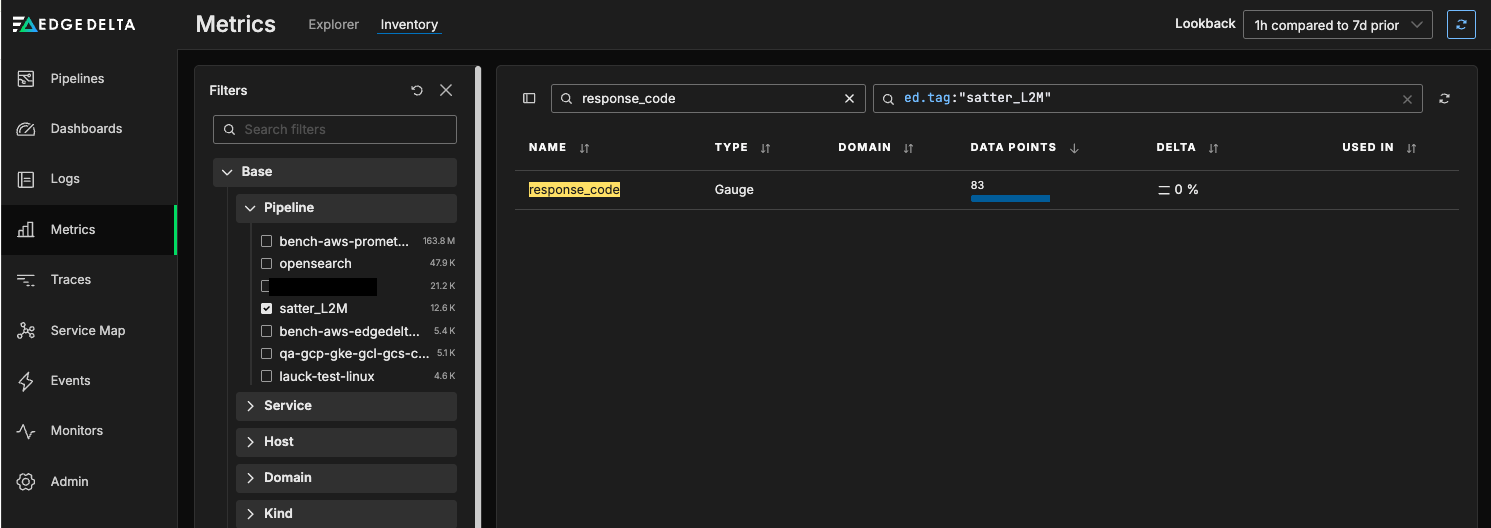
Once we’ve saved this configuration and the “response_code” metric begins flowing into Edge Delta, we can view it in the Inventory tab of the Metrics section:
By clicking into the “response_code” metric directly, we can see all of the different labels associated with it, including the frequency of each generated response code:
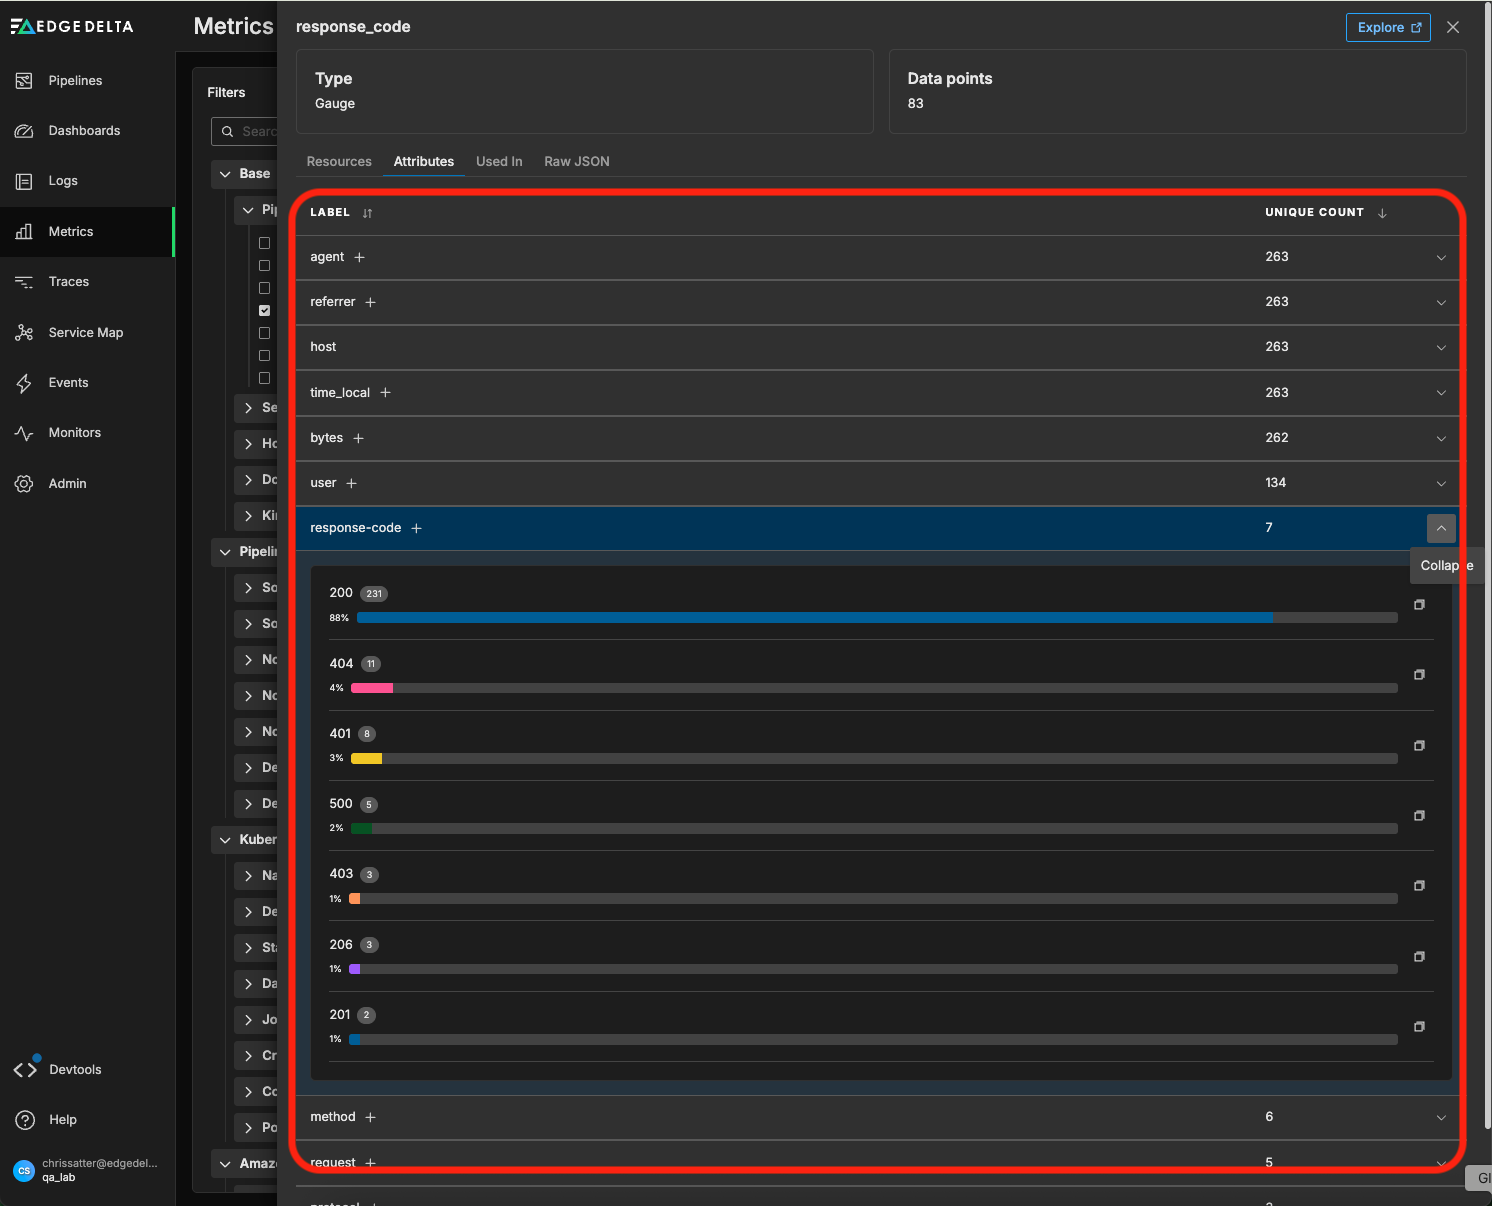
We can click on the “+” button next to the “response-code” label to add it as a custom facet for the response_code metric (since metrics can only be grouped by pre-defined facets, we need to define the response-code facet in advance to group the response_code metric by it).
Now, we are ready to graph this data. Let’s go back to the Explorer tab in the Metrics section and search for “response_code” in the metric search bar:
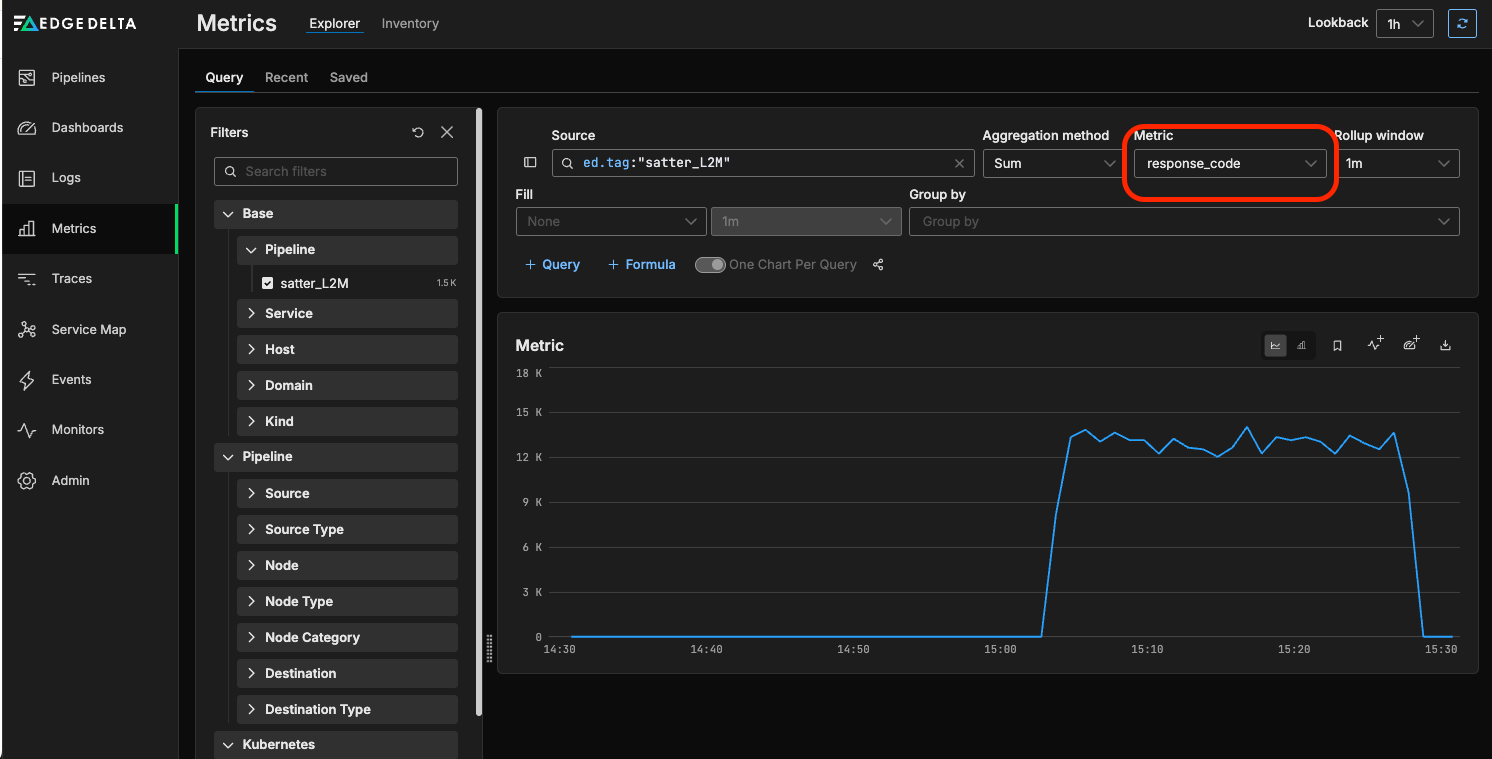
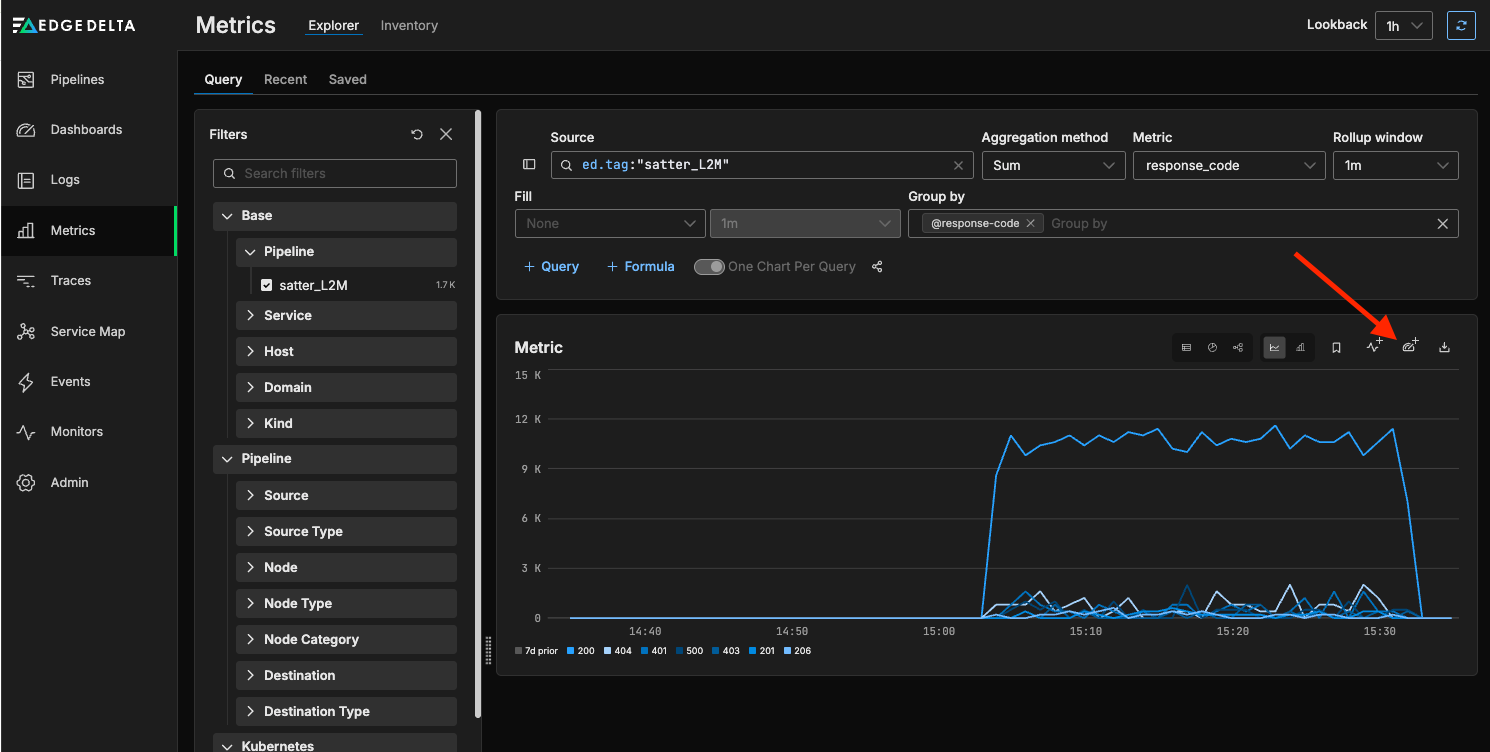
We can now view the total number of logs containing a response code, representing the count of HTTP requests generated by the Apache server. However, to get the breakdown we want, we need to group by response code type. To do this, we can use the Group by field and select the “response-code” custom facet we created previously:
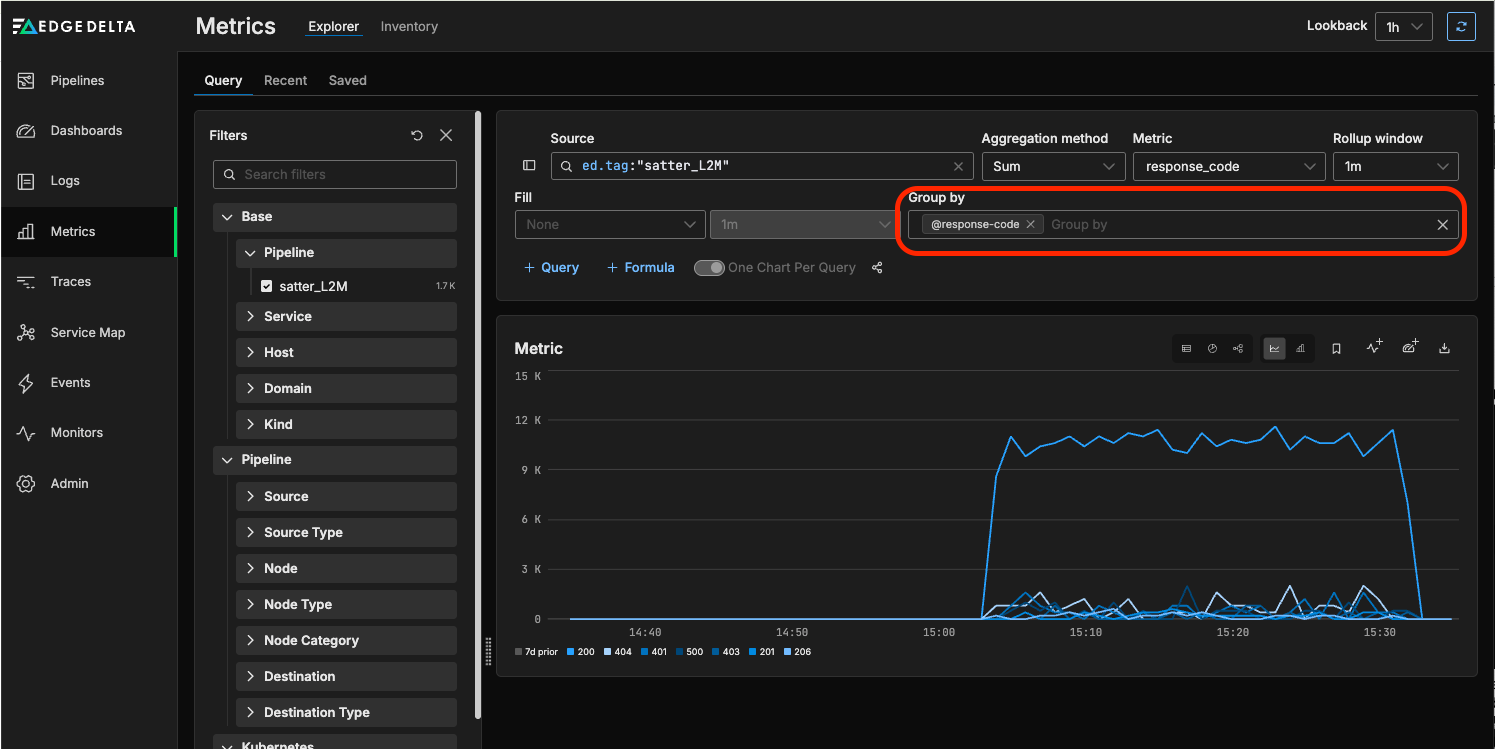
We can now see a breakdown of the response codes generated by the Apache server — and click on the highlighted icon below to add it to a dashboard:
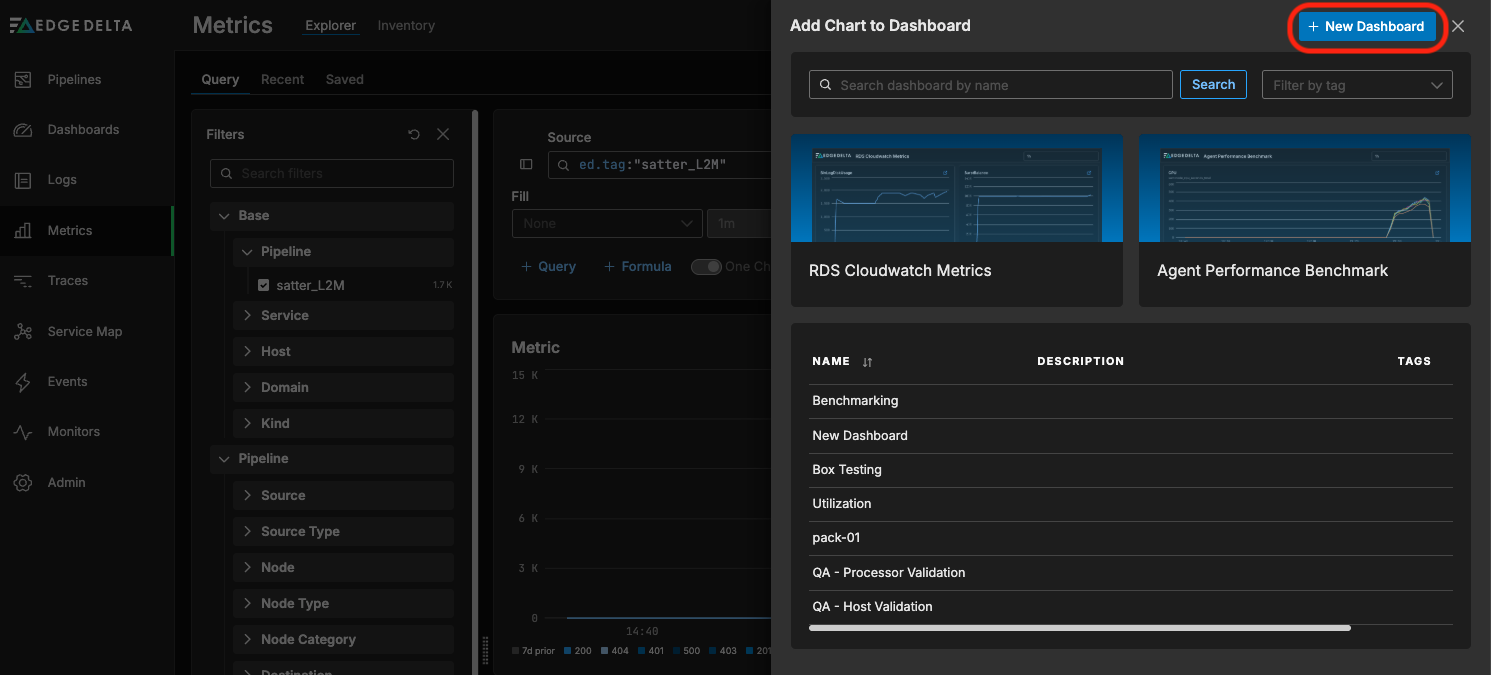
The Add Chart to Dashboard widget will appear — click on + New Dashboard:
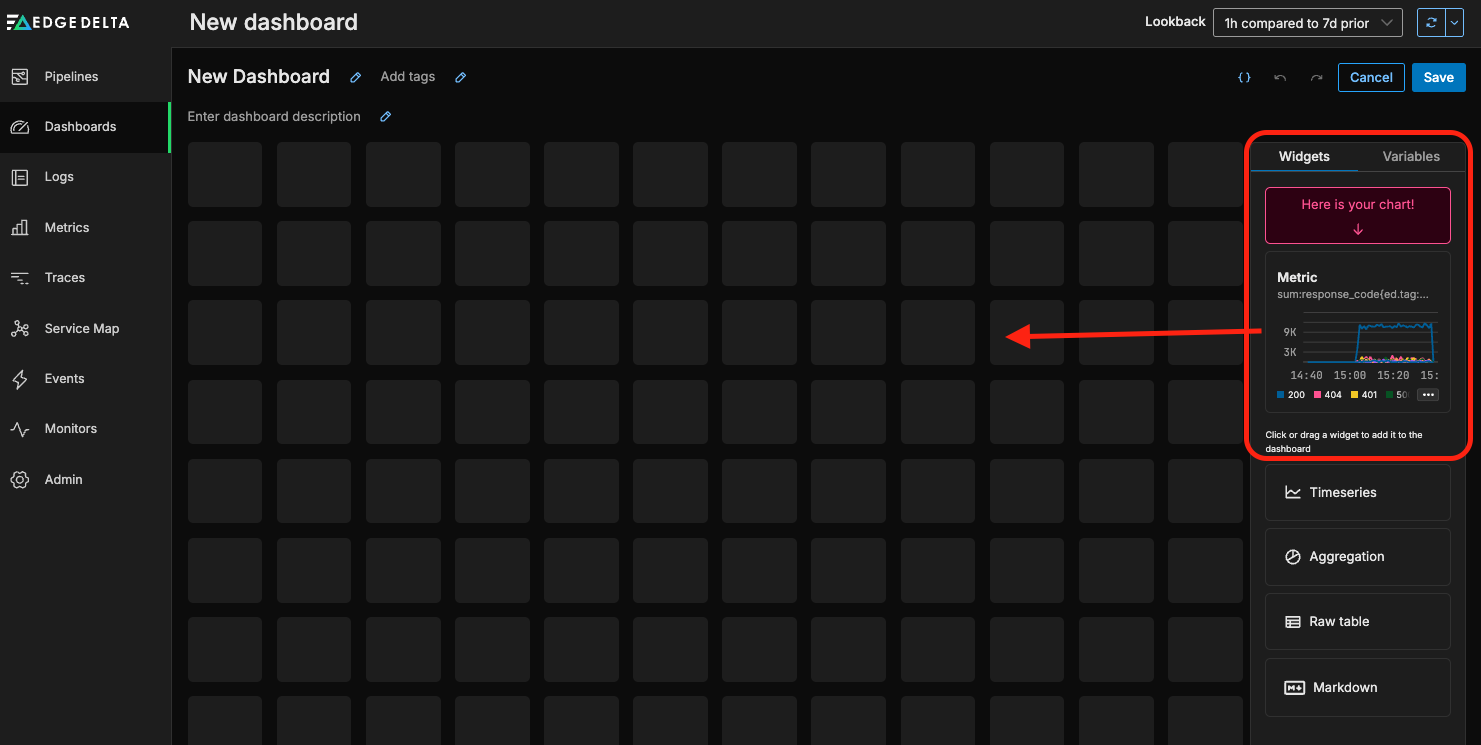
From here, we can drag the new widget onto our newly created dashboard:
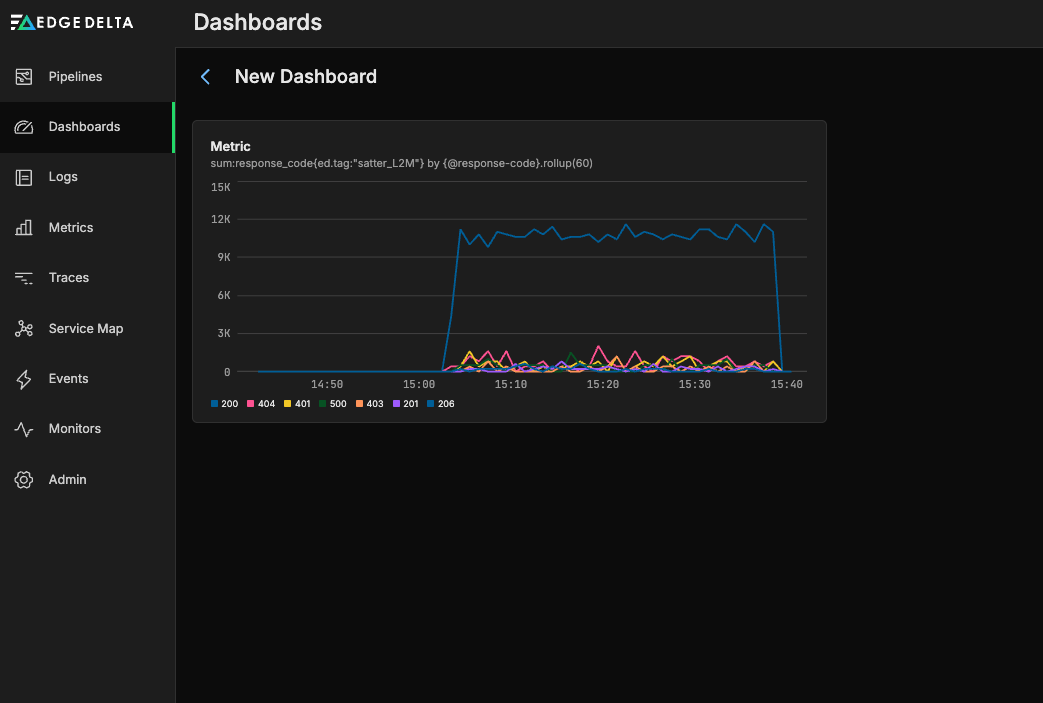
Now, we can easily monitor the dashboard to quickly flag any unusual behavior, before diving deeper into the log data to identify and resolve the underlying root cause.
By extracting this response code metric closer to the source, we’re able to feed this dashboard directly without performing any expensive post-ingestion operations — and without any heavy configuration lift. We also have the option to route the underlying log data to lower-cost storage, like S3, using a Dynamic Tiering approach, significantly reducing costs without compromising visibility.
Conclusion
In an observability landscape burdened by complexity and cost, Edge Delta’s log-to-metric conversion offers a smarter, more efficient path toward troubleshooting at scale. Instead of integrating new tools or heavy infrastructure to support metrics collection, teams can extract real-time insights directly from the logs they’re already capturing, cutting telemetry data costs while preserving system context.
By leveraging Edge Delta’s Telemetry Pipelines to parse logs, extract meaningful metrics, and surface trends, organizations gain a lightweight yet powerful way to monitor system and application health while optimizing spend. Whether you’re looking to reduce downstream ingestion volumes, consolidate your tooling, or streamline your observability strategy, log-to-metric conversion gives you the visibility you need.
Interested in learning more about how you can use Edge Delta’s Telemetry Pipelines to efficiently extract metrics from log data? Explore our free, interactive Playground, or start a free trial.


