

Google created Go (also known as Golang), a statically typed, compiled language to improve efficiency and usability. It emphasizes simplicity, high performance, and robustness, featuring a minimalist syntax that simplifies managing complex programs. Go’s standard library and features like goroutines and garbage collection make it well-suited for building scalable web apps, microservices, and distributed systems.
Furthermore, Golang is popular in web development due to its concurrent processing and ‘http’ package, which enable responsive servers and APIs. Its fast compilation and built-in concurrency are ideal for developing microservices, facilitating straightforward deployment and efficient inter-service communication.
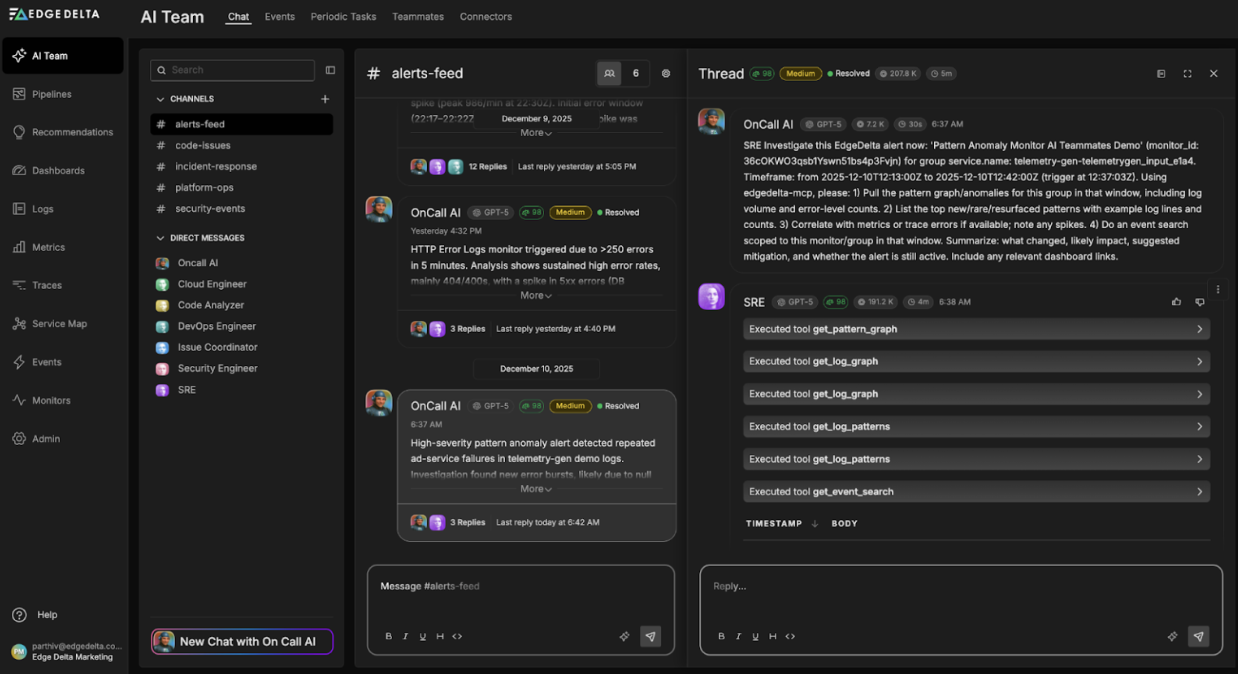
Want Faster, Safer, More Actionable Root Cause Analysis?
With Edge Delta’s out-of-the-box AI agent for SRE, teams get clearer context on the alerts that matter and more confidence in the overall health and performance of their apps.
Learn MoreIntegrating OpenTelemetry (OTel) with Go presents a complex initial setup and a deep understanding of OTel and the application architecture. Effective instrumentation is crucial to minimizing performance impact. Maintaining service traces requires consistent trace IDs and detailed logging, while compatibility with existing monitoring tools may require custom solutions.
Continue reading to learn how to enable distributed tracing for GoLang apps and best practices.
Key Takeaways
- Golang emphasizes simplicity, high performance, and robustness, featuring a minimalist syntax that simplifies managing complex programs.
- Go’s fast compilation and built-in concurrency simplify microservices deployment and communication.
- A well-configured Go environment and knowledge of Go programming are required to enable tracing for Go apps.
- After integrating and configuring the tracing setup for Go apps, it is critical to ensure that traces are being reported correctly.
- Reduced telemetry data generation can help to avoid performance degradation, cost escalation, and alert fatigue.
Step-by-Step Guide on Enabling Tracing for Go Applications
Enabling tracing in Go applications is an essential technique for monitoring and debugging, particularly useful in microservice architectures. It helps identify performance bottlenecks and clarifies the interactions between various applications’ services. The setup involves several key steps:
- Instrumentation OpenTelemetry packages
- Initializing tracer
- Instrumenting code
- Visualization and analysis
Specific prerequisites are necessary before starting the process. Tracing requires modifications to the application code, so a well-configured Go environment and a solid understanding of Go programming are essential.
Additionally, familiarity with OpenTelemetry’s APIs and SDKs is crucial for effective implementation. Understanding how traces and spans work will allow you to monitor application workflows better.
When preparing to implement tracing, it’s vital to choose an appropriate tracing backend that supports OpenTelemetry and meets your application’s needs. It’s also important to consider the dependencies and libraries that your application might need based on its architecture and the services it interacts with. Moreover, security and privacy must always be considered to protect sensitive, traced data.
Did You Know?
The programming language commonly referred to as Golang is just named Go. The nickname “Golang” originated because the language’s original website was hosted at golang.org—back when the .dev domain wasn’t available. Many still use “Golang” for convenience, especially as a social media hashtag, #golang.
Here’s a step-by-step guide to setting up distributed tracing for Go apps:
Step 1: Install OpenTelemetry Packages
To begin, add the OpenTelemetry Go SKD to your project. Use the Go Modules for installation by running the following command:
go get go.opentelemetry.io/otel
This command fetches the OpenTelemetry Go SDK and its dependencies, ensuring you have the most recent version.
Step 2: Initialize the Tracer
Create a new Go file, typically (e.g., main.go), and set up your tracing environment. This configuration initializes a tracer provider with a resource for easy visualization. Below is a basic configuration snippet:
import (
 "context"
 "go.opentelemetry.io/otel"
 "go.opentelemetry.io/otel/exporters/stdout/stdouttrace"
 "go.opentelemetry.io/otel/sdk/resource"
 "go.opentelemetry.io/otel/sdk/trace"
 semconv "go.opentelemetry.io/otel/semconv/v1.24.0"
)
func main() {
ctx := context.Background()
traceExporter, err := stdouttrace.New(stdouttrace.WithPrettyPrint())
if err != nil {
panic(err)
}
res, err := resource.Merge(
resource.Default(),
resource.NewWithAttributes(
semconv.SchemaURL,
semconv.ServiceName("MyService"),
semconv.ServiceVersion("v0.0.1"),
),
)
if err != nil {
panic(err)
}
traceProvider := trace.NewTracerProvider(
trace.WithBatcher(traceExporter),
trace.WithResource(res),
)
otel.SetTracerProvider(traceProvider)
defer func() { _ = traceProvider.Shutdown(ctx) }()
}
Step 3: Instrument Your Code
Add an instrumentation to capture traces from your Go code. In this step, you will replace “operationName” with appropriate descriptions of the operations you trace. Each span can capture various events and attributes related to specific operations.
tracer := otel.Tracer("MyService")
ctx, span := tracer.Start(context.Background(), "operationName")
defer span.End()
// Example of adding an event to a span
span.AddEvent("Processing Start")
// Your application logic here
span.AddEvent("Processing End")
Step 4: Test and Validate Tracing
Run your Go application and ensure the traces are captured and displayed as expected. Using the stdout exporter might show outputs in your console depicting the start and end of spans and any associated events or attributes.
Keep reading to learn another method of enabling tracing for the Go application.
Other Methods of How Enable Tracing for Go Microservices
Another effective way of enabling tracing for Go microservices is by integrating OpenTelemetry at compilation time. Automating instrumentation with Abstract Syntax Tree (AST) manipulations and proxy libraries makes this method a reliable microservice tracing option.
Here’s a step-by-step guide on how to enable tracing for Go microservices:
Step 1: Install Necessary Tools
Before beginning, ensure you have Go installed on your system. Additionally, you’ll need to install OpenTelementry GO SKD and any relevant libraries for AST manipulation. The installation can be done by running the command:
go get go.opentelemetry.io/otel
Tools, like go/ast from the Go standard library, will be needed to parse and manipulate the Go source code. Install any required dependencies to ensure a proper setup for these tools.
Step 2: Modify the Build Process
Modify your build process to include AST manipulation scripts. These scripts automatically adjust your code’s Abstract Syntax Tree (AST) to insert tracing instructions during the build process. You can integrate a custom Go tool that uses packages like go/ast and go/parser to analyze and modify your source code.
For example, if you are using a Makefile, you can modify your build scripts by:
build:
 @echo "Running AST tool"
 ./ast-tracer
 @echo "Building the service"
 go build .
Step 3: Use Proxy Libraries
Integrate proxy libraries that support OpenTelemetry. These libraries act as intermediaries for function calls within your application, automatically capturing trace data without manual instrumentation. For example, you can use pre-instrumented proxy versions to capture and send trace data to your telemetry backend using HTTP clients or servers.
Step 4: Configure Tracing
Set up and configure the tracing exporter in your Go application. This involves setting up the OpenTelemetry Collector or directly configuring exporters that send data to your backend, like Jaeger or Zipkin. You’ll need to specify details like the backend’s URL, sampling strategies, and any necessary authentication tokens.
Step 5: Validate the Setup
After integrating and configuring your tracing setup, it’s essential to validate that traces are being correctly reported. This can involve running test transactions through your application.
Check your trace visualization tool (like Jaeger or Zipkin UI) to ensure traces appear as expected. Look for complete trace data and correct correlations between trace spans. Adjust configurations based on the observed data to provide comprehensive coverage and accurate reporting.
Best Practices When Enabling Tracing for Golangs
Enabling tracing in Go applications can significantly enhance visibility into application performance and help in debugging issues effectively. Here are some best practices for configuring tracing in Go, as well as how they can help improve workflow and increase success rates:
Keep Instrumentation Lightweight
Keeping the instrumentation lightweight is crucial to ensure that tracing remains effective without degrading performance. This approach involves using tools and methods that insert tracing code into applications with minimal overhead. As a result, it enables real-time data collection and analysis without significantly impacting application speed or user experience.
Use Consistent Naming Conventions
Adopting consistent naming conventions for traces and spans is vital for maintaining clarity and consistency across monitoring systems. Standardized names simplify distributed system debugging and performance analysis by identifying and correlating related components.
Implement Sampling
Configure appropriate sampling strategies—such as probabilistic, rate-limiting, or custom sampling—to limit the amount of telemetry data generated while preserving critical insights. Reduced telemetry data generation can help to avoid performance degradation, cost escalation, and alert fatigue.
For example, you can give a higher probability to critical requests or requests with specific attributes that necessitate further investigation. Probabilistic sampling lets you monitor critical requests while reducing the tracing load for less essential or high-volume requests.
Regularly Monitor and Review Traces
Continuously monitor traces to identify and address performance issues promptly. Distributed systems’ complex, deeply layered, and often outsourced services make fault isolation difficult, so traces must be monitored and reviewed regularly.
Regular monitoring and review help identify performance bottlenecks, manage dependencies, optimize system performance, and comply with regulations.
Document the Tracing Setup
Maintain detailed documentation of the tracing setup and configuration. This documentation should be used as a comprehensive reference guide in the future, making troubleshooting and updates more efficient.
To provide context and rationale, explain the decision-making processes behind the choice of tools and sampling strategies. The documentation should also be updated to reflect any tracing system changes or optimizations to keep it functional for team members and stakeholders.
Final Thoughts
Golang is well-known for its simplicity, high performance, and robustness, making it ideal for developing scalable web applications, microservices, and distributed systems. By harnessing the power of concurrent processing and streamlined syntax, Golang ensures responsive server and API performance.
Setting up OpenTelemetry for distributed tracing in Go applications can be tricky—it requires a thorough understanding of the tool and your application’s architecture. However, the effort is well worth it. OpenTelemetry enhances your Go application’s observability and reliability by providing excellent monitoring and debugging capabilities. Following tracing best practices can help Go developers improve their applications’ performance, maintainability, and scalability, meeting modern software architecture requirements.
FAQ on How to Enable Distributed Tracing for Golang Apps
What is tracing in Golang?
Tracing in Golang, often called Go tracing, is a technique for gathering detailed information about a program’s execution events and runtime activities. This process includes details about goroutines, system calls, garbage collection, and other runtime events.
How to achieve distributed tracing in microservices?
Choose a tracing library like OpenTelemetry, Jaeger, or Zipkin to achieve distributed tracing in microservices. Instrument your code to record key operations (spans) in your services. Ensure trace context is propagated via HTTP headers or gRPC metadata with each request. Use an exporter to send trace data to a backend such as Jaeger or Zipkin. Finally, utilize the tracing backend’s UI to visualize traces, analyze latencies, and identify bottlenecks.
What tool can track requests in real time as they move through distributed systems?
OpenTelemetry tracks request in real time through distributed systems by capturing and exporting trace data. Instrument your services to collect traces, propagate context via headers, and export data to backends like Jaeger or Zipkin. This helps visualize performance bottlenecks and service dependencies.
How to use Zipkin?
To use Zipkin for distributed tracing, instrument your service with a Zipkin-compatible library, ensure trace context is propagated via headers, and configure the library to export trace data to a Zipkin server. Use the Zipkin UI to visualize and analyze traces for performance bottlenecks and dependencies.