Palo Alto Networks provides a comprehensive cybersecurity platform for organizations of all sizes.
Among its extensive offerings, Palo Alto Networks’ firewall solution identifies and blocks complex threats. As a byproduct, the firewall generates nearly 20 different types of security logs that correspond to specific event categories aimed at thwarting threats like spyware, vulnerabilities, and viruses.
Given the high stakes of data breaches today, monitoring and analyzing Palo Alto firewall logs is a critical method for preventing and remediating threats.
What is the Palo Alto Pipeline Pack?
For security teams already using the cybersecurity platform, Edge Delta offers a Palo Alto Pipeline Pack for Telemetry Pipelines to strengthen and speed your monitoring and threat analysis.
This specially-designed collection of processors automatically parses, categorizes, and transforms Palo Alto firewall logs, which can then be routed to any downstream destination for further analysis or storage via our pipelines.
If you are unfamiliar with Edge Delta Telemetry Pipelines, they are an intelligent pipeline solution designed to handle log, metric, trace, and event data. By processing data as it’s created at the source, you gain greater control over your telemetry data at far lower costs.
In this post, we’ll talk about how the Palo Alto Pipeline Pack operates, and the benefits users get with its simple and fast implementation.

How Does the Palo Alto Pipeline Pack Work?
Within the context of Palo Alto’s firewall offering, logs are defined as time-stamped, automatically-generated files that serve as an audit trail for:
- System events on the firewall
- Network traffic monitored by the firewall
Each log entry includes details such as properties, activities, or behaviors related to the event, like the application type or the attacker’s IP address.
Perhaps the two most critical log types within Palo Alto are traffic logs and threat logs:
- Traffic logs: Records of general session information for session tables, which the Palo Alto firewall uses to establish and manage two-way communication between the client (initiator) and the server (responder).
- Threat logs: Records of entries demarcated when traffic matches one of the Security Profiles previously attached to a security rule on the firewall. For example, any traffic that is suspected of having traits resembling spyware, virus, or vulnerability exploiting would be deemed a match, and an associated threat log would be generated.
The Palo Alto Pipeline Pack mainly focuses on traffic and threat logs, given their broad coverage and critical nature. The remainder of this blog post discusses how the pack handles these logs.
Automatic Log Routing by Type
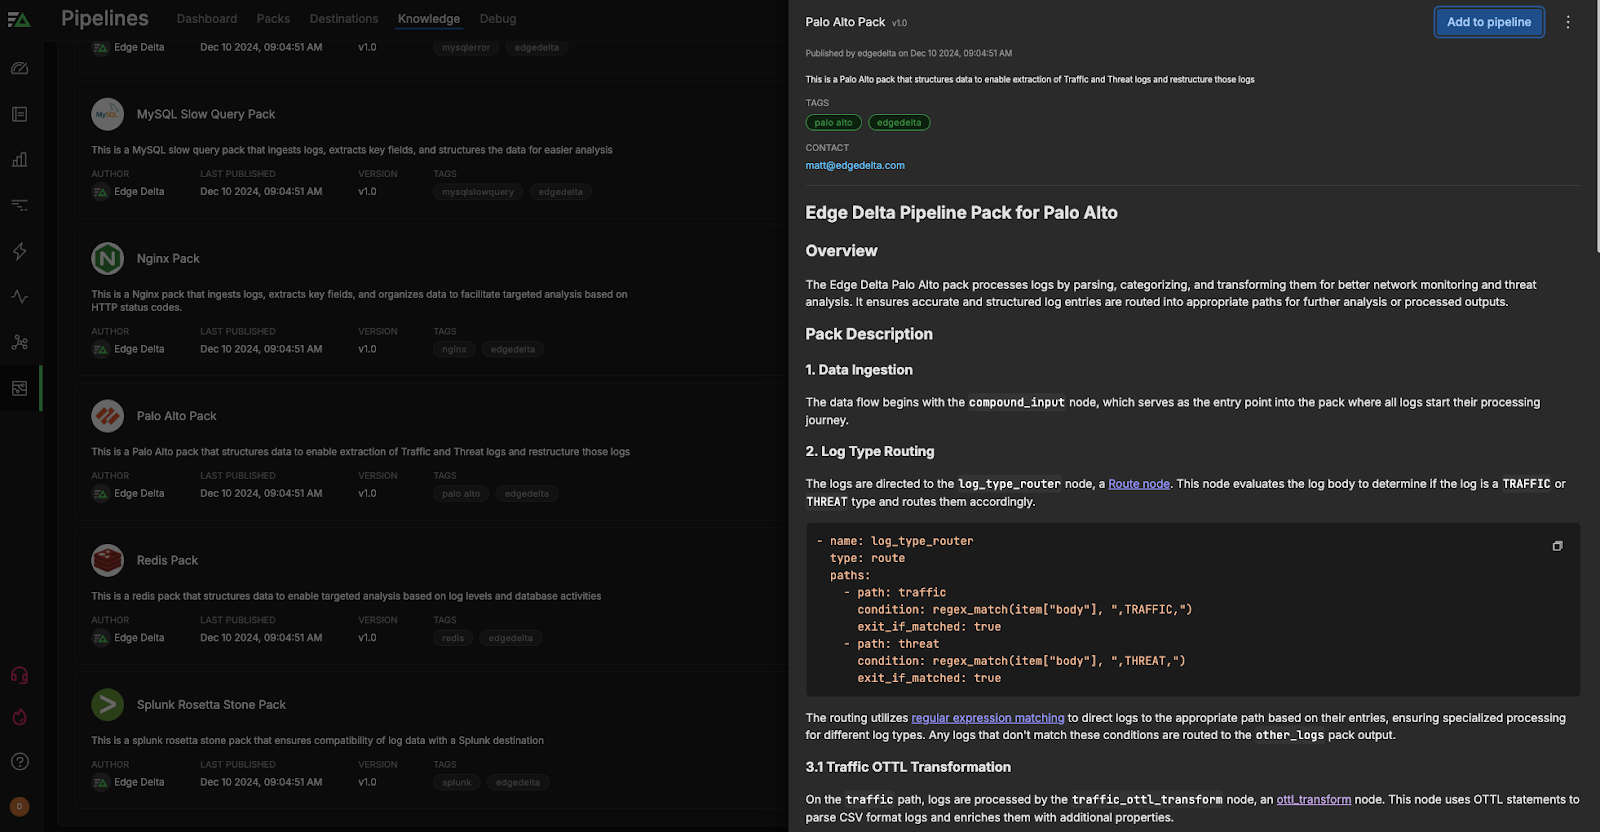
You can find the Palo Alto Pack by heading to the Pipeline section within Edge Delta, and then navigating to “Knowledge,” and then “Packs.” Scroll through our packs, which are organized alphabetically, until you find the Palo Alto Pack. Once you do, click “Add to pipeline” and select the pipeline you’d like to add the pack too. If you don’t already have a pipeline setup, you’ll want to go ahead and create one that’ll use Palo Alto logs as a source.

After data begins flowing into the Palo Alto Pipeline Pack, the pipeline evaluates the log body to determine if the log is a TRAFFIC or THREAT type and routes them accordingly.
- name: log_type_router
type: route
paths:
- path: traffic
condition: regex_match(item["body"], ",TRAFFIC,")
exit_if_matched: true
- path: threat
condition: regex_match(item["body"], ",THREAT,")
exit_if_matched: true
The routing utilizes regular expression matching to direct logs to the appropriate path based on their entries, ensuring specialized processing for the two different log types. Any Palo Alto logs that don’t match these conditions are then routed to the {other_logs} pack output.
OpenTelemetry Transformation Language (OTTL) Transformation
Edge Delta automatically standardizes all log data in the OTel schema to enable interoperability, strengthen your observability practice, and improve overall visibility into complex environments. With your log data in the OTel format, you can then route it to any downstream destination after processing.
Within the pipeline pack, an ottl_transform node is used to automatically re-format the log data, making it more structured and useful for security analysis and network monitoring purposes. Both log types are processed by an individual ottl_transform node specifically for either traffic or threat logs, traffic_ottl_transform and threat_ottl_transform respectively.
Both of these nodes use OTTL statements to parse log messages that are formatted in comma-separated values (CSV) and store the extracted log fields in their own separate fields within the attributes section of the associated log item. This enables teams to easily filter through, monitor, and visualize their Palo Alto logs for stronger and faster analysis.
Here are some examples of how these nodes process Palo Alto traffic logs:
Headers Parsing
Saves the headers for the CSV parsing in a cache by defining a string that includes all the field names expected in the log data. This is crucial for CSV parsing, as it informs the parser how to interpret each column of the CSV log line. By having a defined header, you also ensure that the right pieces of data are accurately mapped to their corresponding attributes.
Attributes Parsing
Takes the log data contained in the body, decodes it from UTF-8, and then parses it using the ParseCSV function. The cache is used to map the CSV fields correctly to the appropriate field in the attributes section of the log item. Parsing the CSV allows for structured access to each piece of log information, enabling more refined analytics and data manipulation downstream.
Here are some examples of how these nodes process Palo Alto threat logs:
Event Categorization
Enriches the log with the event.category attribute, setting it to an array containing “network” and “threat.” This dual categorization is useful for filtering and analyzing logs based on both network and threat categories, aiding in the identification and prioritization of potential security concerns.
Event Type Attribute
Sets the event type attribute to an array that includes ”connection,” “threat,” and the original event type derived from the Palo Alto log data. By associating the log entry with multiple types, this enhances the log’s detail level, offering richer context for downstream analysis, such as threat detection and security incident response.
Common Expression Language (CEL) Transformation
After OTTL processing, both threat and traffic logs then move to the CEL transformation node, which converts event timestamps from strings into Unix milliseconds, ensuring it can be viewed in order in Edge Delta. Here’s how that looks for threat logs:
- name: threat_cel_transform
type: generic_transform
transformations:
- field_path: item["timestamp"]
operation: upsert
value: convert_timestamp(item["attributes"]["palo_alto"]["event.timestamp"], "2006-01-02 15:04:05", "Unix Milli")
Finally, the traffic and threat logs are routed to separate pack outputs, traffic_logs and threat_logs, where you can determine whether you’d like to send them to a platform for further analysis or ship them off for storage.
All Remaining Logs
Logs that don’t match the traffic or threat conditions are sent to other_logs, a separate pack output node, for you to review.
Palo Alto Pack in Practice
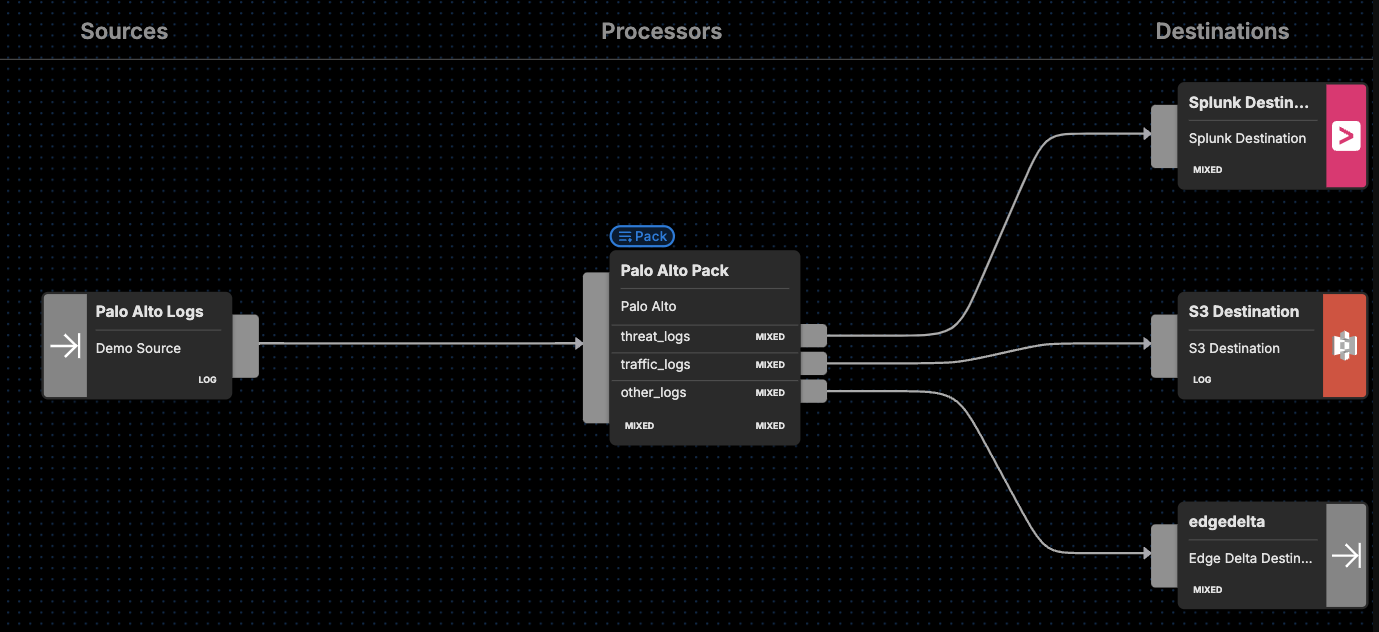
After you’ve added the Palo Alto pack to an Edge Delta pipeline, our Visual Pipelines builder will give you the option of routing threat_logs, traffic_logs, and other_logs to any destination of your choosing. You’ll just need to add a Destination in Visual Pipelines, and then drag and drop the connection from whichever set of logs you’re targeting.

For instance, you can route your threat_logs to a SIEM or other platform like Splunk for log analysis. Meanwhile, you can send all your traffic logs to an observability platform or S3 for potential further review. All the remaining logs could then be sent to either Edge Delta, so you can monitor them in real time for any issues, or a storage option for compliance purposes.
Getting Started
Ready to see it in action? Visit our pipeline sandbox to try it out for free! Already an Edge Delta Customer? Check out our packs list and add the Palo Alto Pipeline Pack to any running pipeline.


