Modern DevOps teams rely on telemetry data to understand the behavior of complex systems. Logs play a central role in this process, but the way they are collected, stored, and analyzed varies drastically across platforms.
Splunk’s log management solution has been a mainstay for years, but we’ve seen significant recent momentum with organizations exploring Dynatrace Grail for unified observability and AI‑driven insights.
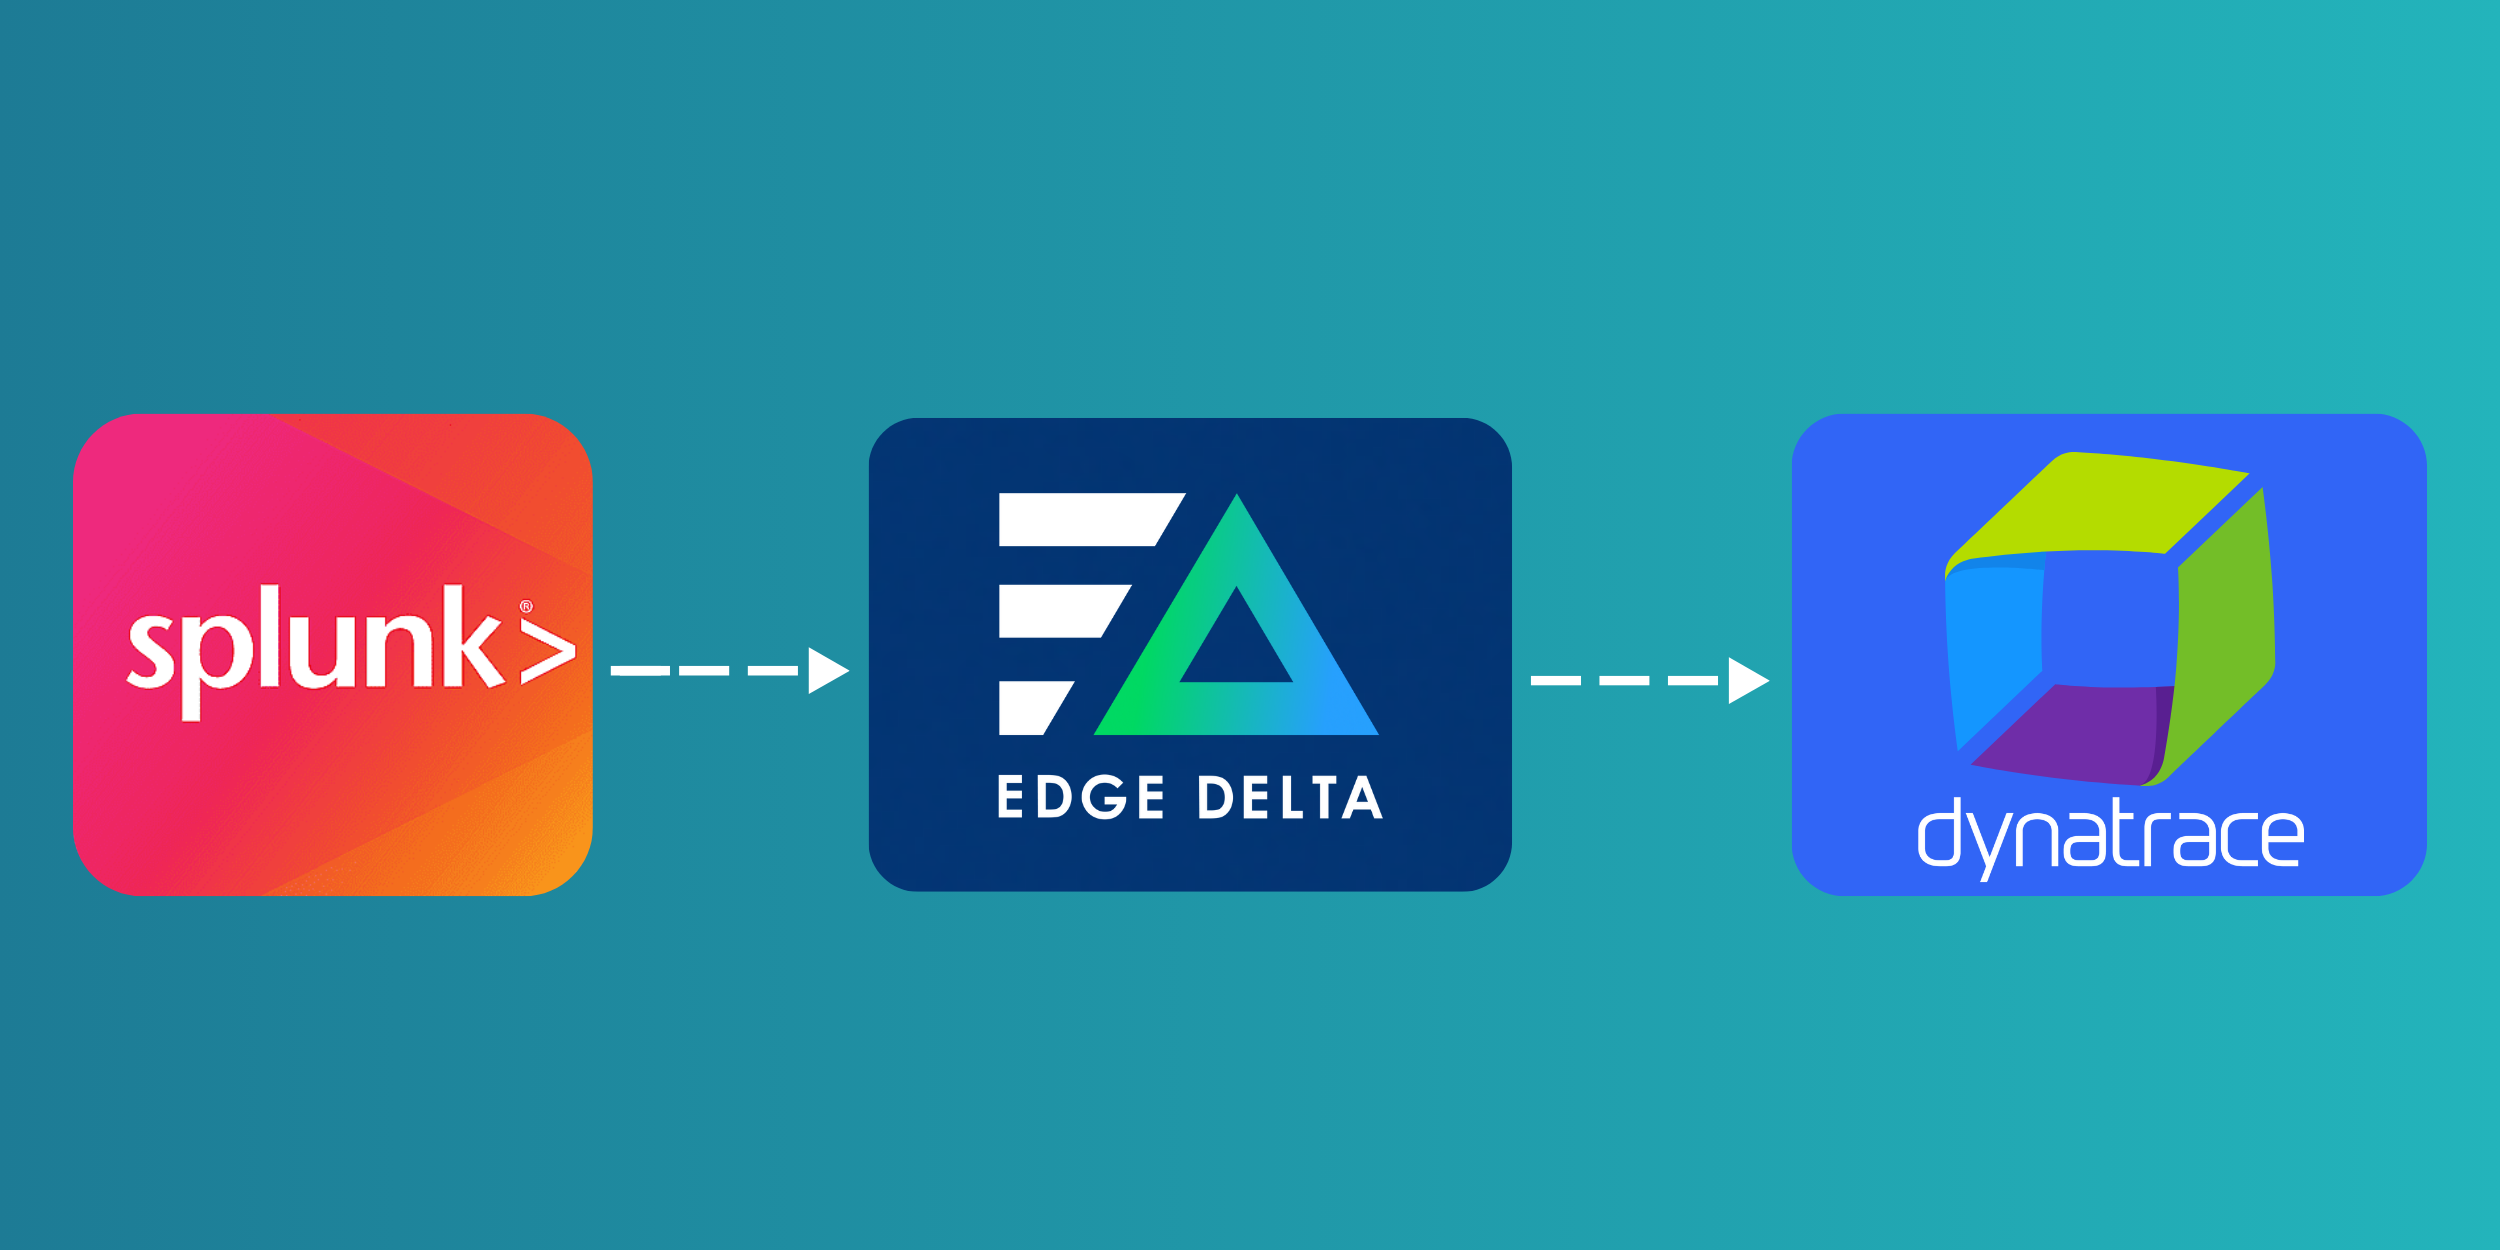
In this guide, you’ll learn how to migrate from Splunk to Dynatrace for log analytics, using Edge Delta as the processing layer that filters, transforms, and forwards logs.
Why Migrate? Comparing Splunk and Dynatrace Log Management
Splunk remains a powerful tool for ingesting and indexing very large log volumes. It aggregates log data from multiple platforms into a central index, providing advanced search, filtering, and visualization. However, Splunk does not automatically collect application logs; administrators must deploy and configure Universal Forwarders to format and forward data to Splunk. Splunk’s Log Observer Connect feature correlates logs with metrics and traces in real time, but the platform’s pricing is complicated and consumption costs can spike as ingest volumes grow.
Dynatrace’s log management offering is built on Grail, a distributed data lakehouse designed specifically for observability and security data. Grail provides a single, unified storage solution for logs, metrics, traces, and events. It is schema‑on‑read and indexless, so administrators do not need to predefine schemas or manage indexes. Data is stored in buckets with configurable retention periods, and everything is queried with Dynatrace Query Language (DQL). Dynatrace Grail’s native AI engine executes queries in parallel and provides anomaly detection and root‑cause analysis.
The migration from Splunk to Dynatrace therefore revolves around moving from index‑based ingest and SPL queries to schema‑on‑read storage and DQL. Oftentimes the biggest challenge to this migration is the format of the events themselves, and Edge Delta bridges this gap by performing streaming analytics — it can ingest Splunk events, transform them, and forward high‑value logs to Dynatrace Grail.
Introducing Edge Delta
Edge Delta’s Telemetry Pipelines run as close as possible to your data sources, which enables pre-index processing, filtering, pattern detection, and summarization. As a result, only the most valuable data is forwarded to downstream systems, which reduces ingestion costs and improves signal clarity. Edge Delta natively supports Dynatrace as a destination, allowing teams to pre‑process telemetry data upstream and send optimized logs directly into Dynatrace.
Architecture Overview
The migration architecture consists of three primary components:
- Splunk environment: Logs from existing sources (applications, containers, VMs, devices) are collected with Splunk Forwarders, which may forward them to Splunk’s HTTP Event Collector (HEC).
- Edge Delta Telemetry Pipeline: Edge Delta agents are deployed either near the log sources (on Kubernetes nodes, VMs, or containers) and configured with a
splunk_tcp_inputnode to ingest TCP traffic from the Forwarders, or near Splunk HEC infrastructure with asplunk_hec_inputnode to ingest HEC traffic. The pipeline uses processors (grok parsing, filtering, aggregation) to extract structured fields and discard noise. - Dynatrace Grail: A
dynatrace_outputnode sends optimized logs to a Dynatrace ingest endpoint (either locally deployed ActiveGate or directly to the Logs API). Logs are stored in Grail buckets and analyzed via DQL.
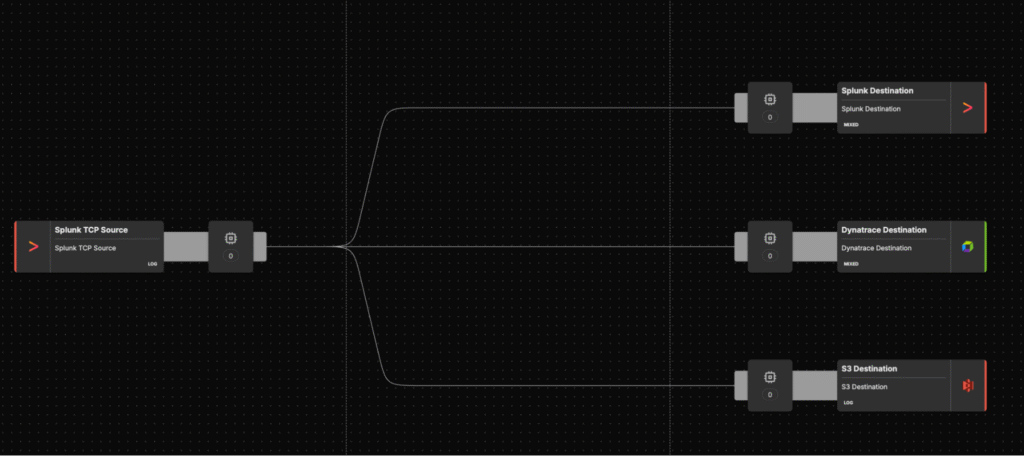
In most scenarios, the Edge Delta pipeline also forks the stream to other destinations (e.g., S3 or Splunk) for parallel validation during migration.
Building the Edge Delta Pipeline
To migrate from Splunk to Dynatrace with Edge Delta, you’ll need to build an Edge Delta pipeline. Follow these steps to connect your existing data sources to Dynatrace while maintaining control over how logs are processed along the way.
Step 1: Deploy Edge Delta Agents
Edge Delta supports deployment on Kubernetes (via Helm), Linux hosts, Windows, and other platforms. Choose the deployment method that matches your current Splunk architecture. For example, in Kubernetes you deploy the Edge Delta daemonset using Helm values, while on Linux VMs you install the Edge Delta binary and configure it with YAML.
Step 2: Configure Edge Delta Pipeline for Splunk Forwarders
To ingest data from Splunk, create a Splunk HTTP Event Collector (HEC) token and configure Splunk to forward events to the Edge Delta agent. In the Edge Delta pipeline, define a splunk_hec_input node:
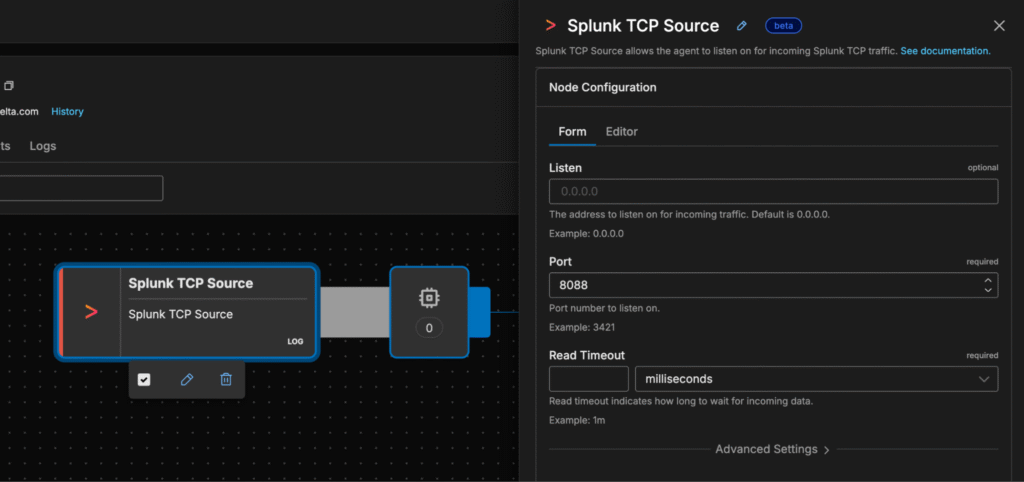
Step 3: Configure Splunk Forwarders
Edge Delta supports ingesting data directly from Splunk Heavy Forwarders (HF) or Universal Forwarders (UF) via the Splunk TCP source node. To configure a Splunk forwarder to send data to Edge Delta, modify its outputs.conf file to direct traffic to your Edge Delta agent.
[tcpout]
disabled = false
defaultGroup = edgedelta, <optional_clone_target_group>, ...
enableOldS2SProtocol = true

[tcpout:edgedelta]
server = <edgedelta_ip_or_host>:<port>, <edgedelta_ip_or_host>:<port>, ...
compressed = false
sendCookedData = true
# As of Splunk 6.5, using forceTimebasedAutoLB is no longer recommended. Ensure this is left at default for UFs
# forceTimebasedAutoLB = false
These examples demonstrate how to direct Splunk forwarder traffic to Edge Delta agents. Replace <edgedelta_ip_or_host> and <port> with the address and port previously defined in your Edge Delta pipeline. The defaultGroup and stanza name use edgedelta to route events to Edge Delta. Keeping enableOldS2SProtocol set to true ensures backwards compatibility with older Splunk forwarders and avoids data loss.
Step 4: Configure Edge Delta Pipeline for Splunk HEC (Optional)
If you want to use pre-aggregated datasets and ingest data via Splunk HEC instead of directly from the frowarders, create a Splunk HTTP Event Collector (HEC) token and configure Splunk HEC to forward events to the Edge Delta agent. In the Edge Delta pipeline, define a splunk_hec_input node:
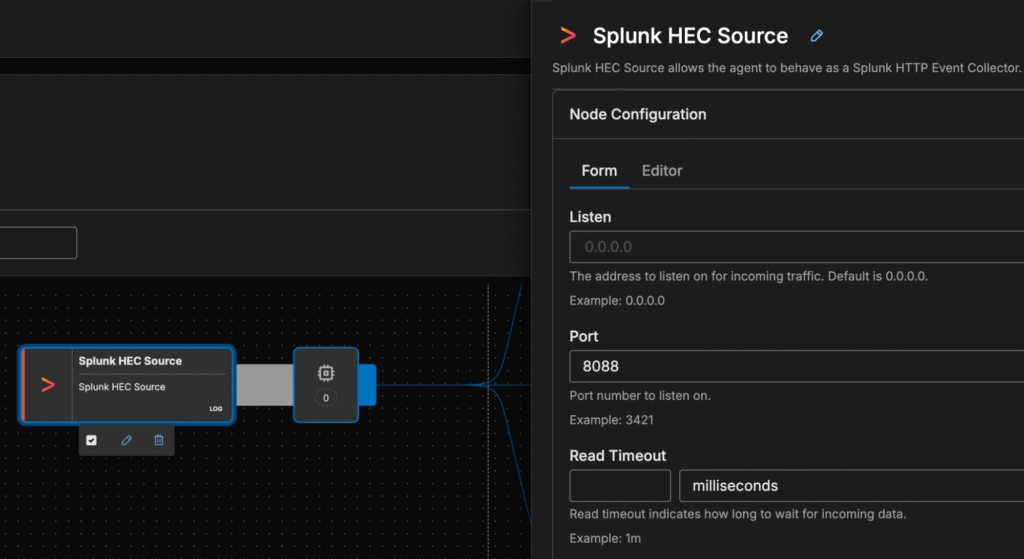
After defining the source, configure your Splunk forwarders to send data to the Edge Delta agent’s HEC endpoint instead of Splunk’s indexer. This step allows Edge Delta to intercept and transform logs before they reach the backend.
Step 5: Configure Dynatrace as a Destination
Next, define a dynatrace_output node in the pipeline. The node transmits logs to a Dynatrace ingest endpoint over TLS and requires a token with the logs.ingest scope. A basic configuration looks like this:
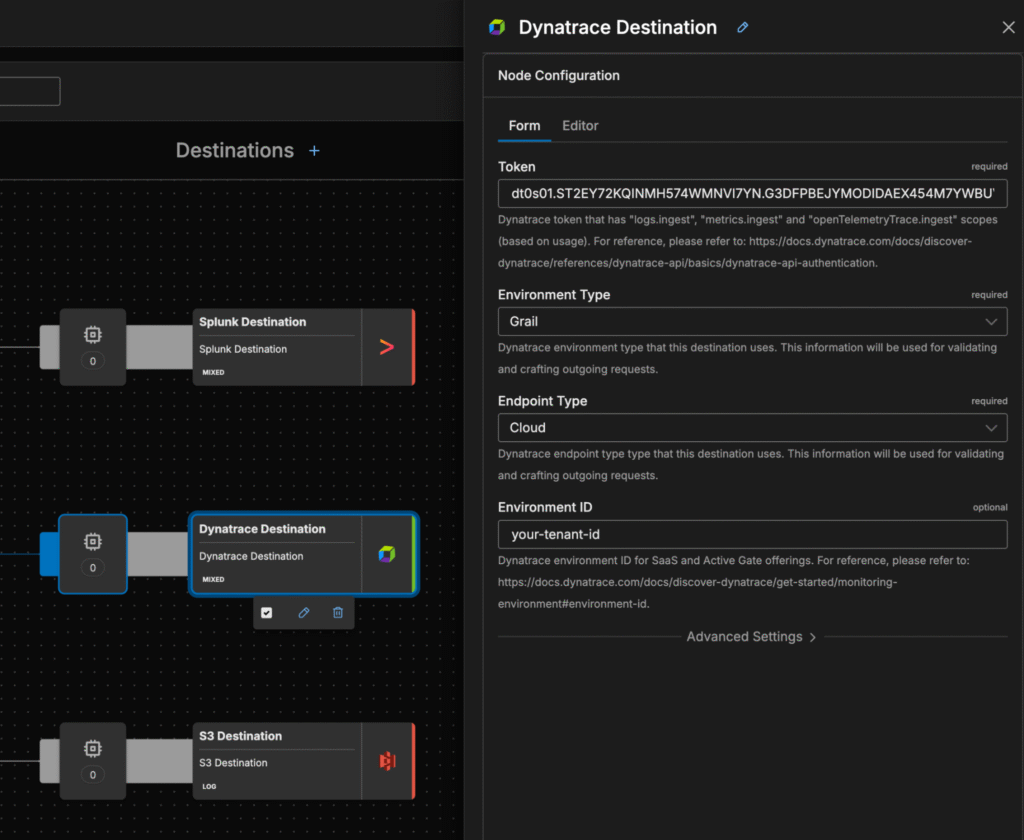
Once the Splunk source and Dynatrace destination are both defined, you can connect them directly by linking in your pipeline.
Step 6: Validate Pre-Processing and Adjust Routing
During migration, it’s recommended to send logs to both Splunk and Dynatrace concurrently. Edge Delta Telemetry Pipelines support multiple destinations, so you can continue sending data to Splunk while feeding Grail. By comparing query results across the two platforms, you can validate that your pre‑processing and field mappings preserve important information. For audit and backup (and peace of mind), you may also configure an Amazon S3 or Azure Blob storage destination to archive full log copies.
Mapping Splunk SPL to Dynatrace DQL
One of the biggest technical hurdles is adjusting log analytics queries. Splunk uses the Search Processing Language (SPL), while Dynatrace uses Dynatrace Query Language (DQL). DQL is pipeline‑based; each stage applies an operation and passes records to the next stage. For instance, to find the distribution of HTTP status codes in Grail you would write:
fetch logs
| filter contains(content, "haproxy")
| parse content, "LD 'HTTP_STATUS ' INT:httpstatus" # extract httpstatus field
| filter httpstatus >= 400
| summarize count(), by:{httpstatus}   # aggregate errors by status code
The fetch logs command loads log records from Grail tables. Functions like filter and parse operate on each record, while summarize aggregates results. When migrating, review your existing SPL queries and replicate them using DQL functions such as filter, contains, parse, summarize and group by.
Dynatrace’s schema‑on‑read architecture means that field extraction happens at query time unless you pre‑structure logs in Edge Delta. Pre‑structuring fields with Edge Delta processors simplifies queries and improves performance.
Cut‑Over Strategy
To minimize risk, follow a phased approach when migrating from Splunk to Dynatrace:
- Assessment: Inventory Splunk indexes, data volumes, critical dashboards, and alerts. Identify fields used by existing SPL queries. Decide which logs need to be retained in Grail and their retention periods.
- Pilot: Deploy Edge Delta to a non‑critical environment and forward a subset of Splunk logs. Validate the pipeline, test DQL queries, and compare results with SPL outputs.
- Dual‑write: Configure Edge Delta to send data to both Splunk and Dynatrace. Migrate dashboards by recreating them using Dynatrace notebooks or dashboards, mapping SPL to DQL. Train teams on DQL and Grail’s schema‑on‑read behavior.
- Optimize: Refine processors to extract fields, drop unneeded data, and summarize metrics. Use anomaly detection patterns to surface issues early.
- Decommission Splunk: After verifying that log analytics and alerting operate correctly in Dynatrace, disable Splunk ingestion and finalize the cut‑over. Continue to archive full log copies (e.g., in S3) if long‑term compliance is required.
Best Practices
As you transition from Splunk to Dynatrace, the following best practices will help ensure data integrity, security, and compliance throughout the migration.
- Data format differences: Splunk events are JSON objects with
event,time,host, andsourcefields. Dynatrace logs containcontent,timestamp, andattributes. Use Edge Delta parse processors to extract Splunk fields into Dynatrace’sattributessection to enable filtering and aggregation. - Token and security management: Generate Dynatrace tokens with least privilege scopes (
logs.ingest). Store tokens in Kubernetes secrets or environment variables. - Compliance and auditing: If regulations require long‑term retention, use Edge Delta to route a full copy of logs to an archival storage solution like Amazon S3 or Azure Blob Storage. Keep track of Splunk and Dynatrace data retention policies.
Conclusion
Migrating logs from Splunk to Dynatrace is a significant undertaking because the two platforms differ fundamentally in their storage architecture, query language, and pricing models.
Splunk’s index‑based approach with Universal Forwarders and SPL queries is powerful, but as data volumes grow, ingest costs and operational complexity increase. Dynatrace Grail offers a unified, schema‑on‑read and indexless data lakehouse where logs, metrics, and traces are interlinked, and queries are run via DQL with built‑in AI assistance. Edge Delta’s Telemetry Pipelines provide the glue between these ecosystems, enabling streaming transformation, cost‑effective filtering, and structured log enrichment while the data is still in flight.
By deploying Edge Delta as a front-door to their log pipeline, organizations can migrate to Dynatrace Grail without losing critical insights. Taking a phased approach — pilot, dual‑write, optimize, and cut‑over — helps mitigate risk and ensures uninterrupted observability. The result is a smoother migration that unlocks Dynatrace’s AI‑powered analytics while keeping data volumes and costs under control.
From ingestion to insight — modern observability starts with Edge Delta. Experience it yourself in our free-to-use playground, or start a free trial.


