

Edge Delta’s AI Teammates are modernizing how observability and security teams investigate and remediate issues. These autonomous AI agents collaborate with each other in real time to analyze live telemetry data, surface anomalies, and initiate fixes, all while sharing their reasoning and actions to keep humans in the loop every step of the way.
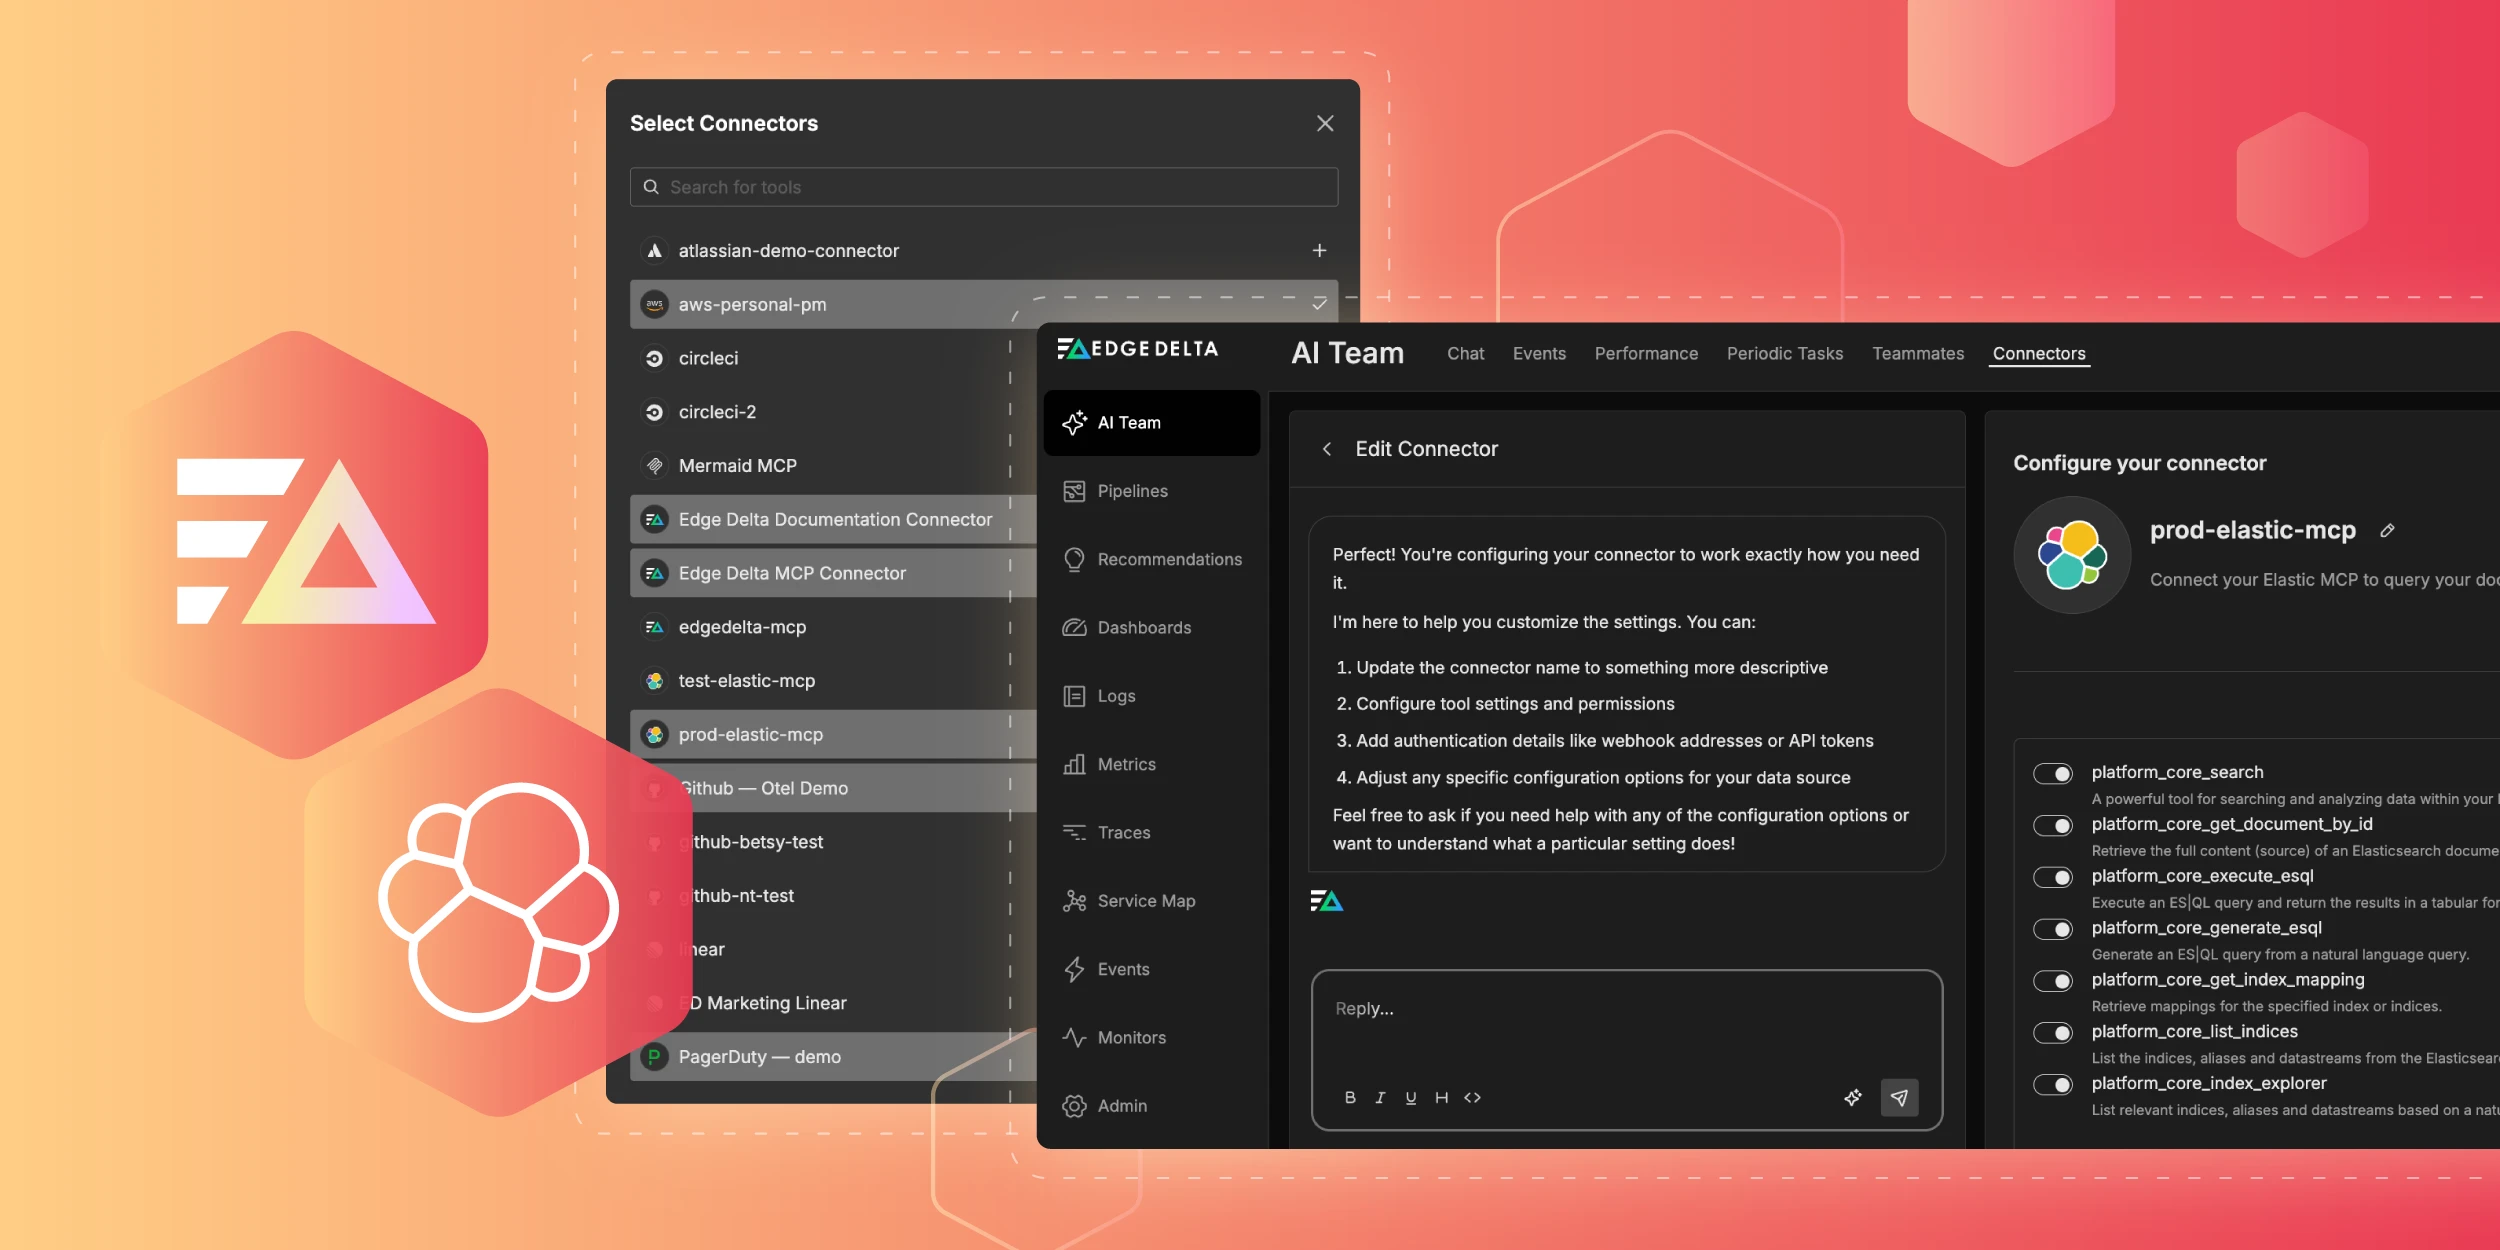
To run real-time workflows effectively, agents need direct access to the systems where data lives. Edge Delta’s extensive connector catalog exposes third-party tools via the Model Context Protocol (MCP) to AI Teammates, enabling them to query, enrich, and act on external data living outside Edge Delta’s Observability Platform as needed.
One of the most common sources of that data is Elastic. As a foundational platform for logs, metrics, and analytics, it often holds critical telemetry data teams rely on during investigations. With the Elastic MCP Connector, Edge Delta’s AI Teammates can securely query Elastic indices on demand, pull relevant context into active investigations via ES|QL, and use queried data to drive faster, more accurate remediation workflows.
In this post, we’ll walk through how to set up the Elastic connector in just a few steps, and put it to work in real-world workflows.
How to Configure the Elastic MCP Connector
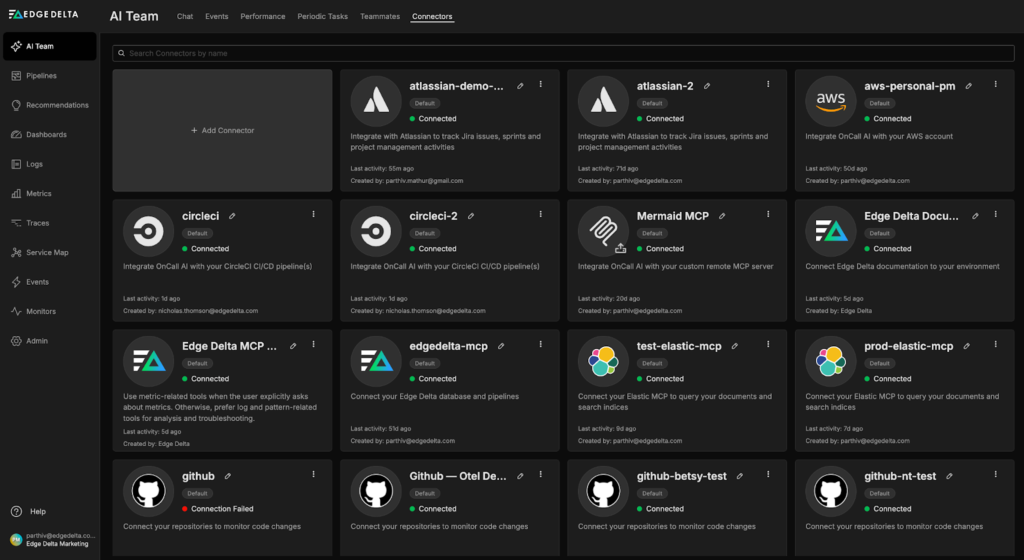
To get started, we’ll need to add a new Elastic MCP Connector to our environment and configure it. First, let’s navigate to Edge Delta’s Connectors page in the “AI Team” section and click the “Add Connector” button:
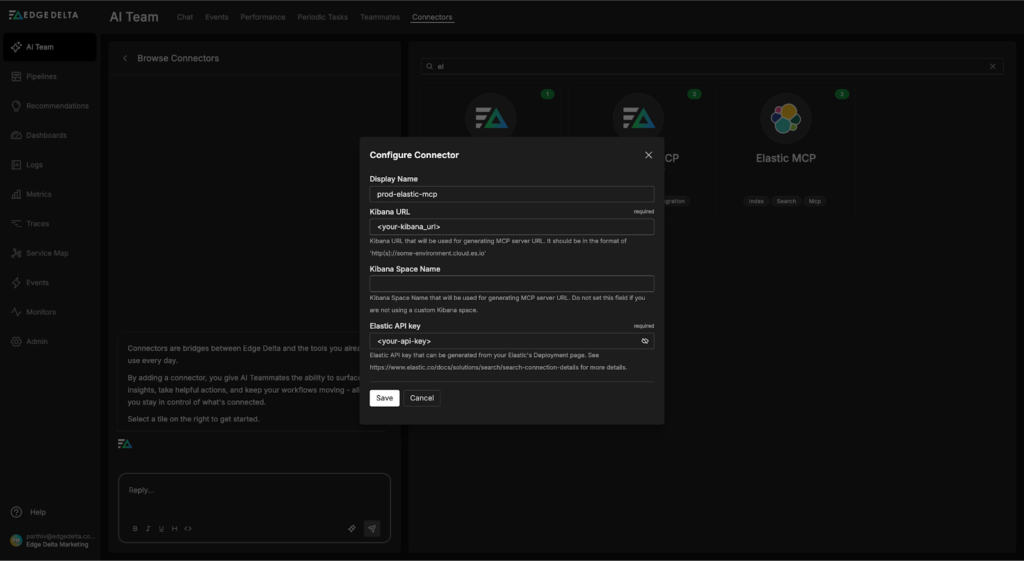
From there, we can select the Elastic MCP Connector and fill out the required fields (all that’s required is your Elastic Kibana URL and an API key with sufficient permissions to query the relevant indices):
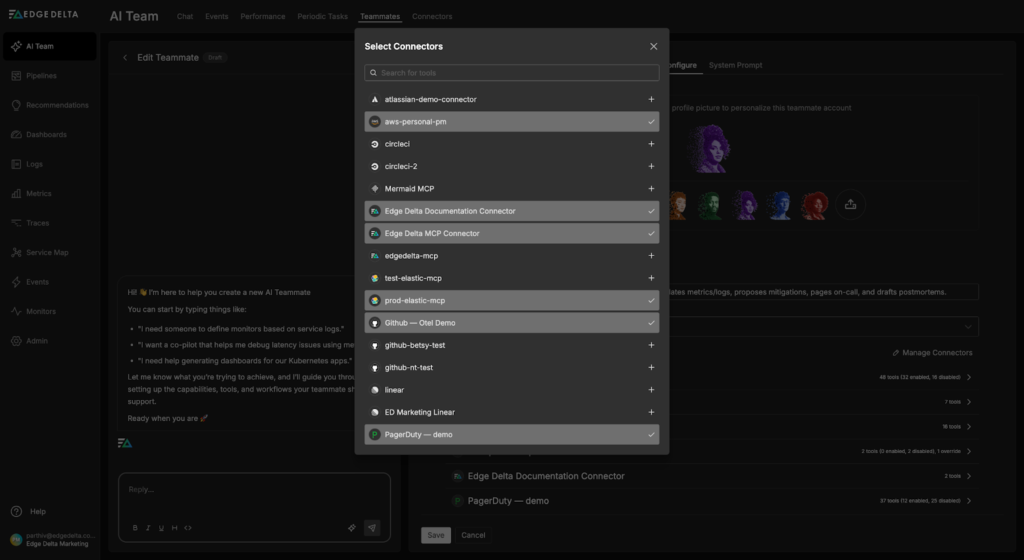
Once configured, we’ll need to give our Teammates access to the Elastic MCP Connector. In this case, only the SRE Teammate needs Elastic query access — we can grant it by navigating to the relevant configuration page, selecting the “Manage Connectors” button, and clicking the plus icon next to the “prod-elastic-mcp” Connector:
Once saved, the SRE Teammate can pull data from Elastic in real time as part of its workflows when needed for troubleshooting or investigations.
Now that our Elastic Connector is configured, let’s walk through a real-world use case to show it in action.
Accelerating Remediation with the Elastic MCP Connector
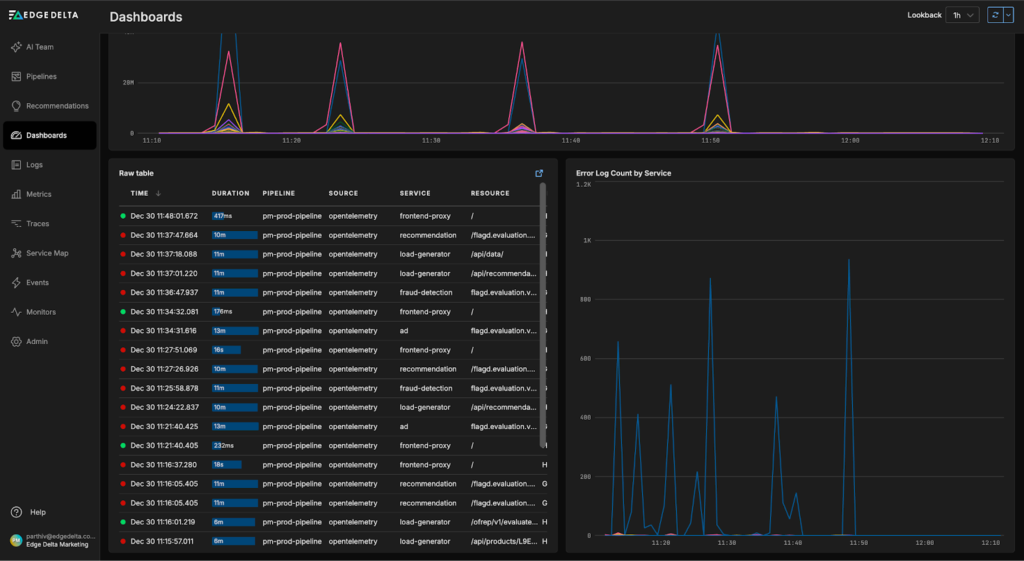
In many environments, datasets are intentionally split across systems to optimize costs and simplify operational workflows. In the example scenario below, we are shipping metrics, traces, and logs generated by the OpenTelemetry Demo into Edge Delta, with the exception of logs from the “frontend-proxy service”, which are routed into Elastic:
Recent insights from the “OpenTelemetry Demo Dashboard” indicate issues with the “frontend-proxy service” — including recent error log spikes and 504 responses in the trace data:
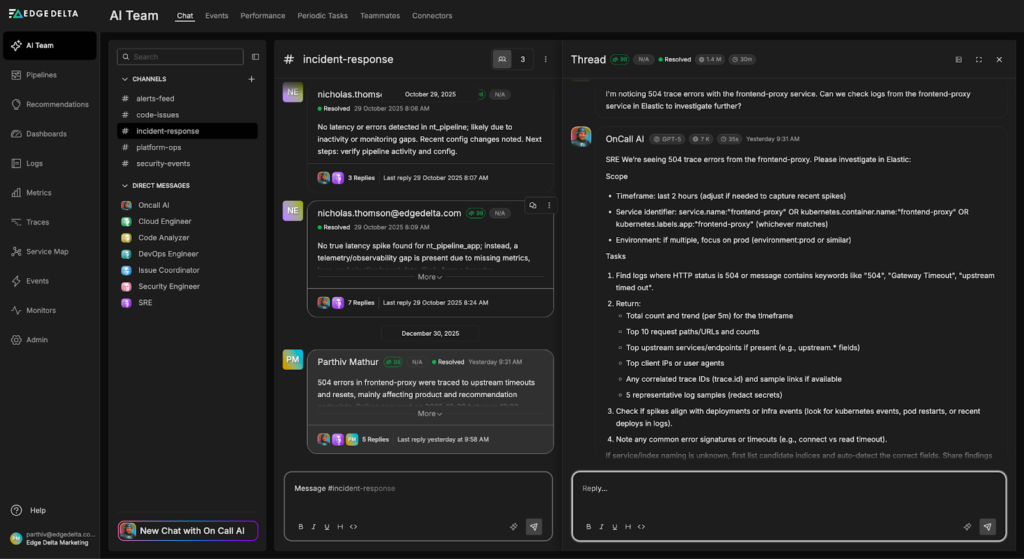
Let’s ask the AI Teammates to investigate. We start by sending a prompt to the “#incident-response channel”, where OnCall AI receives the investigation request and loops the appropriate teammates into the thread. Here, it asks the SRE Teammate to query the relevant frontend-proxy logs from Elastic to uncover any issues:
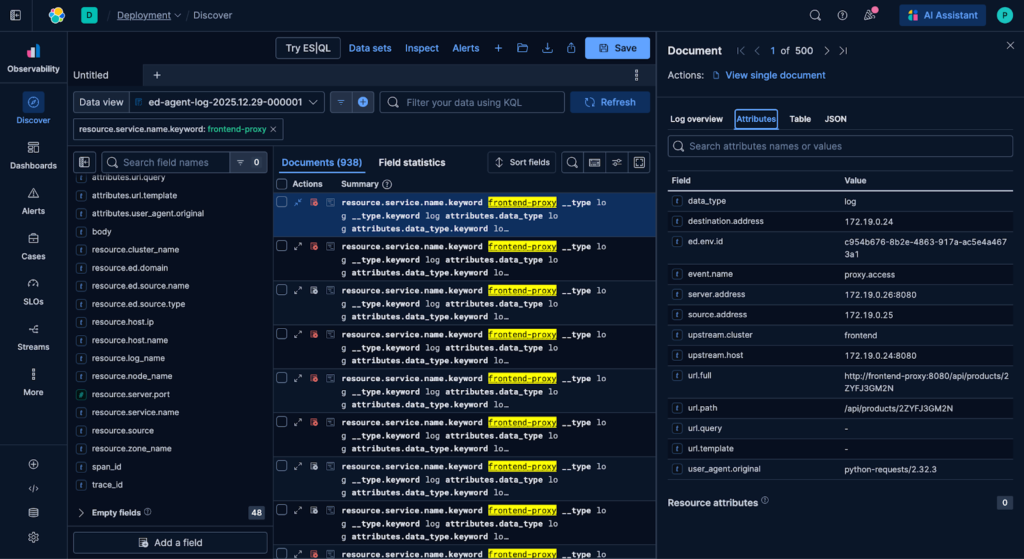
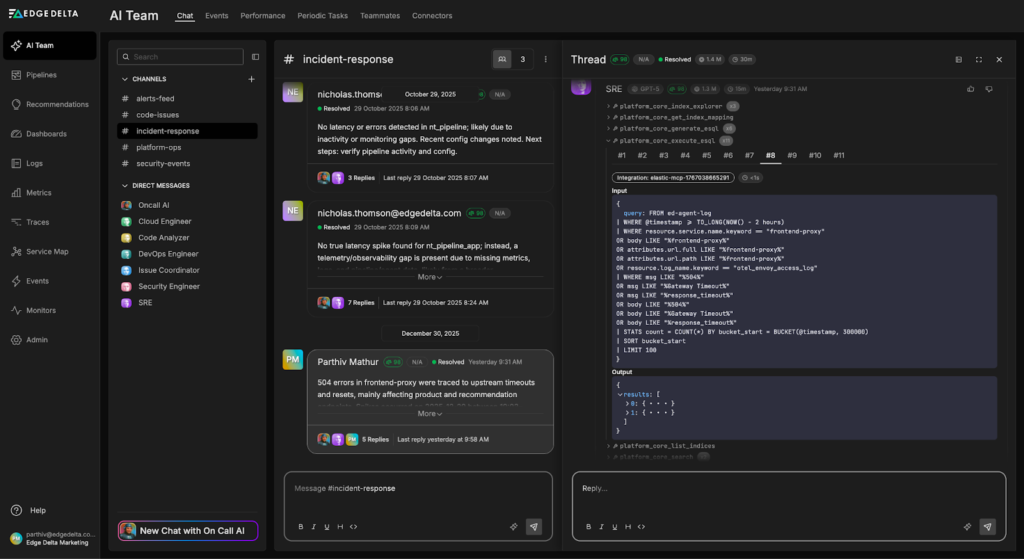
The SRE Teammate uses the newly created Elastic MCP Connector to build and run an ES|QL query that pulls logs with a service.name of “frontend-proxy” from the last two hours into the thread:
These logs are immediately incorporated into the active investigation — and with this context in place, the SRE Teammate identifies several impacted endpoints and a potential root cause:
-
Top request paths returning 504s
The majority of 504 errors originate from a small set of endpoints, primarily from the product and recommendation paths, including “/api/products/{id}”, “/api/recommendations?productIds={id}”, and “/api/cart”.
-
Upstream services and endpoints involved
Envoy logs show requests routed through the frontend upstream cluster, with repeated connections to the same backend pods — most notably “172.19.0.25”, and secondarily “172.19.0.26: 8080″. This suggests that timeouts or reset events are frequently occurring on a specific upstream instance.
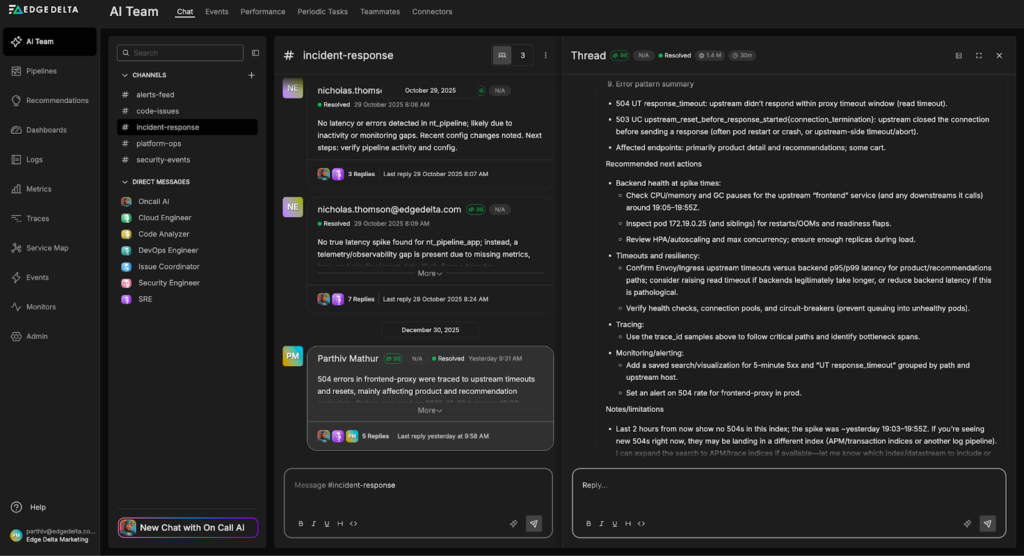
After identifying the potential root cause and confirming the issue is transient, the SRE Teammate proposes concrete remediation steps, including checking pod health, validating localhost connectivity, and reviewing upstream service configuration to prevent similar failures:
Conclusion
With Edge Delta’s extensive Connectors list, AI Teammates can seamlessly access logs, metrics, and traces indexed across multiple systems, eliminating the need to manually switch tools, write bespoke queries, or gather context. With the Elastic MCP Server, Teammates can autonomously pull telemetry data from Elastic, analyze it, and generate insights to guide investigation workflows and accelerate remediation.
To see how Edge Delta’s AI Teammates can help you power agentic remediation workflows, start a free trial.


