


Gaining relevant insights into business performance is crucial in achieving complete observability. For this reason, businesses rely on performance dashboards, as these tools help them better understand and visualize an organizational system. As a result, they can know what improvements to make to keep up with changing demands.
Performance dashboards are data visualization tools representing key performance indicators (KPIs) and metrics. With these tools, organizations can achieve observability by gaining real-time insights into business performance. They can use these insights to manage and monitor system processes and activities.
Optimizing these performance dashboards is essential to gaining accurate and detailed insights to improve business management performance. This article will guide you through performance dashboards and provide insight into their importance, components, implementation, and best practices.
Key Takeaways- Optimizing performance dashboards is a crucial observability practice to ensure effective data visualization. With an optimized dashboard, teams can have a clear and concise data representation for monitoring and issue detection.
- Factors like load balancing, resource utilization, data handling, query optimization, and user concurrency generally affect a dashboard’s performance and efficiency. Thus, optimizing dashboards involves improving these aspects.
- Critical strategies for implementing proper optimization techniques in a performance dashboard include optimizing data queries, efficient data aggregation and sampling, and improving dashboard design.
- With an optimized performance dashboard design, businesses can communicate precise data to users and provide easily accessible supporting information.
- Implementing best practices to optimize performance dashboards makes them responsive, reliable, and user-friendly. In this case, leveraging third-party observability tools like Edge Delta can help visualize data for better dashboard insights.
Importance of Dashboard Performance Optimization
Optimizing performance dashboards is crucial for effective data visualization. This process provides clear and concise data representations, making monitoring more manageable. Unlike traditional dashboards, optimized performance dashboards offer accurate data that is crucial in decision-making.
With an optimized performance dashboard, organizations can achieve observability and enjoy the following benefits:
- Improved user experience by enhancing load times, responsiveness with data metrics and options, and ease of use
- Faster troubleshooting and incident response by providing quick access to relevant data to reduce downtime and enhance reliability
- Scalability and efficiency by ensuring that data remains consistent even when diverse, complex, and massive volumes of data are available
This table summarizes the key factors affecting scalability and efficiency and explains why optimized dashboards are better than non-optimized ones.
| Factors | Optimized Dashboards | Non-Optimized Dashboards |
|---|---|---|
| Load Balancing | Offers effective load distribution | Obtains overloaded servers |
| Resource Utilization | Optimal use of system resource | High resource consumption |
| Data Handling | Provides efficient data processing | Provides slow performance |
| Query Optimization | Renders fast and coherent queries | Slow and resource-intensive |
| User Concurrency | Supports multiple users seamlessly | Performance degradation |
Although dashboards are helpful in operation, they can be challenging to integrate. The following section explores the key factors affecting dashboard performance.
Factors Affecting Dashboard Performance
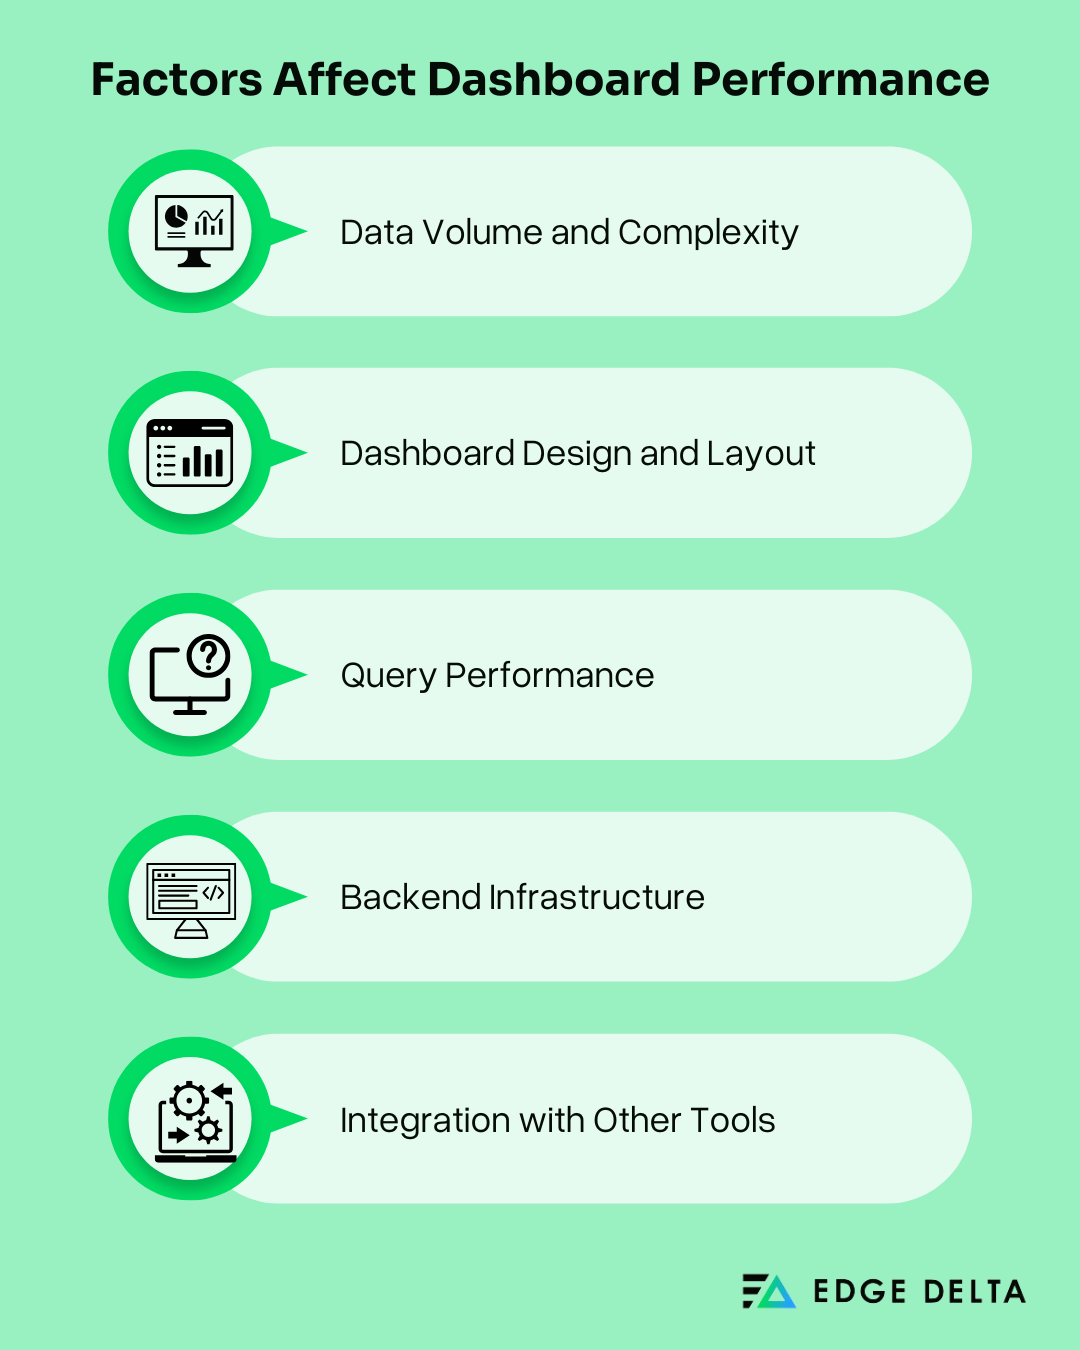
A well-optimized performance dashboard provides real-time data and ensures that these data are displayed accurately and quickly. This process enables better decision-making and a smooth user experience. However, several factors impacting how data is accessed must be addressed to achieve the optimal performance of dashboards. These factors include:
Read the following section to understand the key factors affecting the dashboard performance.
Data Volume and Complexity
Data volume and complexity are some of the significant factors that influence dashboard performance. When handling large datasets, team members require more time and computational resources to process and render insights. This practice can lead to slower load times and decreased system responsiveness.
Complex datasets have diverse and multiple variables and relationships that further complicate the system’s ability to present data. To address these challenges and streamline the rendering process, organizations usually employ practices in their operations that include
- Data aggregation techniques
- Caching accessed data regularly
- Using efficient storage solutions
Dashboard Design and Layout
The design and layout of a performance dashboard are essential in every organization. An intuitive, simple, and well-organized dashboard improves performance by minimizing the process of displaying data. Additionally, it enhances user performance and minimizes downtime as team members can easily navigate the dashboards.
Here are some best practices for designing intuitive and efficient dashboards:
- Practice minimalism: Provides importance on essential information and avoids overwhelming navigations.
- Implement responsive designs: Guarantee that dashboards work well across different screen sizes and devices.
- Use efficient visuals: Use simple charts and graphs representing the performance metrics.
- Organize layout logically: Foster an easily navigated dashboard layout for easy access and interpretation.
By following these guidelines, organizations can build user-centric and friendly performance dashboards.
Query Performance
Query performance is critical in ensuring dashboards’ responsiveness and providing up-to-date information. Ineffective queries cause significant data delays, leading to poor user performance.
To retrieve data more effectively, keeping dashboards responsible and accurate is essential. To that, here are some strategies that organizations take:
- Utilizing indexes to speed up the retrieval process
- Using optimized SQL to minimize resource usage
- Implementing data partitioning to make large datasets more manageable
- Employing caching mechanisms to reduce database loads
Backend Infrastructure
The backend infrastructure that supports dashboards influences its performance. Thus, a disorganized backend decreases scalability and increases latency. Optimization is also required for DevOps teams to gain a separate operation.
Factors from the backend infrastructure must be prioritized and optimized to leverage performance dashboards. This process involves:
- Minimizing Network Latency: Optimized network configurations and using CDN are necessary to reduce network latency.
- Maintaining database performance: Ensure a robust database system with efficient indexing and regular maintenance.
- Ensuring server capacity: A sufficient server resource is necessary to handle data processing and user requests.
Integration with Other Tools
Performance dashboards often integrate with other monitoring and observability tools to gain insight into a system’s data. When integrating dashboards, considering scalability and compatibility are crucial. This process helps maintain performance and ensure monitoring accuracy by using real-time data.
To ensure that dashboards integrate with other tools properly, here are some considerations organizations should consider:
- Data synchronization: Employ real-time synchronization to keep data updated.
- API efficiency: Ensure fast and reliable data exchange using APIs.
- Tool compatibility: Guarantee that dashboards and tools work with different systems to avoid performance issues.
Besides solving the factors that affect dashboard performance, you must also learn effective strategies for optimization.
6 Strategies for Optimizing Dashboard Performance
Key strategies are essential for implementing proper optimization techniques in your performance dashboards. The following strategies outline the optimization process of performance dashboards:
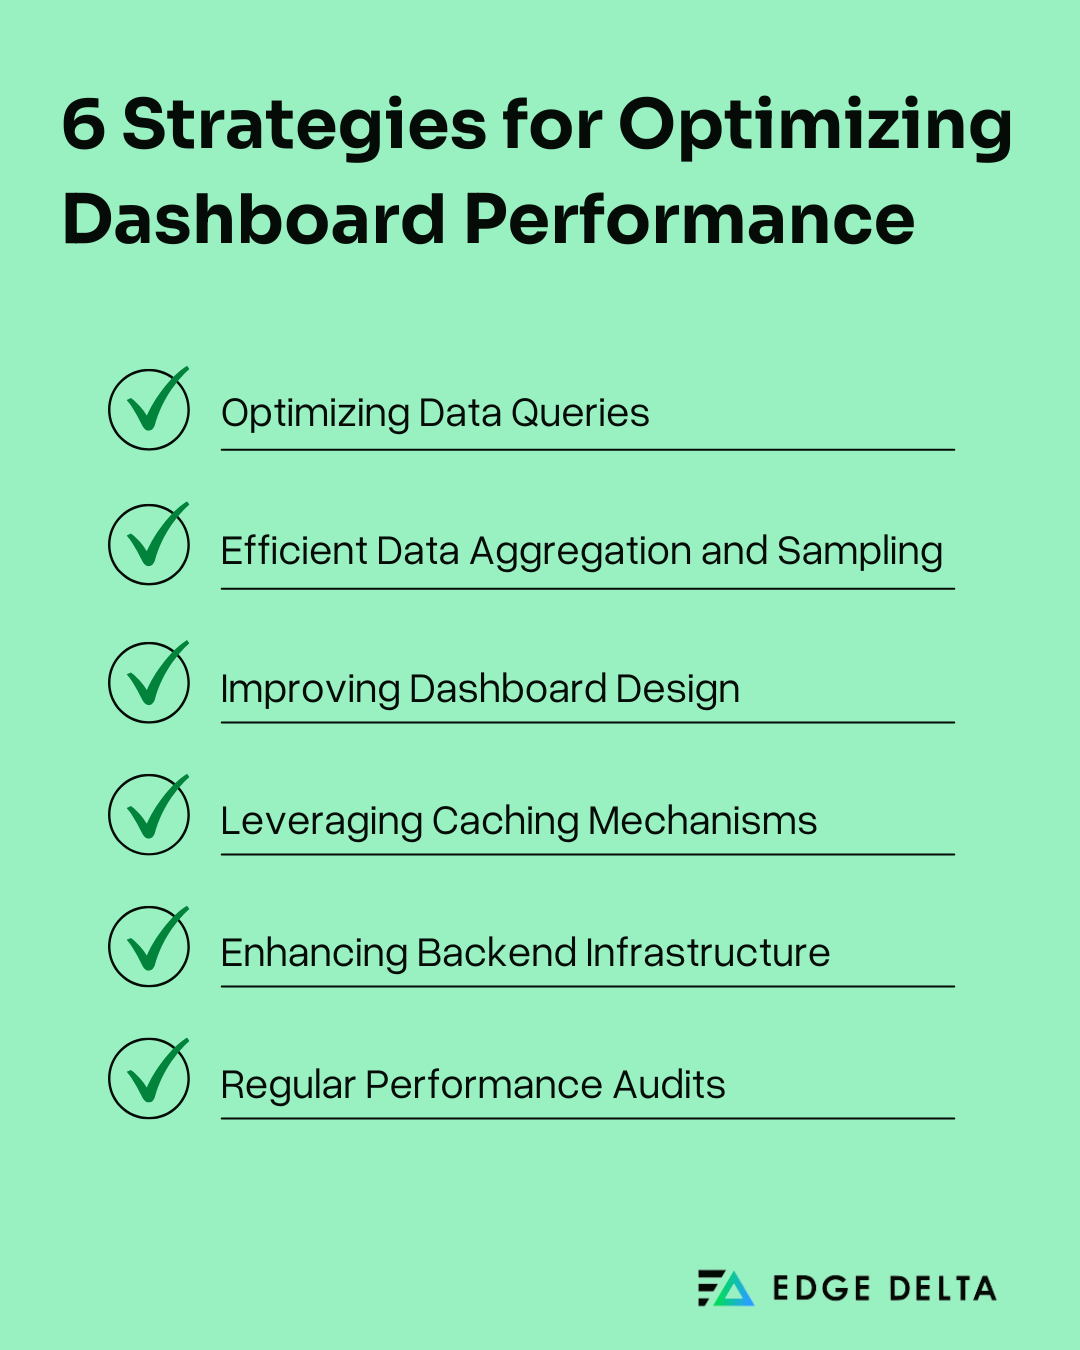
1. Optimizing Data Queries
Optimizing data queries is fundamental to improving performance dashboards. Systematic data retrieval guarantees fast lead times and up-to-date information, which is essential to performance indicators.
Implementing techniques helps streamline data retrieval and reduce system latency. To better optimize data queries, organizations implement the following strategies into their performance dashboards:
- Indexing: to speed up data retrieval, especially in queried fields
- Reduce Data Scope to limit the retrieved data by selecting only relevant data and filters
- Query optimization to minimize resource consumption and prevent unnecessary operations
2. Efficient Data Aggregation and Sampling
Aggregation platforms collect, process, and present data, which is fundamental to integrating performance dashboards. Data aggregation and sampling are crucial components, especially in handling large datasets.
Sampling and data aggregation gather data from multiple sources and summarize it uniformly. Organizations that need to gain market trends and insights heavily rely on data aggregation tools because these tools perform the necessary actions, including:
- Data extraction: Involves targeting and isolating relevant data from aggregated data to ensure it meets industry standards and needs.
- Data visualization and analysis: Provides a visual representation of the analyzed data and KPI, which is used for actionable business intelligence.
- Modification: Transform data into its prescribed formats reflected in the data analysis.
3. Improving Dashboard Design
Effective performance designs are crucial for dashboards. A good dashboard design can communicate precise information to users and make supporting information easily accessible. This strategy facilitates complex information into visually digestible formats that enable team members to comprehend and make informed decisions.
An improved dashboard design also promotes collaborations and provides a centralized platform for users. Some features of an effective dashboard include:
- Showing actionable and valuable information at a glance
- Simplifying the visual representation of complex data
- Offering clear, intuitive, and customizable insights
- Reducing complexity to provide clarity
- Helping stakeholders understand, analyze, and present critical insights
To implement effective dashboard designs, here are some tips that organizations need to consider:
- Use a minimalistic layout. Focus on necessary information and avoid clutter to reduce load times.
- Select appropriate visualizations. Choose designs that are quick to render and obtain easily understood navigations.
- Create a responsive design. Ensure it is easily integrated across diverse platforms.
4. Leveraging Caching Mechanisms
The caching mechanism can dramatically enhance dashboard performance by storing frequently accessed data for fast retrieval. The cached data is commonly stored in fast-paced hardware; one example is RAM. The primary benefit of caching is that it increases data retrieval performance by reducing the need to gain access to the underlying slow storage layer.
Here are some strategies involved in leveraging caching mechanisms into performance dashboards:
- Database Caching: Cache query results in reducing the load on the database.
- Content Delivery Networks (CDNs): This tool efficiently caches and delivers stationary assets.
- In-Memory Caching: Storing data in memory to decrease access time.
5. Enhancing Backend Infrastructure
A robust backend infrastructure is required to support high-performance dashboards. Backend development is paramount in enhancing user experience and driving business growth. Businesses can create a faster, more personalized, and more secure user experience by prioritizing backend optimizations, which include:
- Server-side logic
- Data management
- Security
Here are some recommendations for organizations needing to enhance their backend infrastructure:
- Network Optimization: Optimizing network structures to improve data transfer speed and reduce delays
- High-Performance Database: Utilizing databases that are optimized for scalability and high performance
- Server Upgrades: Boosting server capacity to manage more diverse and simultaneous requests and large data volumes
6. Regular Performance Audits
Implementing regular performance audits is vital in maintaining optimal dashboard performance. Frequent assessments help identify and address performance problems proactively. Further, it examines an organization’s activities and programs to ensure they are effective and comply with industry standards and regulations. Unlike traditional financial audits, which focus solely on financial statements, an audit evaluates the dashboards:
- Operations’ economy
- Efficiency
- Effectiveness
Here are the advantages of employing regular audits in performance dashboards:
- Early Problem Detection by identifying bottlenecks and performance issues before they affect other systems
- Continuous Improvement by implementing adjustments to keep dashboards performing at their full potential
Here’s a table summarizing the different optimization strategies and their expected benefits.
| Strategy | Description | Expected Benefit |
|---|---|---|
| Optimizing Data Queries | Techniques such as indexing, query optimization, and reducing data retrieval scope to improve data query efficiency | Faster load times, reduced latency, and improved data retrieval efficiency |
| Efficient Data Aggregation | Methods to aggregate data efficiently and use sampling to manage data volume effectively | Reduced data volume, improved responsiveness, and faster data processing |
| Improving Dashboard Design | Best practices for designing intuitive and efficient dashboards, including layout optimization, appropriate visualization types, and minimizing clutter | Enhanced user experience, improved clarity, and faster load times |
| Leveraging Caching Mechanisms | Implementing caching to store frequently accessed data | Reduced server load, quicker data rendering, and faster access time |
| Enhancing Backend Infrastructure | Upgrading resources, optimizing network configuration, and using high-performance databases to support robust dashboard performance | Improved scalability, better performance, and increased reliability |
| Regular Performance Audits | Conducting frequent assessments to identify and address performance bottlenecks proactively | Early detection of issues, continuous improvement, and sustained optimal performance |
Discover the best practices in fainting dashboard performance in the following section.
Best Practices for Maintaining Dashboard Performance
Since maintaining dashboard performance is challenging, ensuring dashboards deliver accurate and timely insights is crucial. However, maintaining a dashboard can take much work, specifically for non-technical users.
Here’s a table summarizing the practices that can improve dashboard performance and its benefits.
| Best Practice | Description |
|---|---|
| Continuous Monitoring and Feedback | Implementing continuous assessment from user input to ensure dashboards remain efficient and effective |
| Training and Documentation | Providing proper training and comprehensive documentation to support maintainers and users |
| Cross-Department Collaboration | Ensuring alignment and sharing best practices across departments to enhance dashboard performance |
| Implementing Automation | Streamlining performance audits and optimizations through automation tools and processes |
Continuous Monitoring and Feedback
Ongoing monitoring allows team members to detect and handle issues before they become big and can affect other users. On the other hand, feedback supplies an overview and insights into how the dashboards are utilized and performing. Additionally, it can determine if specific areas need improvement.
To implement continuous monitoring and feedback, organizations use the following practices:
- Gathering User Feedback: Regularly accumulating feedback from users to better understand the experiences and determine areas that are not functioning or need modifications.
- Investigating Performance Metrics: Investigate performance metrics to detect trends and potential issues, enabling predictive maintenance.
- Employing Real-Time Monitoring: Implementing tools for monitoring dashboards in real-time and tracking metrics such as load times, user activity, and error rates.
Training and Documentation
When team members and stakeholders are well trained, navigating dashboard performance will become fast and efficient. Additionally, training and documentation allow users to utilize dashboards and effectively address issues when they arise.
Here are practices that organizations can employ in their operations:
- Conduct User Training: Provide regular training, workshops, and hands-on experiences to ensure users understand how to use dashboards effectively.
- Implement Maintenance Training: Train IT developers and DevOps teams on the best practices for dashboard troubleshooting and management.
- Practice Comprehensive Documentation: Ensure detailed documentation of the dashboard activities. This data should cover dashboard functionalities, issues, maintenance procedures, and changes to ensure consistency.
Cross-Department Collaboration
Collaboration ensures that team members from diverse departments share their experiences and insights, ensuring that their goals and practices align. This practice leads to more effective, organized, and coherent dashboard management.
The following steps should be employed within the organization to practice cross-departmental collaborations:
- Holding Regular Meetings: Ensure that different departments attend the organization’s meetings to discuss dashboard insights, share performance, and update status.
- Enhance Communication and Share Objectives: Practice good communication among team members and ensure that your objectives align to provide a unified approach to handling dashboards.
- Collaborate and Implement Best Practices: Sharing best practices and successful strategies to maintain and optimize dashboard performance.
Implementing Automation
Incorporating automation into dashboards can significantly streamline the workflow and the performance audits, updates, and optimization process. It is essential to use automation tools that can easily integrate and are compatible with the existing dashboard system.
These automation tools can handle repetition, enabling team members to focus more on complex issues and processes. Here are some strategies in which organizations can implement automation:
- Employing Automated Monitoring: Automate dashboard performance monitoring to alert users of potential issues.
- Implementing Schedules Maintenance: Employ data clean-up and performance audits to ensure optimal dashboard performance.
- Automating Regular Updates: Update dashboards to ensure they provide accurate trends and insights.
Bottom Line
A performance dashboard is a prominent tool that allows organizations to track and analyze relevant metrics and data. It is essential for making informed decisions and optimizing overall business performance.
Organizations can ensure that the dashboards remain effective, responsive, and reliable by optimizing dashboard performance and implementing strategies and best practices. It also provides visualizations and streamlines processes, which is essential to staying ahead of the curve in this ever-changing digital landscape.
FAQs on Performance Dashboards
What is the purpose of a performance dashboard in performance management?
Performance dashboards help monitor, measure, and analyze relevant data to improve system performance.
What is the role of dashboards in the context of performance monitoring, analysis, and optimization?
Dashboards are visual tools for analyzing and tracking key performance indicators (KPIs). With these tools, teams can make data-driven decisions and optimize system performance.
What is the use of dashboards in continuous monitoring?
Dashboards enable continuous monitoring of program performance against predefined targets and benchmarks.
Sources:

