


Prometheus has become a cornerstone for collecting system metrics from cloud-native and microservice environments. However, integrating Prometheus with telemetry pipelines poses several challenges — especially when it comes to deduplication, scaling, and visibility.
That’s why we’re thrilled to introduce Edge Delta’s Prometheus Scraper. Built on our robust and scalable architectural foundation, this new tool enables teams to collect Prometheus-format metrics and visualize them on real-time dashboards — without running a separate Prometheus instance.
In this post, we’ll walk through three benefits of using the Edge Delta Prometheus Scraper — and show you how to get started.
Streamline Migrations with a Drop-In Replacement for Prometheus
One of the most compelling advantages of Edge Delta’s Prometheus Scraper is that it acts as a drop-in replacement for standard Prometheus setups. Teams do not need to modify their existing scrape configurations or Prometheus-compatible targets, which streamlines migrations by significantly reducing manual overhead. The added flexibility also eliminates vendor lock-in, allowing teams to cut costs while upgrading their metric-based monitoring experience.
Additionally, users can port over existing Prometheus scrape configurations and apply them directly to our Prometheus Input node or Target Allocator component without needing to rewrite them. We’ll explore the Target Allocator in more detail in the following sections.
Scale Efficiently with the Target Allocator
The Prometheus Scraper was designed to support horizontal scalability, making it ideal for large Kubernetes clusters or environments with fluctuating workloads.
This is made possible by the Target Allocator (TA) — a dynamic coordination component that intelligently distributes scraping responsibilities across agents. Rather than having individual agents scrape every target (which leads to data duplication and resource waste), the TA ensures that each agent is assigned a subset of targets based on consistent hashing. This approach leads to better CPU and memory efficiency, faster recovery in case of failure, and optimal network usage.
Whether you have a few services or thousands, the system automatically adapts without reconfiguring scrape definitions or rebalancing workloads manually. This means you can start small and scale seamlessly — without bottlenecks, coordination drift, or uneven data collection.
For reference, here is a diagram of how the TA manages the load distribution between Edge Delta agents:
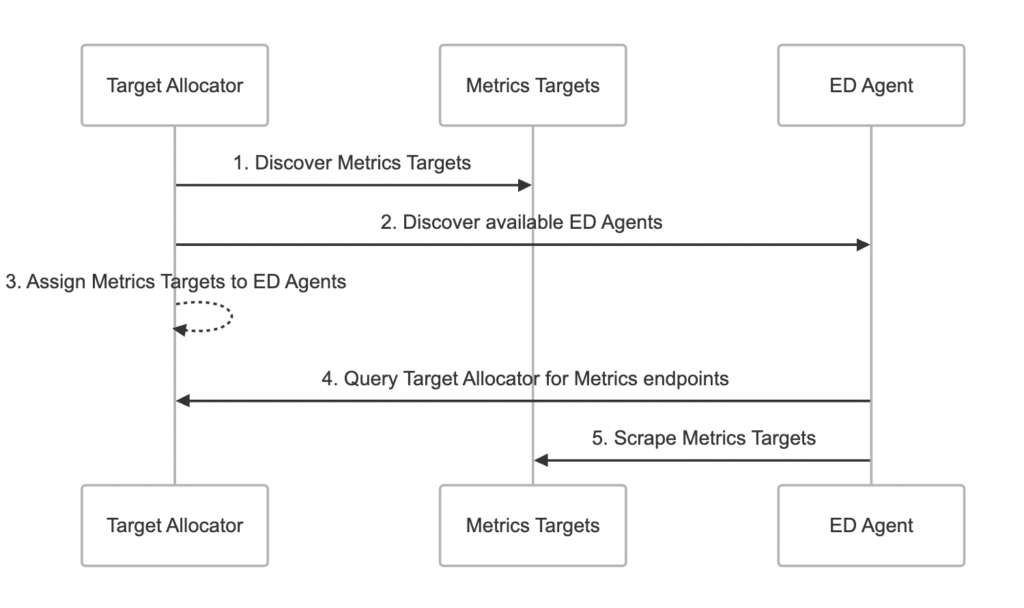
Thanks to OpenTelemetry for the diagram design inspiration.
Leverage Your Existing Configuration with Custom Resource Discovery
In addition to distributing scraping responsibilities, the TA is also responsible for discovering Custom Resources (CRs) in Kubernetes environments. This powerful capability allows teams to instantly leverage their existing observability configuration without any additional setup. For example, if a customer has defined PodMonitors and ServiceMonitors for their workloads (as they typically would when using Prometheus), the TA will automatically discover and assign them to the right agents.
In effect, the Prometheus Scraper and TA work together to replicate the behavior of Prometheus — without requiring the user to run, scale, or maintain their own infrastructure. This process greatly simplifies onboarding and migration, offering a drop-in experience while preserving existing observability strategies. It also prevents over-scraping and ensures balanced workload distribution.
To get going, all you need to do is install the Target Allocator using a simple Helm command and apply the configuration:
targetAllocator:
  configuration:
    prometheus_cr:
      enabled: true
      pod_monitor_selector:
        matchLabels: {}
        matchExpressions: []
        scrape_interval: 30s
      service_monitor_selector:
        matchLabels: {}
        matchExpressions: []
Get Started
Edge Delta’s Prometheus Scraper offers a seamless, scalable alternative to traditional Prometheus deployments — eliminating the operational overhead of running and maintaining your own instance. With intelligent target distribution, custom resource discovery, and a drop-in setup experience, teams can streamline their metrics pipeline without disrupting existing workflows.
For more information, check out our documentation.


