

Today, we’re launching support for ingesting Kubernetes metrics. When you use Edge Delta, you’ll be able to…
- Automatically capture your most useful Kubernetes metrics, reducing time series ingestion by 90%.
- Correlate anomalous metrics to the relevant logs without context switching for faster troubleshooting.
- Interact with metrics via out-of-the-box views that help you hit the ground running and create custom dashboards to meet your unique needs.
We’ll get into the longer version of this story below.
At launch, Edge Delta will automatically collect, analyze, and ingest the “golden signals” (latency, traffic, errors, and saturation), along with the kubelet, cAdvisor, and node-exporter libraries for each of your Kubernetes clusters. In the coming months, we have plans to expand support for metrics to other data sources.
Start a free trial
Here’s a demo, so you can see the updates firsthand:
Demo: Introducing Kubernetes Metrics
The Challenge: K8s Metrics Can Be Overwhelming and Expensive
Since our founding, Edge Delta has focused on the challenges of large-scale observability. We believe that…
- It’s not sustainable to ingest complete raw datasets into a legacy observability platform, given the rate data continues to grow.
- You shouldn’t have to spend your time looking for “needles in the haystack” – especially when those haystacks fill 237 barns across 16 states (figuratively speaking).
- Observability platforms should be easy to set up and maintain – not requiring specialized support or consultants.
Historically, we’ve attacked these problems head-on, first by focusing on log data. However, the same challenges are prevalent with metrics-first teams.
More specifically, when teams are monitoring applications running in Kubernetes, they rely on a combination of custom metrics and out-of-the-box metrics libraries. Each library bundles up hundreds of unique metrics and populates your observability tooling.
In a Kubernetes-based environment, it’s not uncommon to ingest millions of time series each minute.
Developers often want access to more of their metrics. But, the teams that own the observability tooling need to be mindful of spending and, thus, look for ways to limit ingestion. Finding the right balance of data to meet both of these needs – not too few metrics, but too many – turns into a fool’s errand.
Moreover, teams can easily become overwhelmed by the volume of metrics their applications generate. Many of the ingested metrics are ignored, resulting in organizations paying – often exorbitant costs – to store data that are not useful nor ever used.
Lastly, it can be difficult to move from monitoring to troubleshooting. Doing so requires context switching (and often platform switching), going from a high-level summary of behavior in the form of metrics to sifting through massive amounts of log data.
How Edge Delta Approaches Metrics
Analyze Metrics at the Edge to Control Costs and Noise
At the point of collection (i.e., the agent level), we distill all 500+ possible metrics across supported metrics libraries into the ones that:
- Users access most frequently
- Have the greatest effect on Kubernetes infrastructure health
- Teams might want to alert on
This reduces the total number of metrics you ingest to roughly 50, capturing only the critical metrics for troubleshooting and quick resolution.
As always, we’ve prioritized performance with this release. The Edge Delta agent now uses eBPF to collect node-level metrics directly from the Linux kernel and maximize resource efficiency.
Get Up and Running Fast with Out-of-the-Box Views
This release is designed to provide a launchpad to complete observability and get you started in minutes. With this in mind, metrics are presented in the Edge Delta interface via out-of-the-box dashboards and a direct metrics explorer tool.
(Note: If you’re an existing Edge Delta customer, you can start ingesting metrics by adding the k8s_traffic_input and ed_k8s_metrics_input nodes to your agent configuration.)
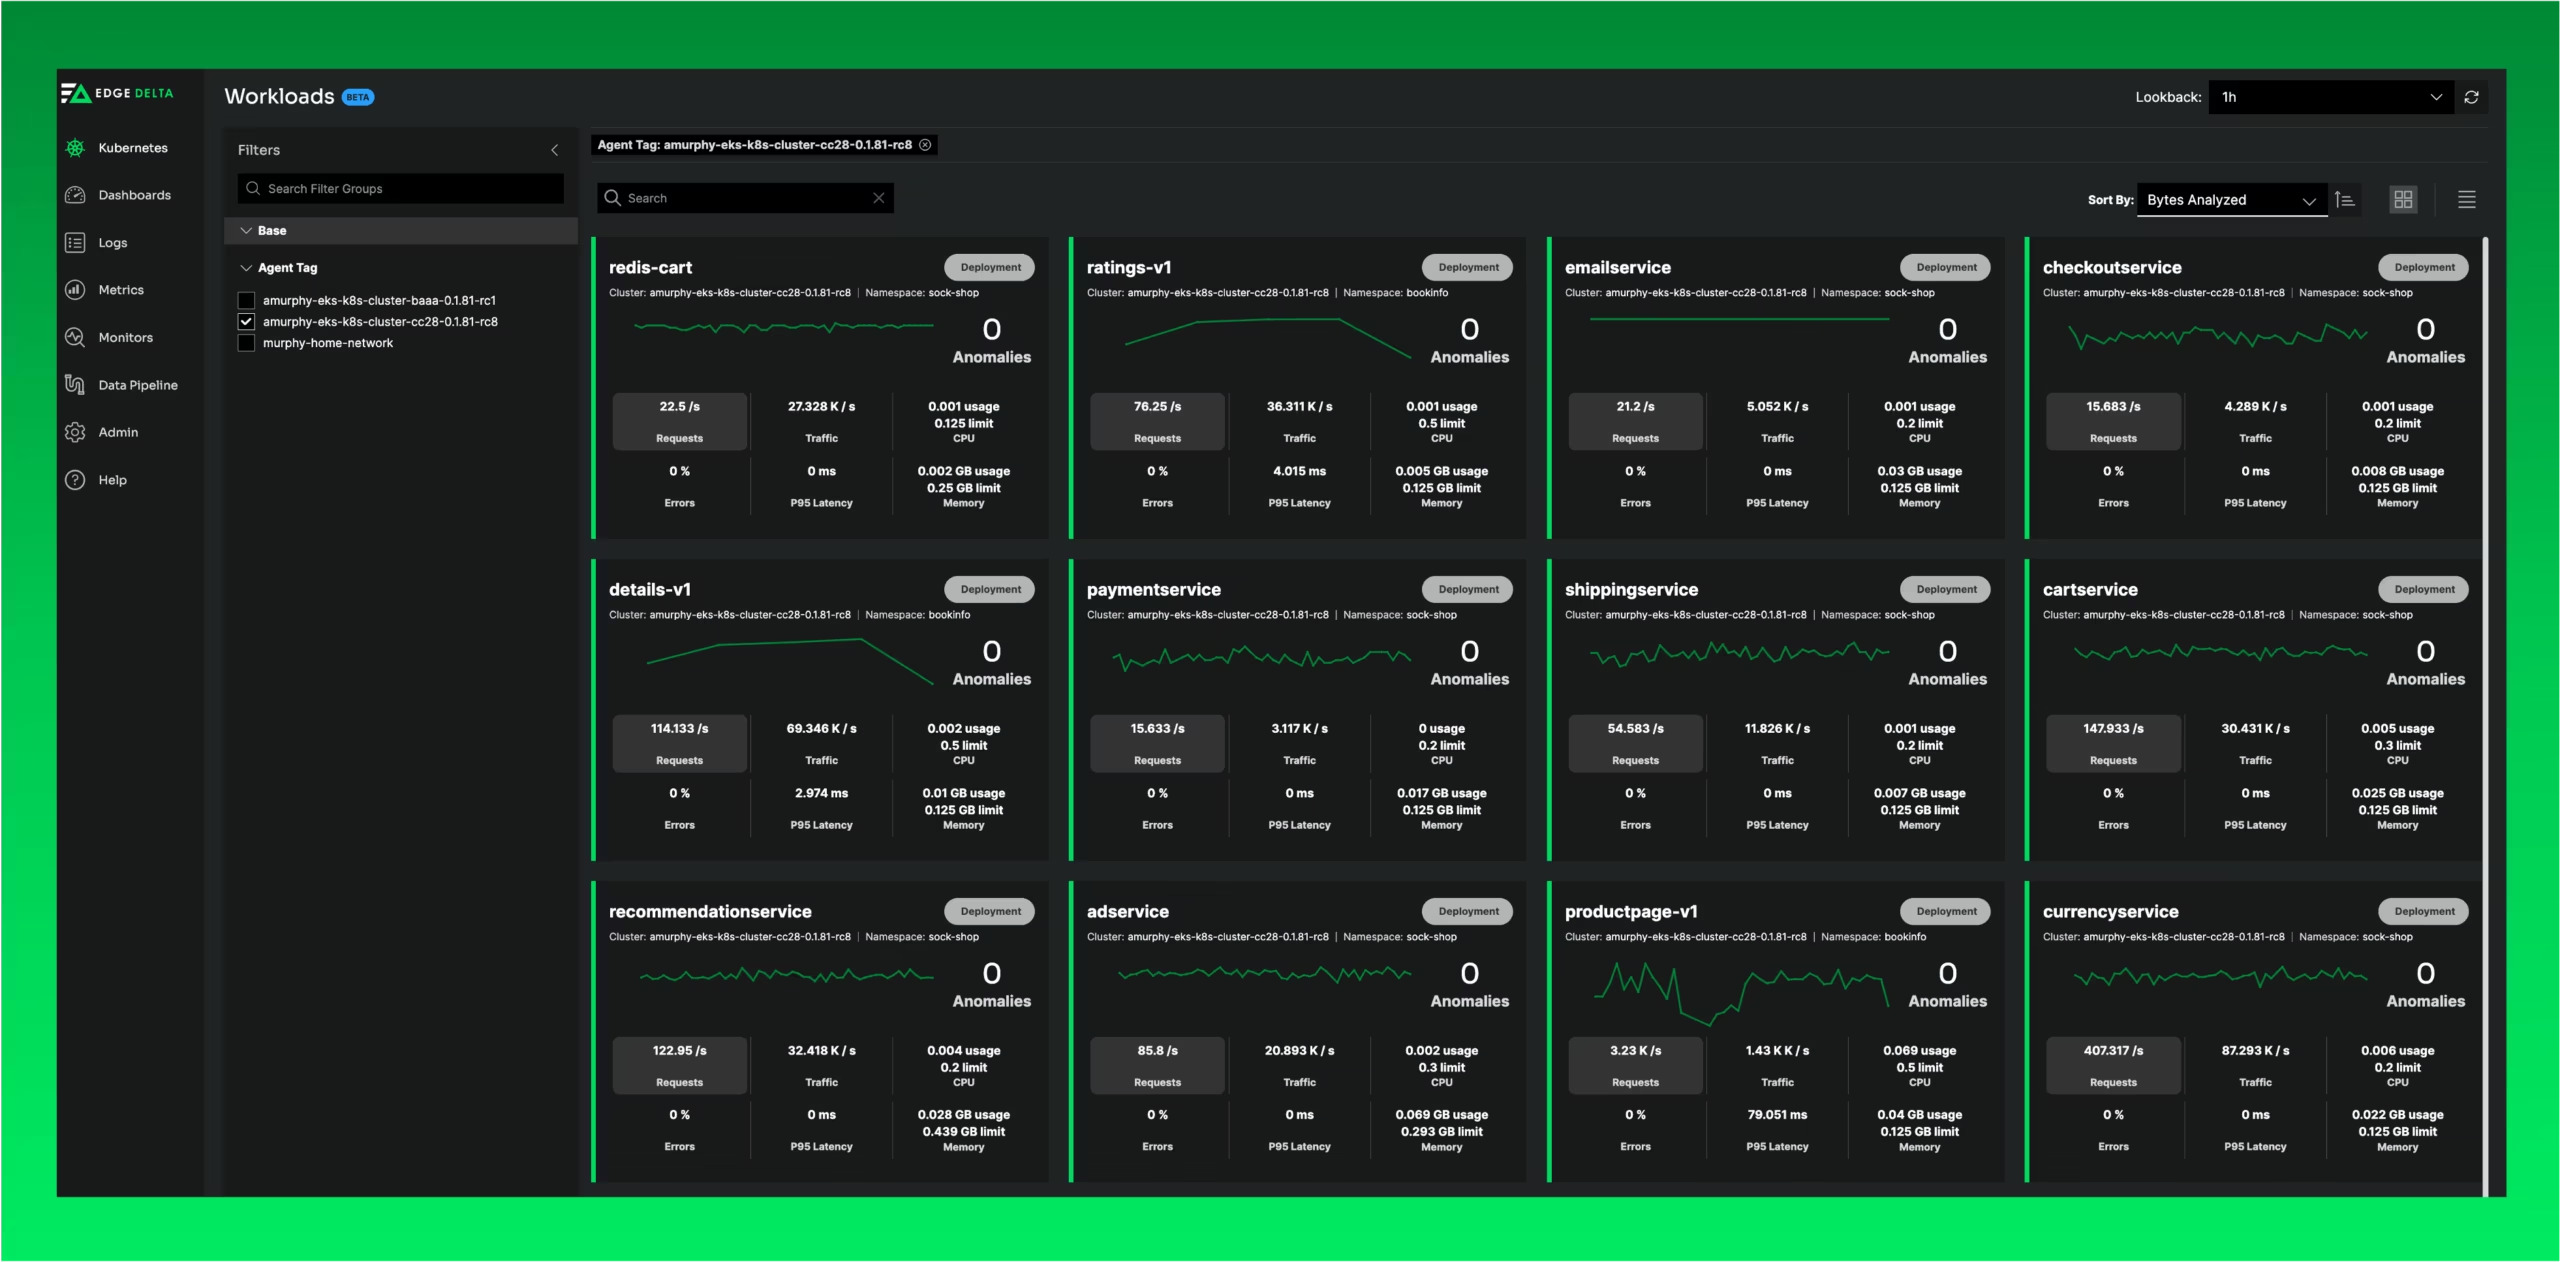
From our Workloads view, you’ll see how your golden signals trend across each service. You can easily switch the metric you’re comparing across workloads to identify unusual behavior.
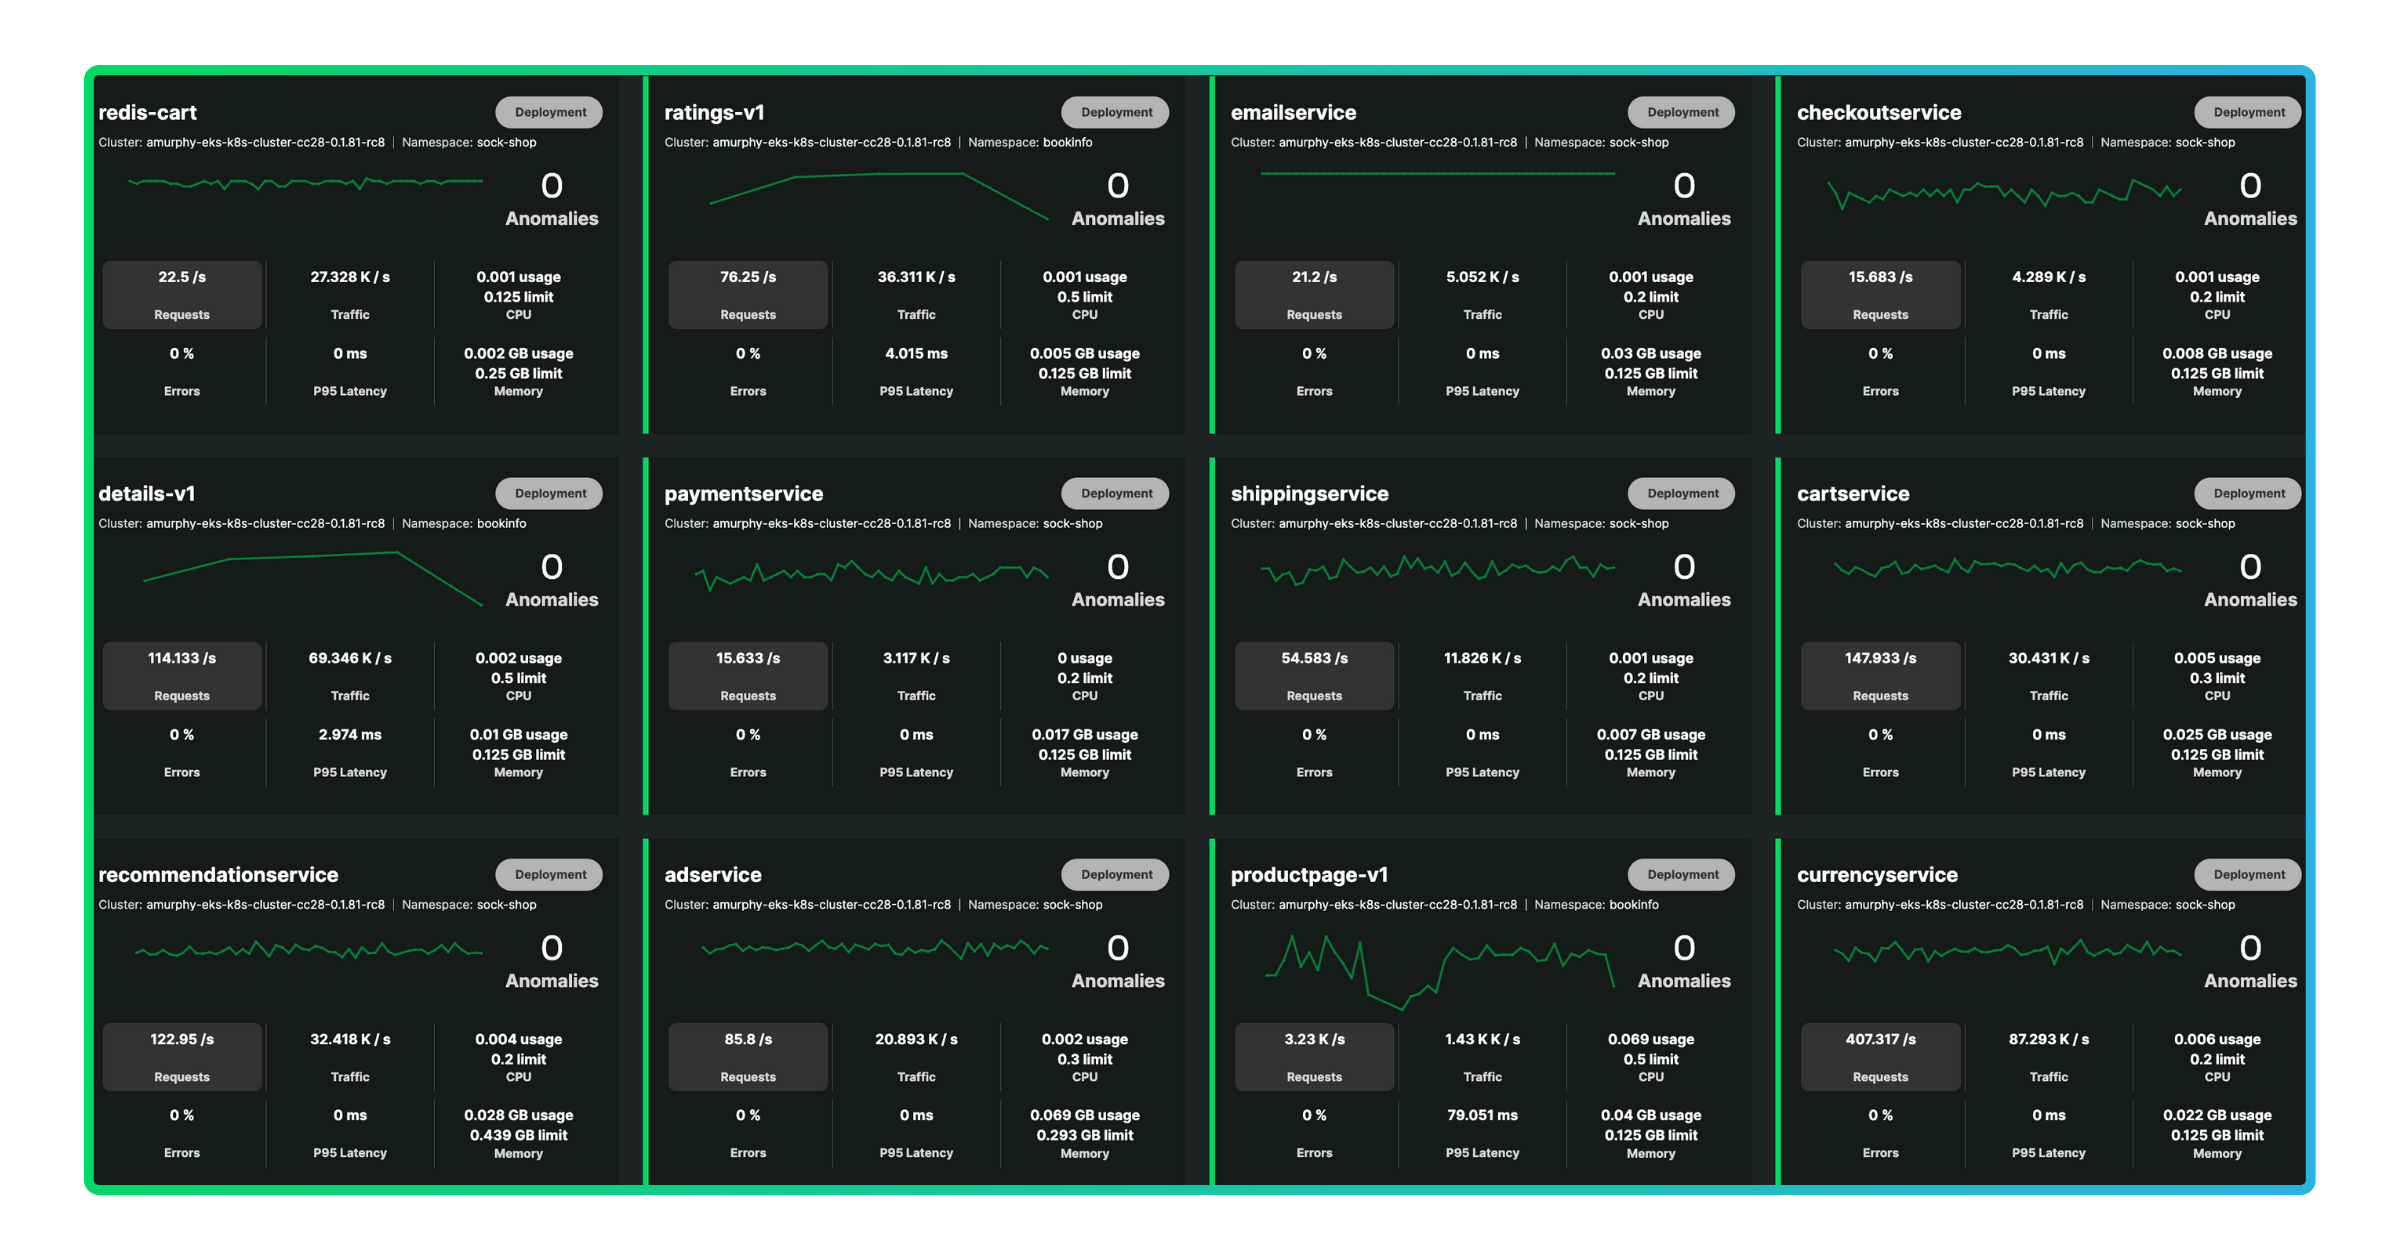
Start a free trial
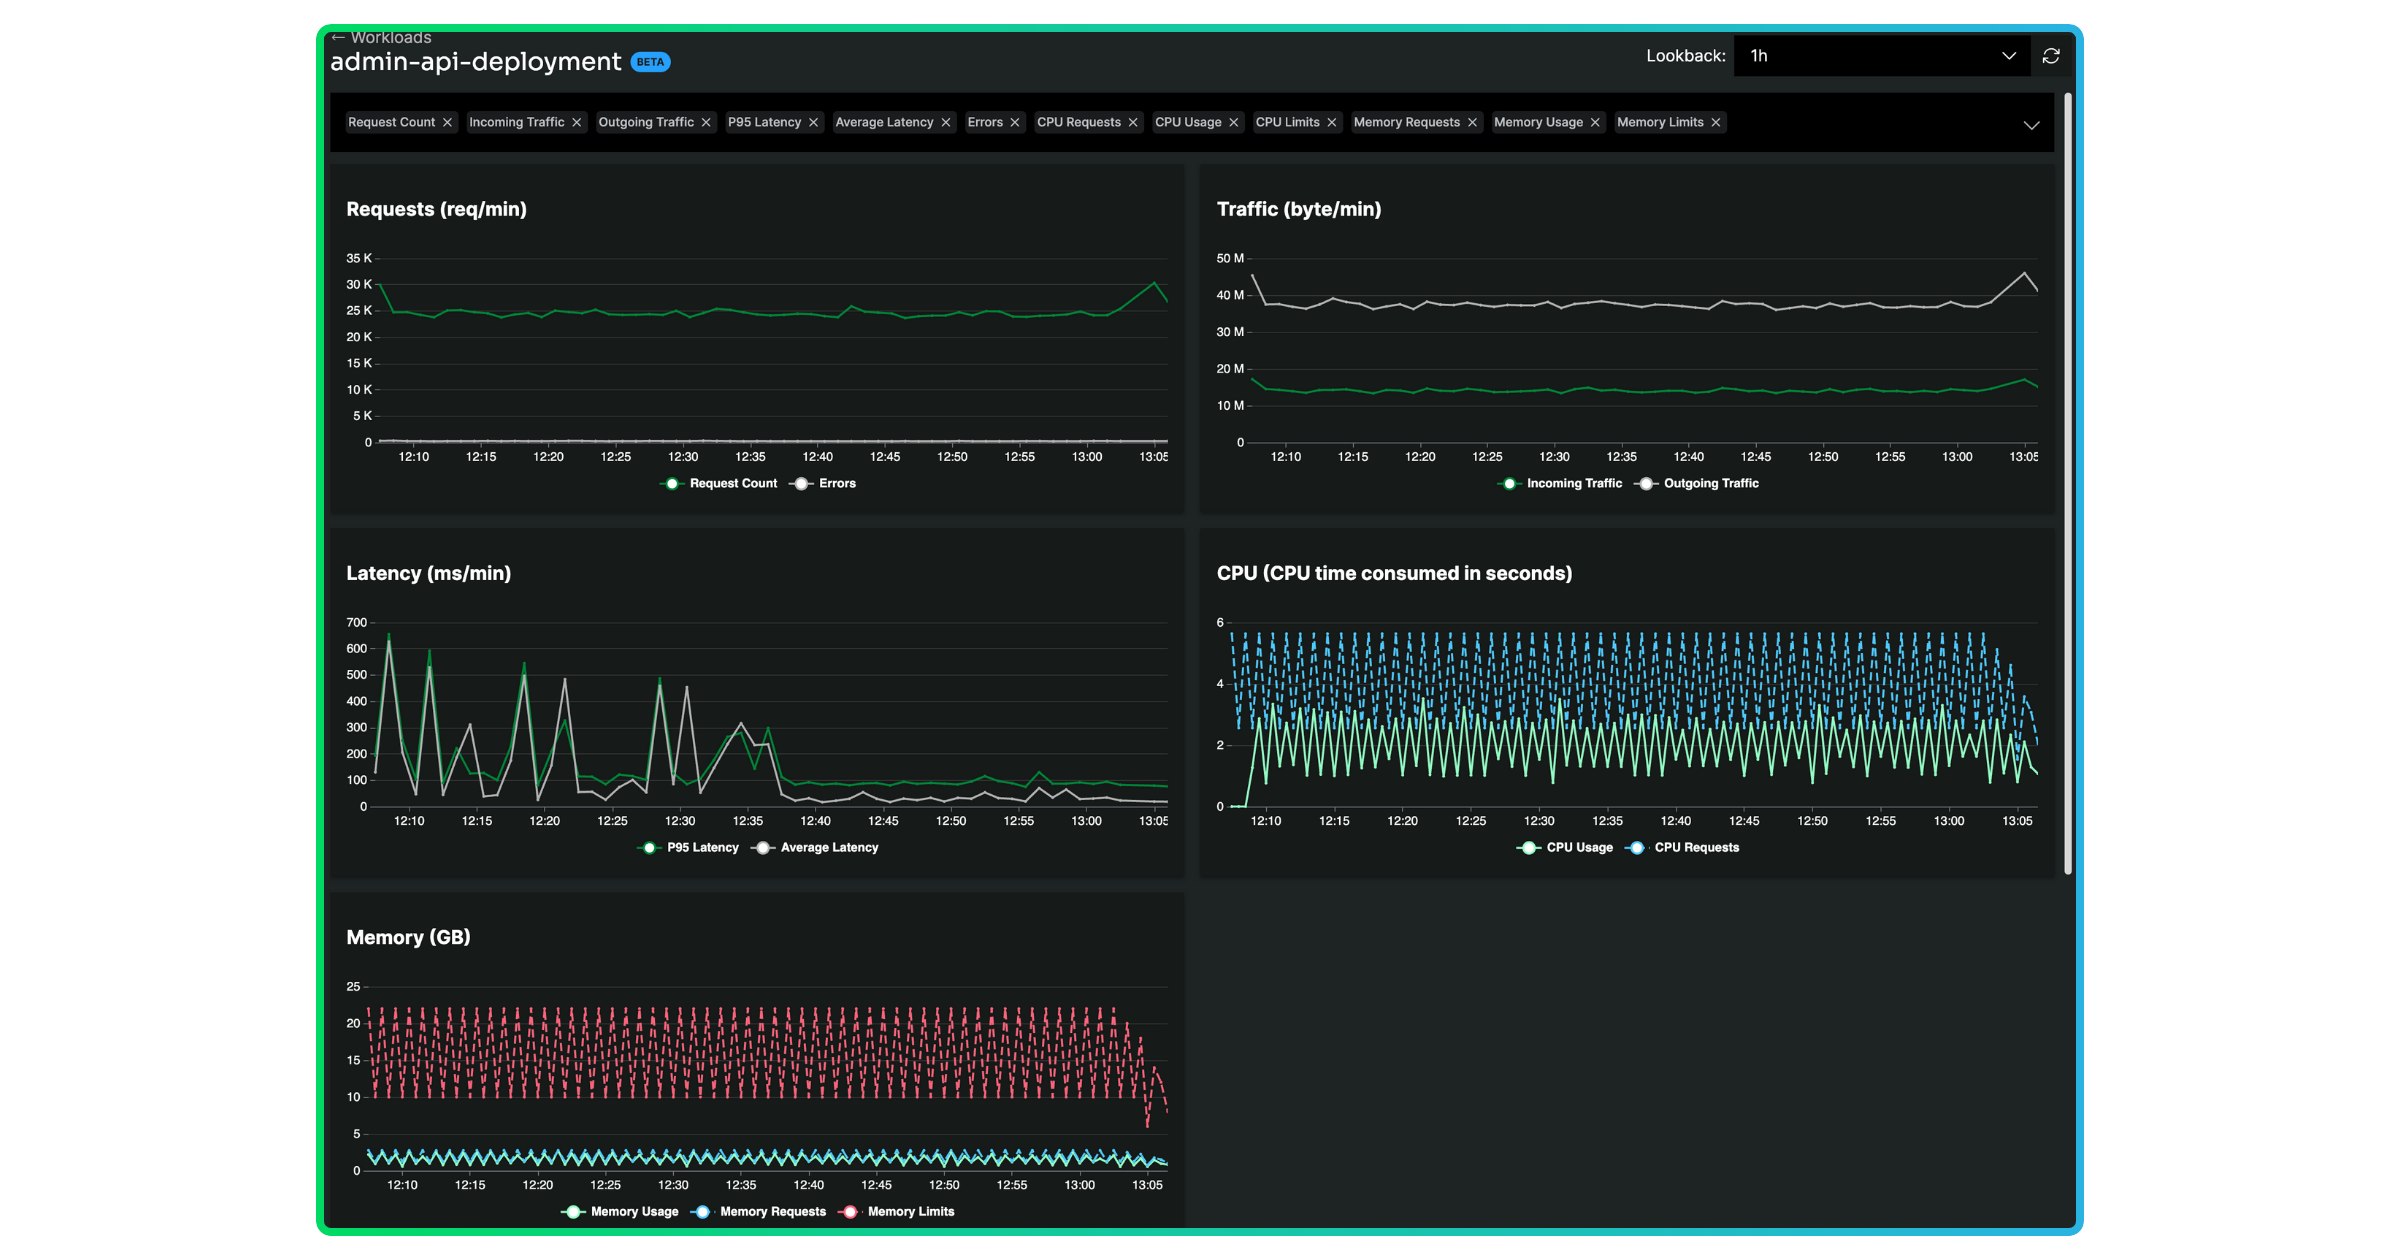
You can drill in further by clicking into the workload. From here, you can explore the golden signals and relevant log data – based on the look-back period and any additional query parameters – associated with the workload.
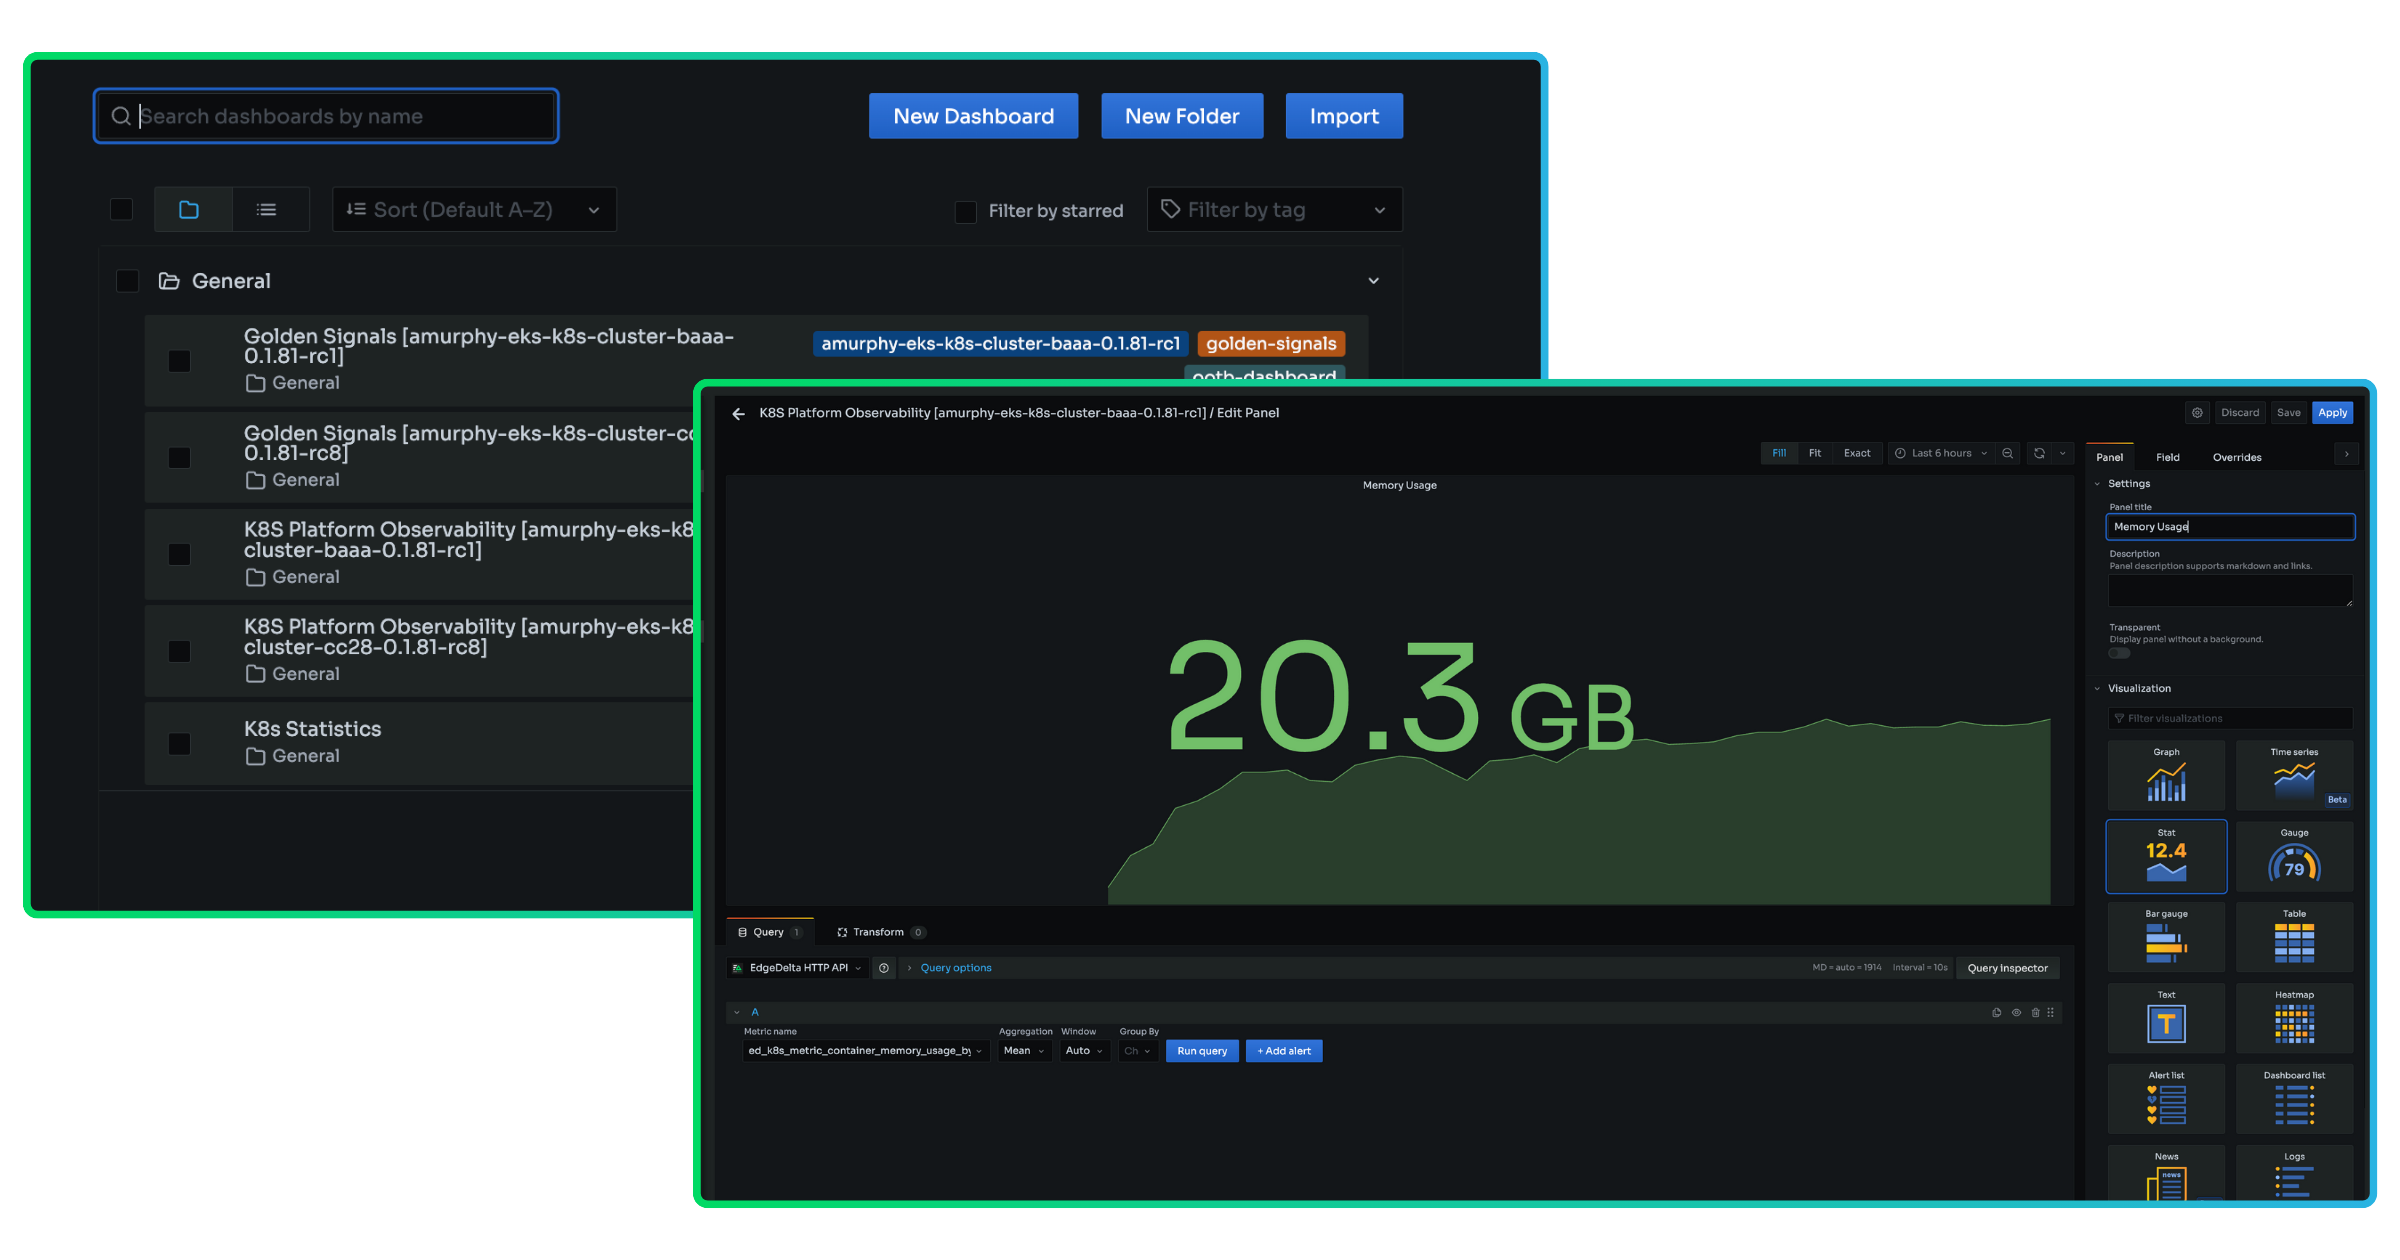
We provide additional out-of-the-box screens in our Dashboards view for all of the golden signals along with the kubelet, cAdvisor, and node-exporter libraries.
We recognize there are scenarios where you may have more specialized needs. With direct access to all of the metrics we ingest – golden signals, Kubernetes, Edge Delta infrastructure, and data volume metrics – we also give you the flexibility to build custom and unique views via embedded dashboards and create alerts for the metrics that matter to you.
Easily Navigate to the Right Logs for Faster Resolution
We’ve long provided contextualized views of your log data to help you quickly identify the root cause of issues. Our metrics release directly complements these capabilities to help you detect and proactively resolve any anomalous behavior.
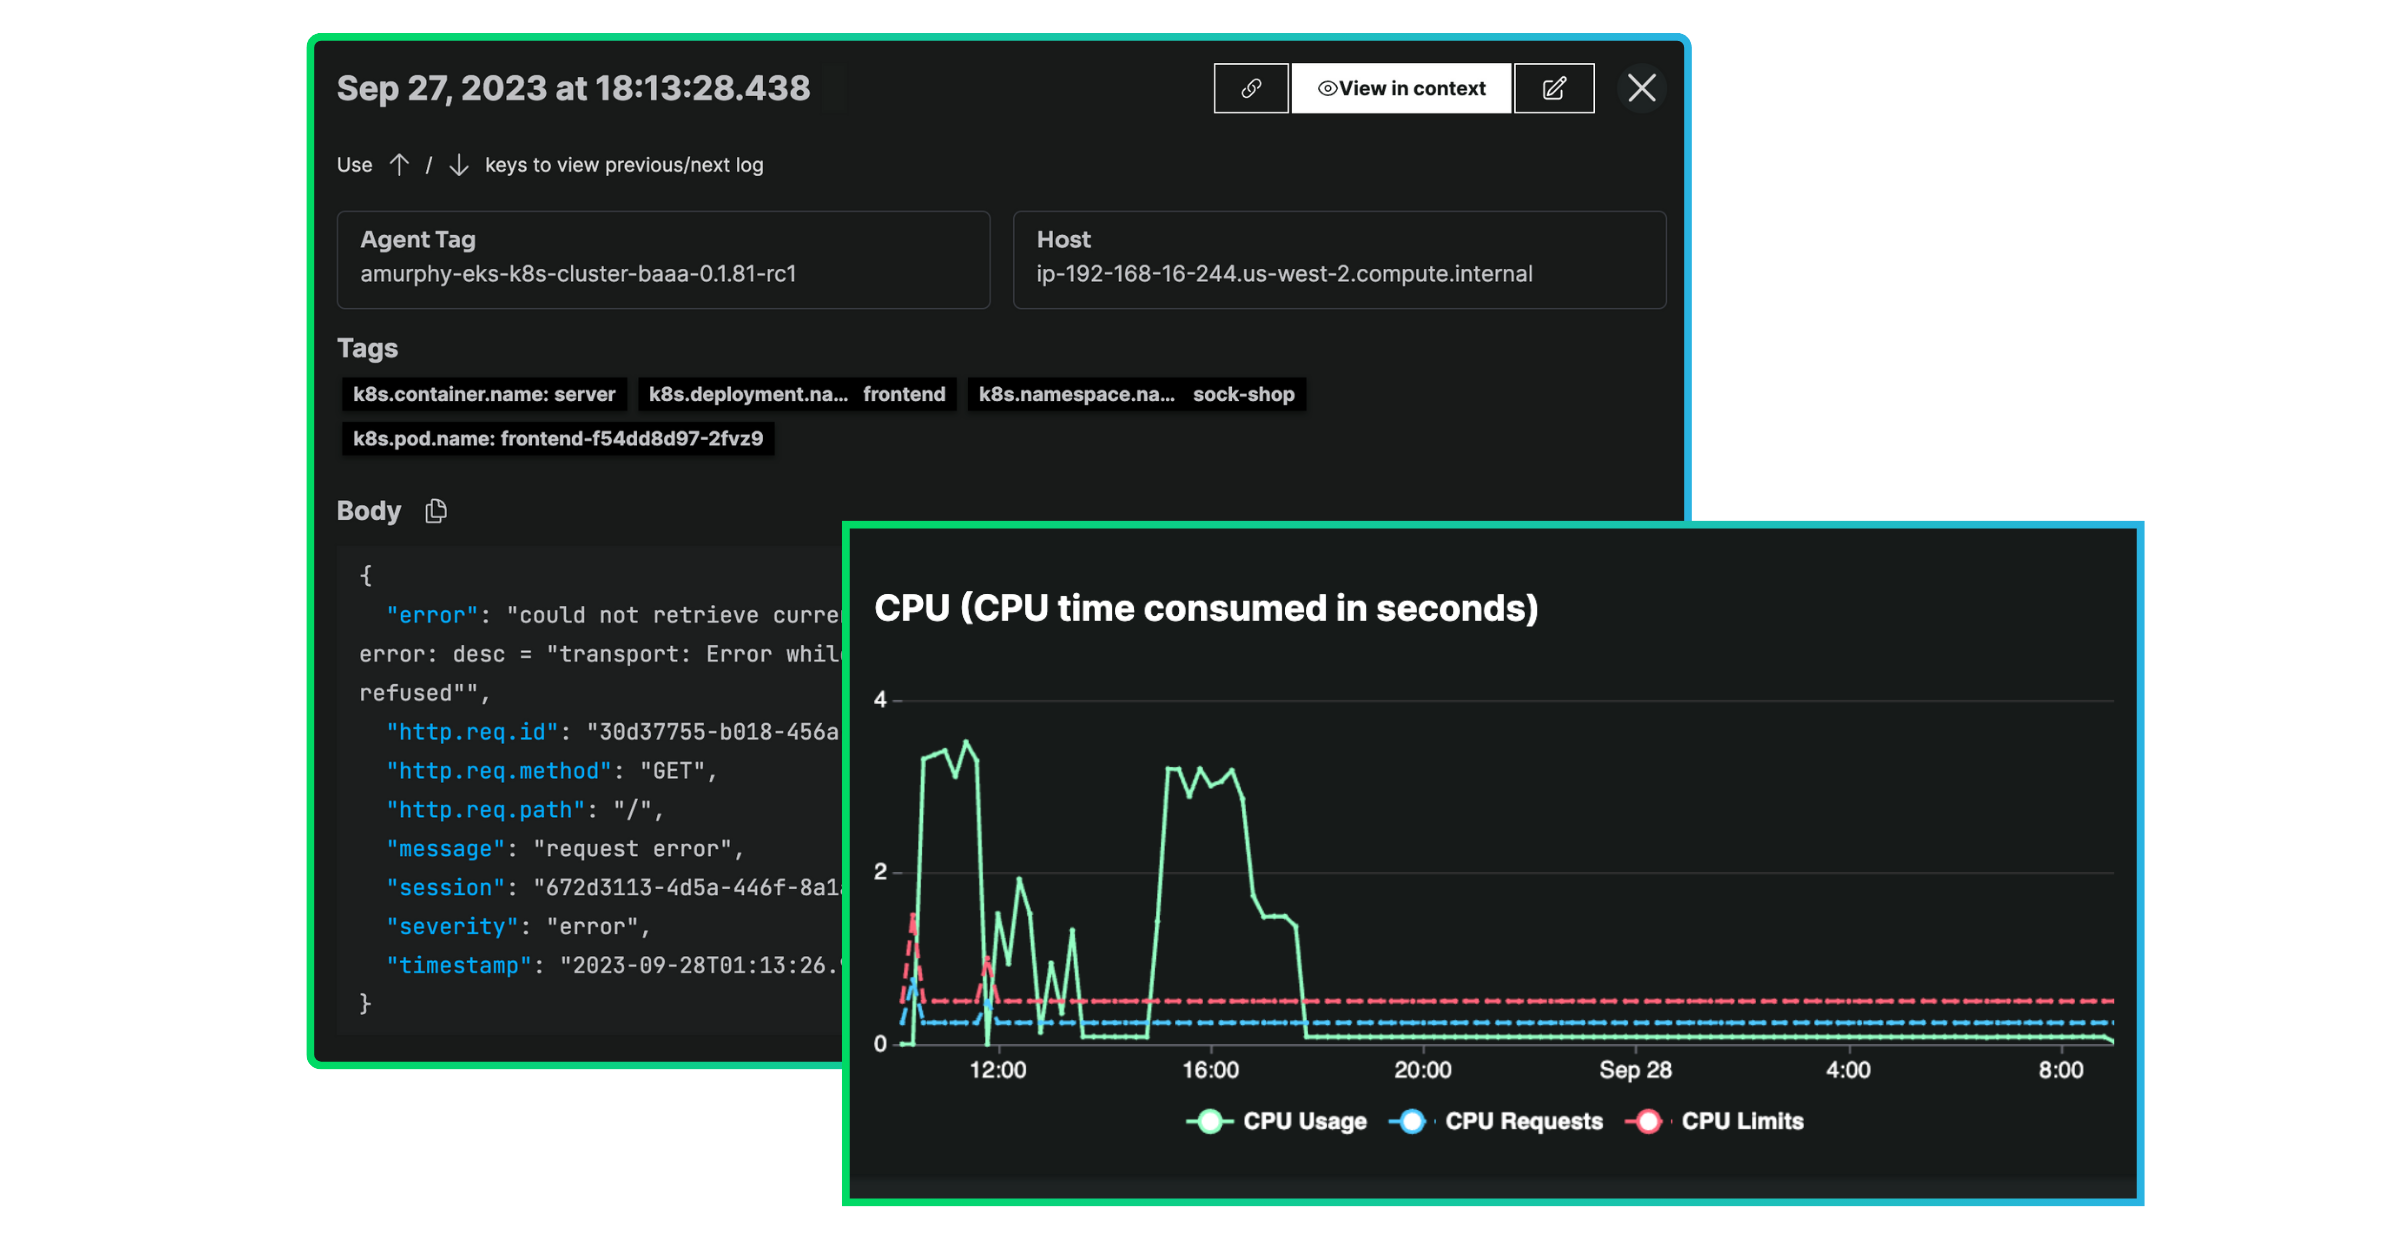
When a metric falls outside of its normal or expected range, we highlight and surface the affected service within the Workloads view. Here, we also display logs from that same service, so you can quickly isolate the data you need to troubleshoot – all without switching contexts (or toolsets altogether). This feature enables your team to focus on the right metrics when they matter most while also driving a more efficient post-detection resolution process.
Get Started with Metrics Today
To get started with metrics, start a free trial.


