Since our founding, Edge Delta has focused on solving the challenges of large-scale observability. Initially, we solved this challenge through Observability Pipelines. Our approach applies edge computing to observability to improve cost effectiveness and scalability.
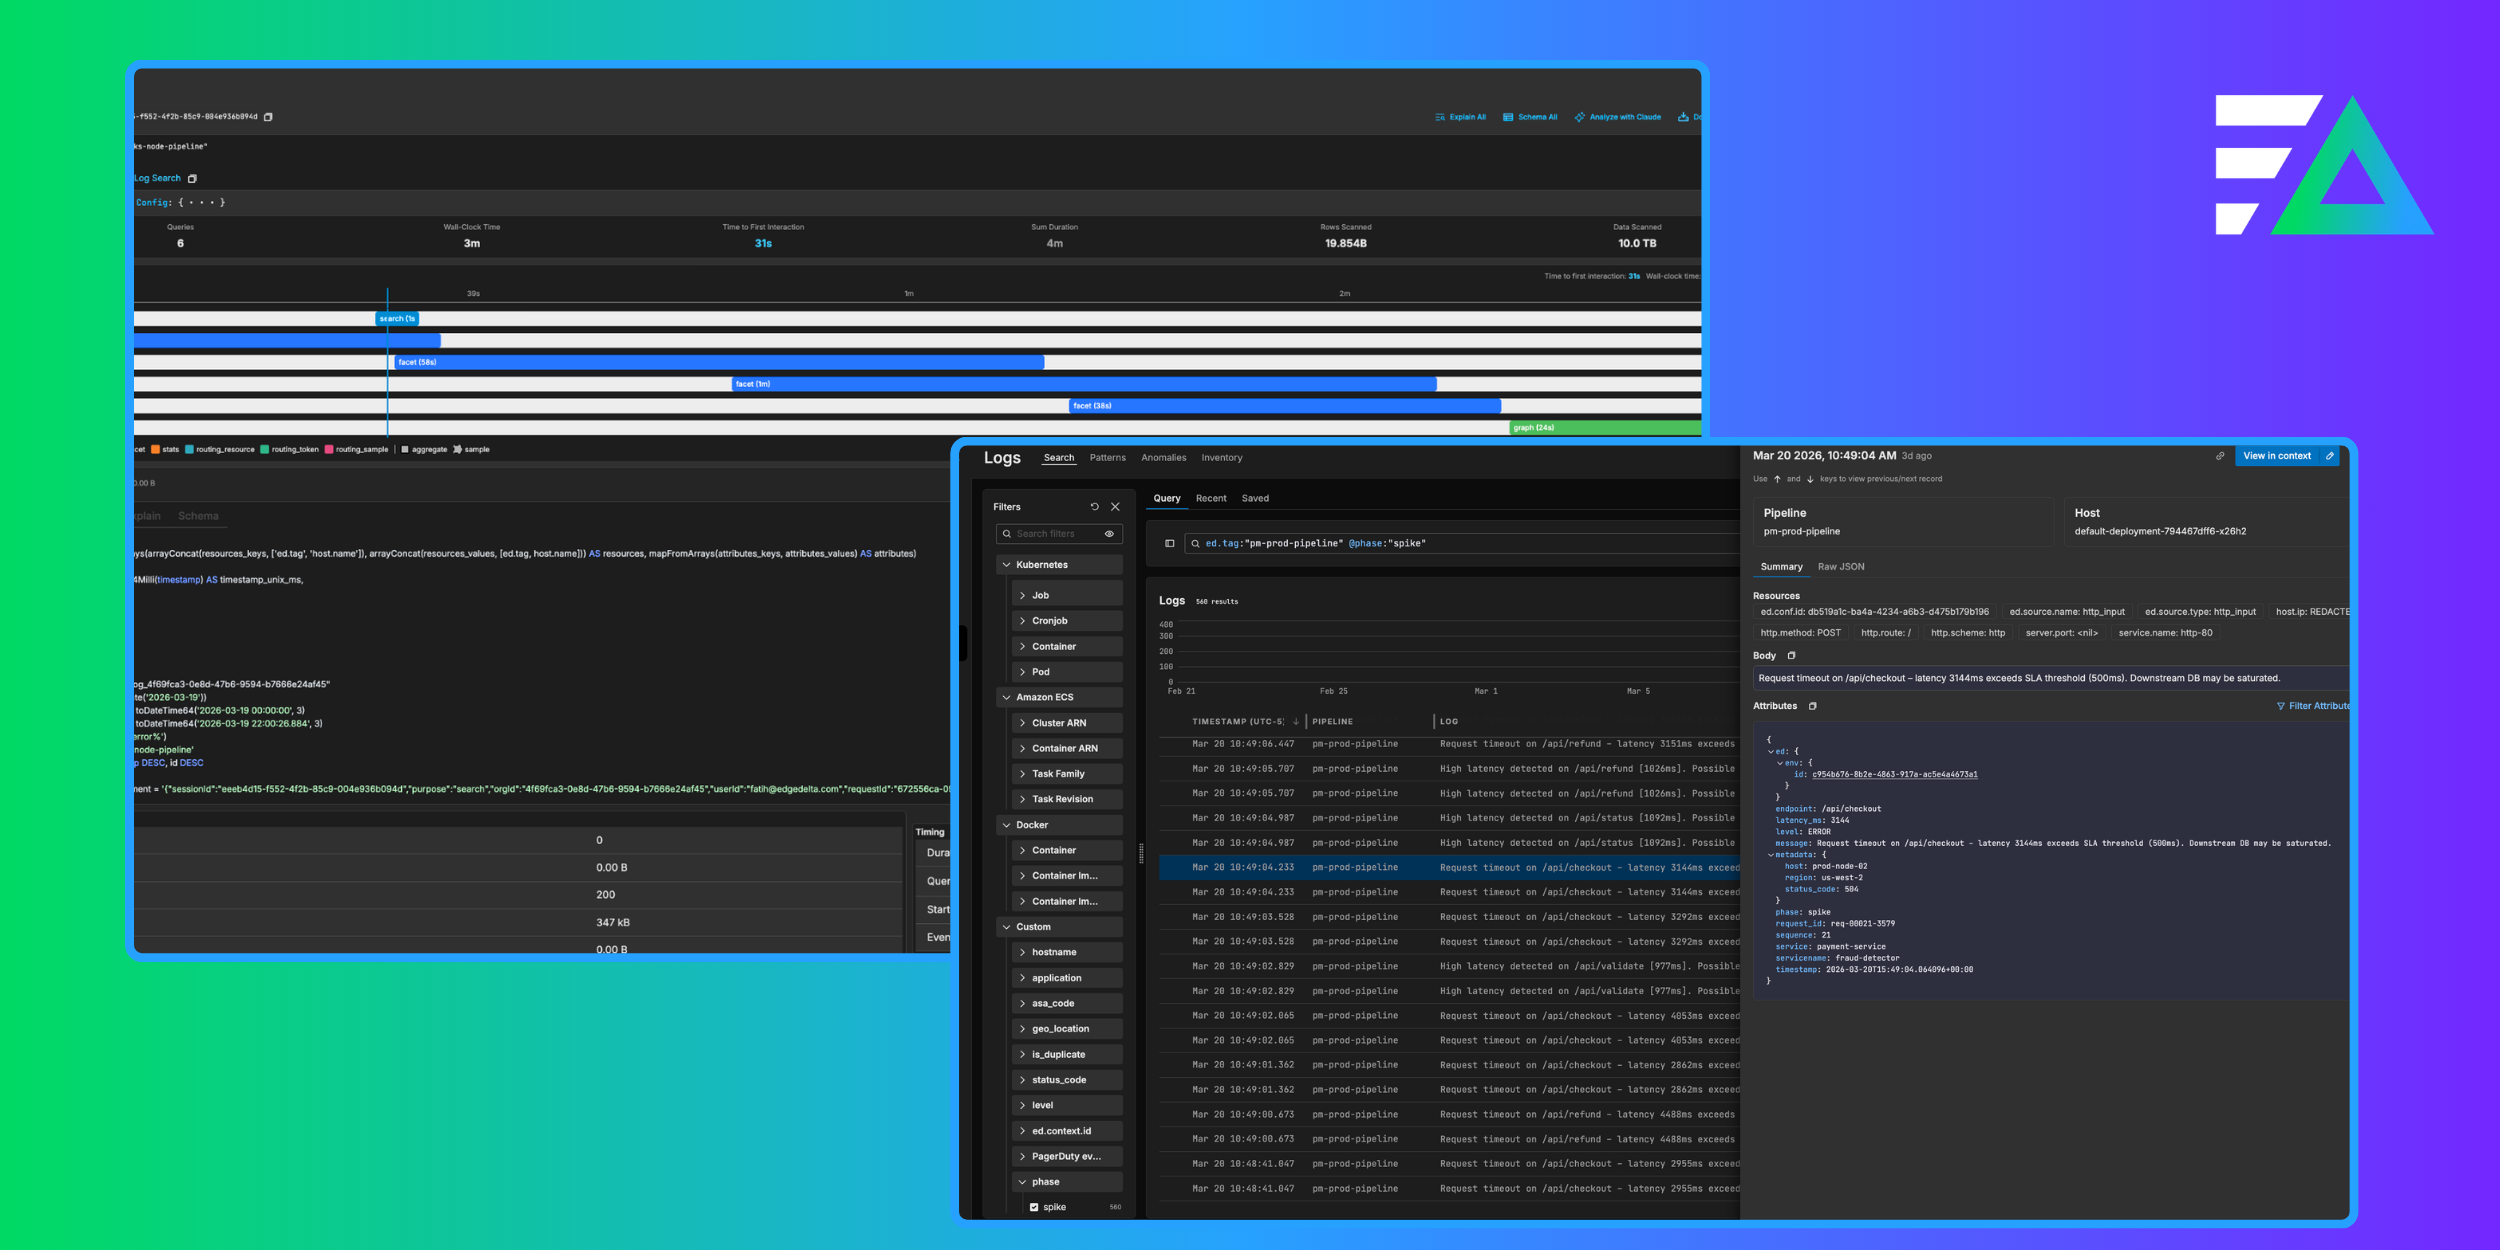
Recently, we’ve added several features to help you realize these benefits in other aspects of observability. As part of these efforts, we rolled out Log Search and Analytics (formerly known as Edge Delta Professional).
Edge Delta Log Search and Analytics provides a simpler and more scalable alternative to traditional log management tools – a critical problem to solve given the rate at which data is growing.
We also believe that observability shouldn’t require a heavy lift from engineers to set up and maintain the platform. Instead, we’ve designed our product to give time back to your engineers:
- It takes less than five minutes to get fully set up. When you deploy, Edge Delta aggregates all your logs and starts populating dashboards on its own.
- Automated anomaly detection helps you spot issues without having to predict them in advance.
- Opinionated views of your log data help you remove noise and save time during troubleshooting.
Recently, we’ve made several improvements, and in this blog, I’ll detail those updates on a feature-by-feature basis.
What’s New in Log Search and Analytics?
After gathering feedback from our customers, there were several areas we wanted to improve. Largely, these features improve the user experience and overall ease of use of Log Search and Analytics. These upgrades are also the tip of the iceberg – we have more exciting stuff coming down the pipeline as we speak.
Saved Searches and Search History
Saved Searches allow you to preserve queries, so you can easily revisit them for future use. These are visible at both the user or organizational level. So, you can see what others are searching and share best practices across the team. Search History preserves troubleshooting context by automatically saving your recent queries. It automatically captures the time range of your search and other query parameters to make iterating on previous queries easier than ever.
View in Context
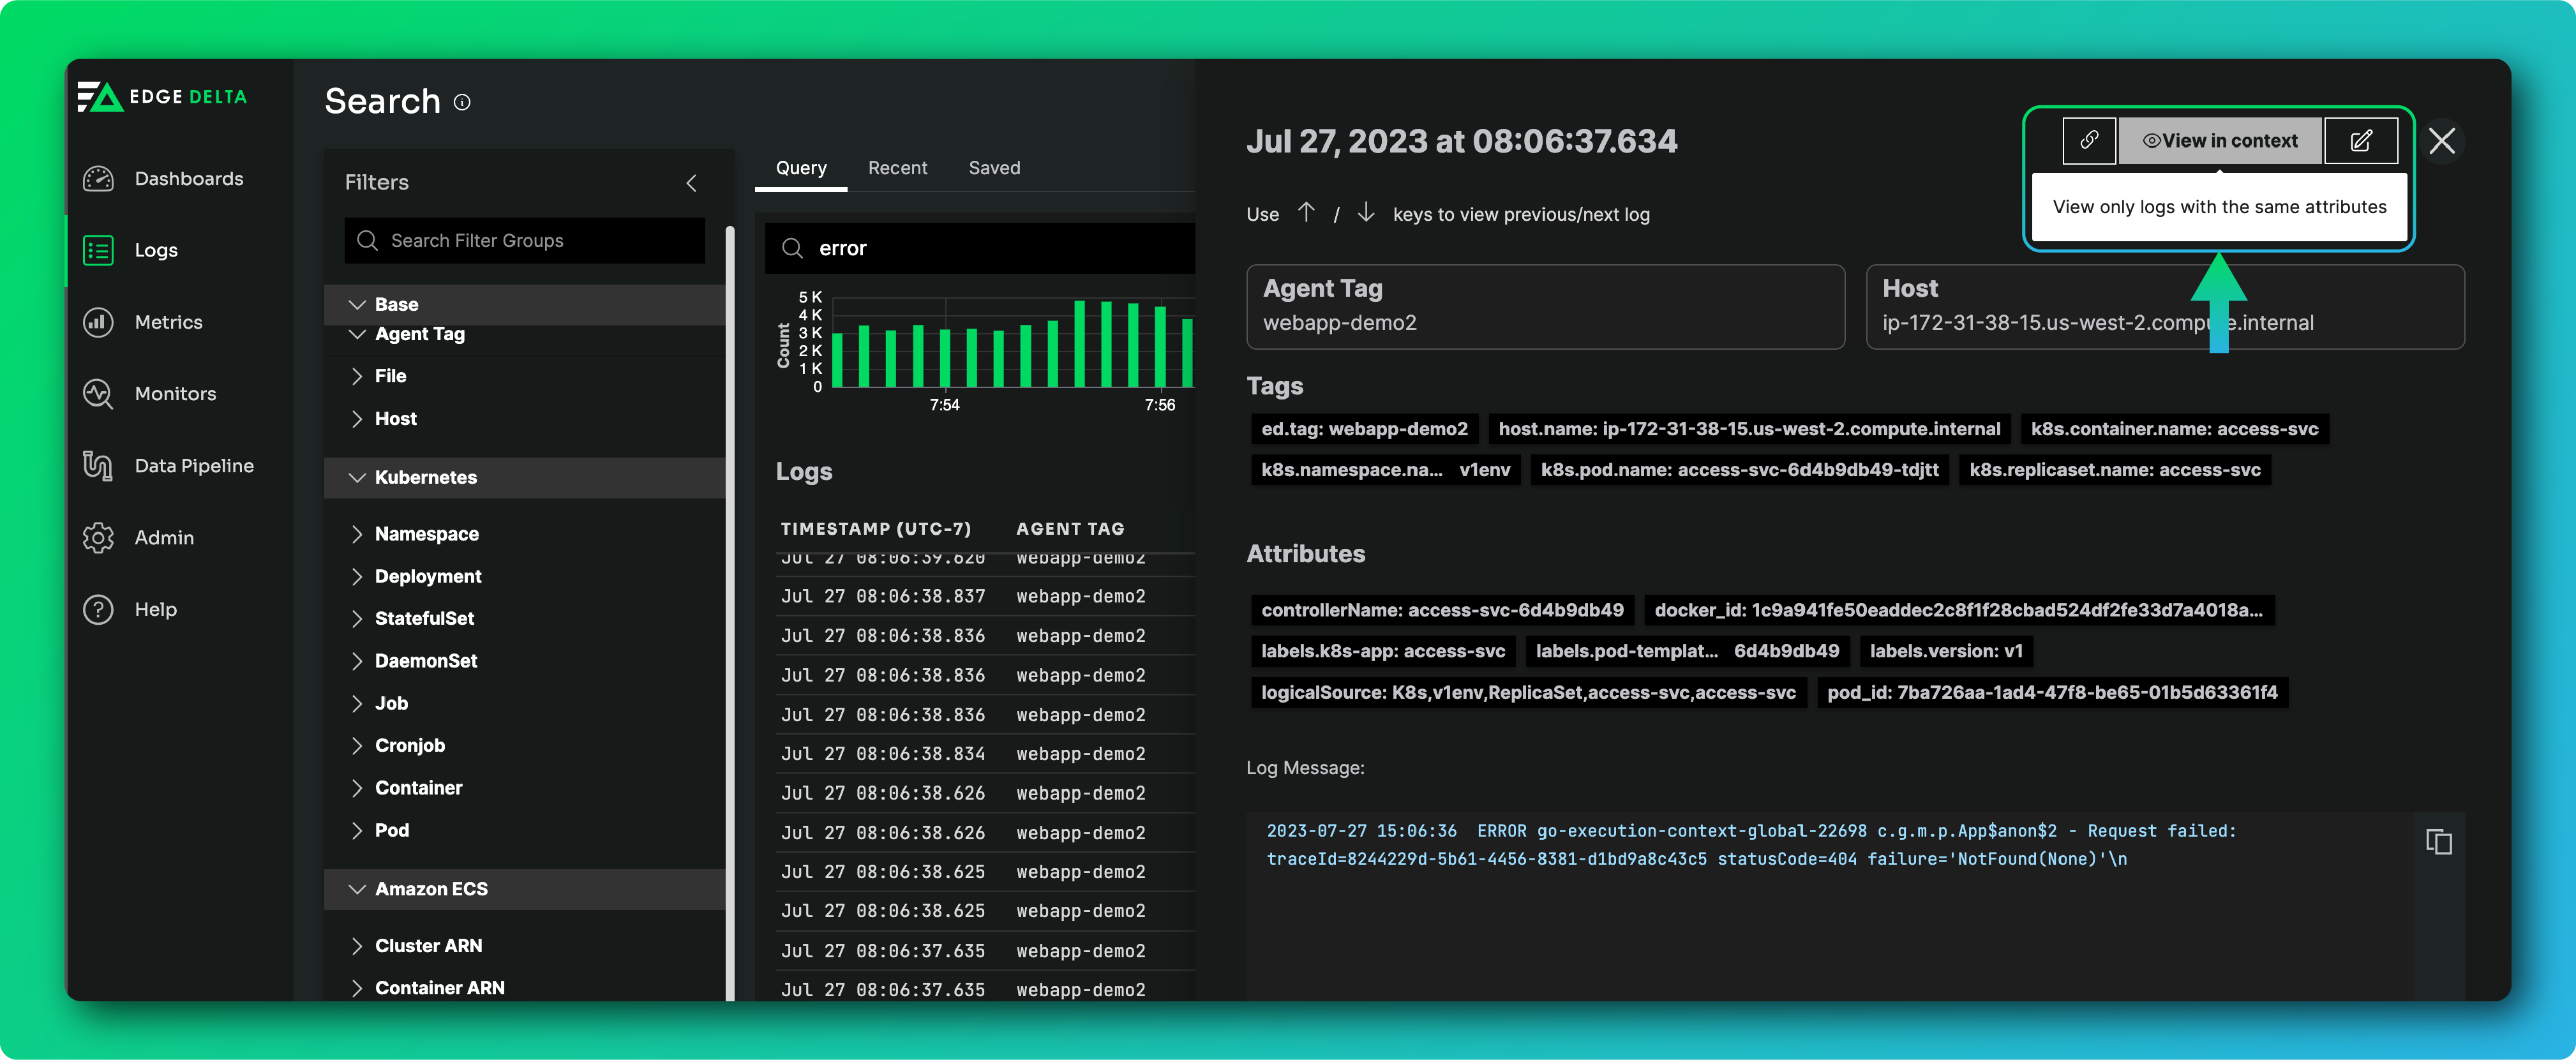
When troubleshooting an issue, you might need to pivot your search. For example, let’s say I run a search for a specific error message and Edge Delta returns all the matching Kubernetes logs. I might want to go one step further and view other logs from that pod in the same time frame – even if they don’t match my original search criteria. View in Context does exactly that, helping streamline your troubleshooting process.
Tag-Based Filters

Once you run a query, you might want to refine the search results by drilling into specific tags, such as a specific agent or Kubernetes resource. However, it can be annoying to manually update the query. So, we added Tag-Based Filters which help you narrow results with just a click.
Improved Facets UI
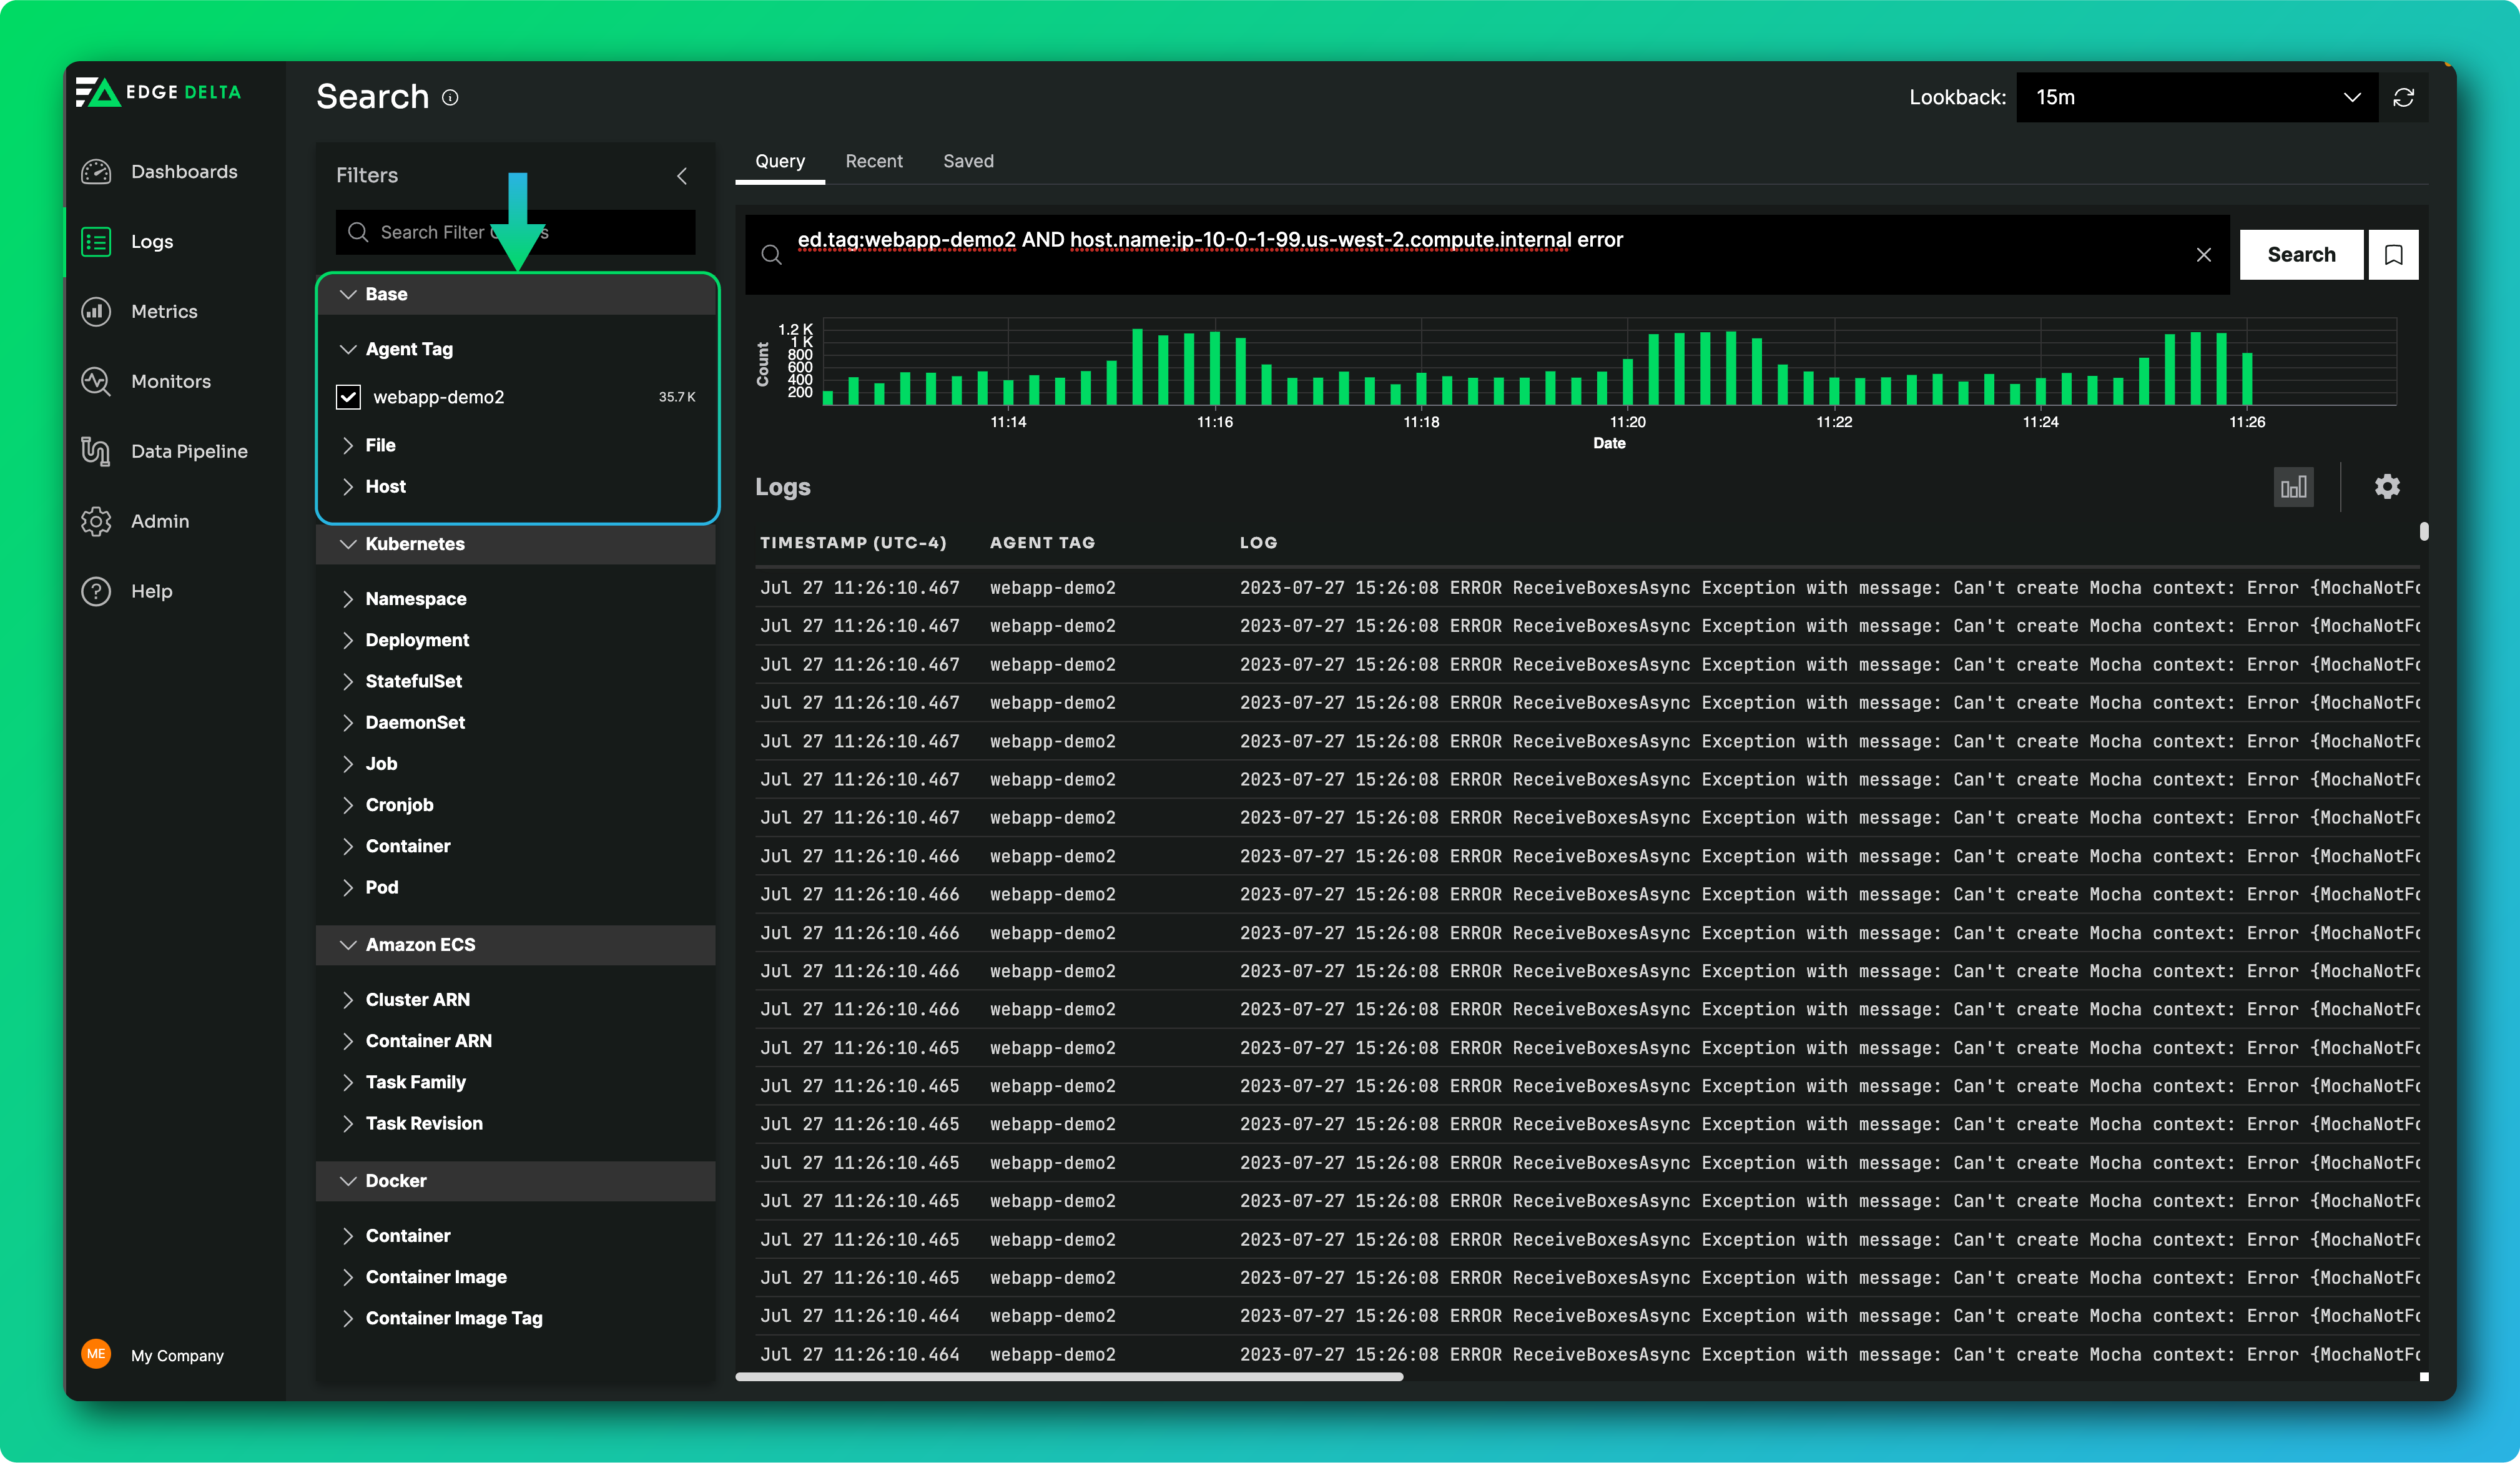
Similarly, we also overhauled the facets UI to provide a better filtering experience. Now, it’s more customizable (and prettier!). You can create custom facets by selecting them from the log detail panel. You can also hide facets or facet groups that aren’t relevant to you.
Customizable Row Density
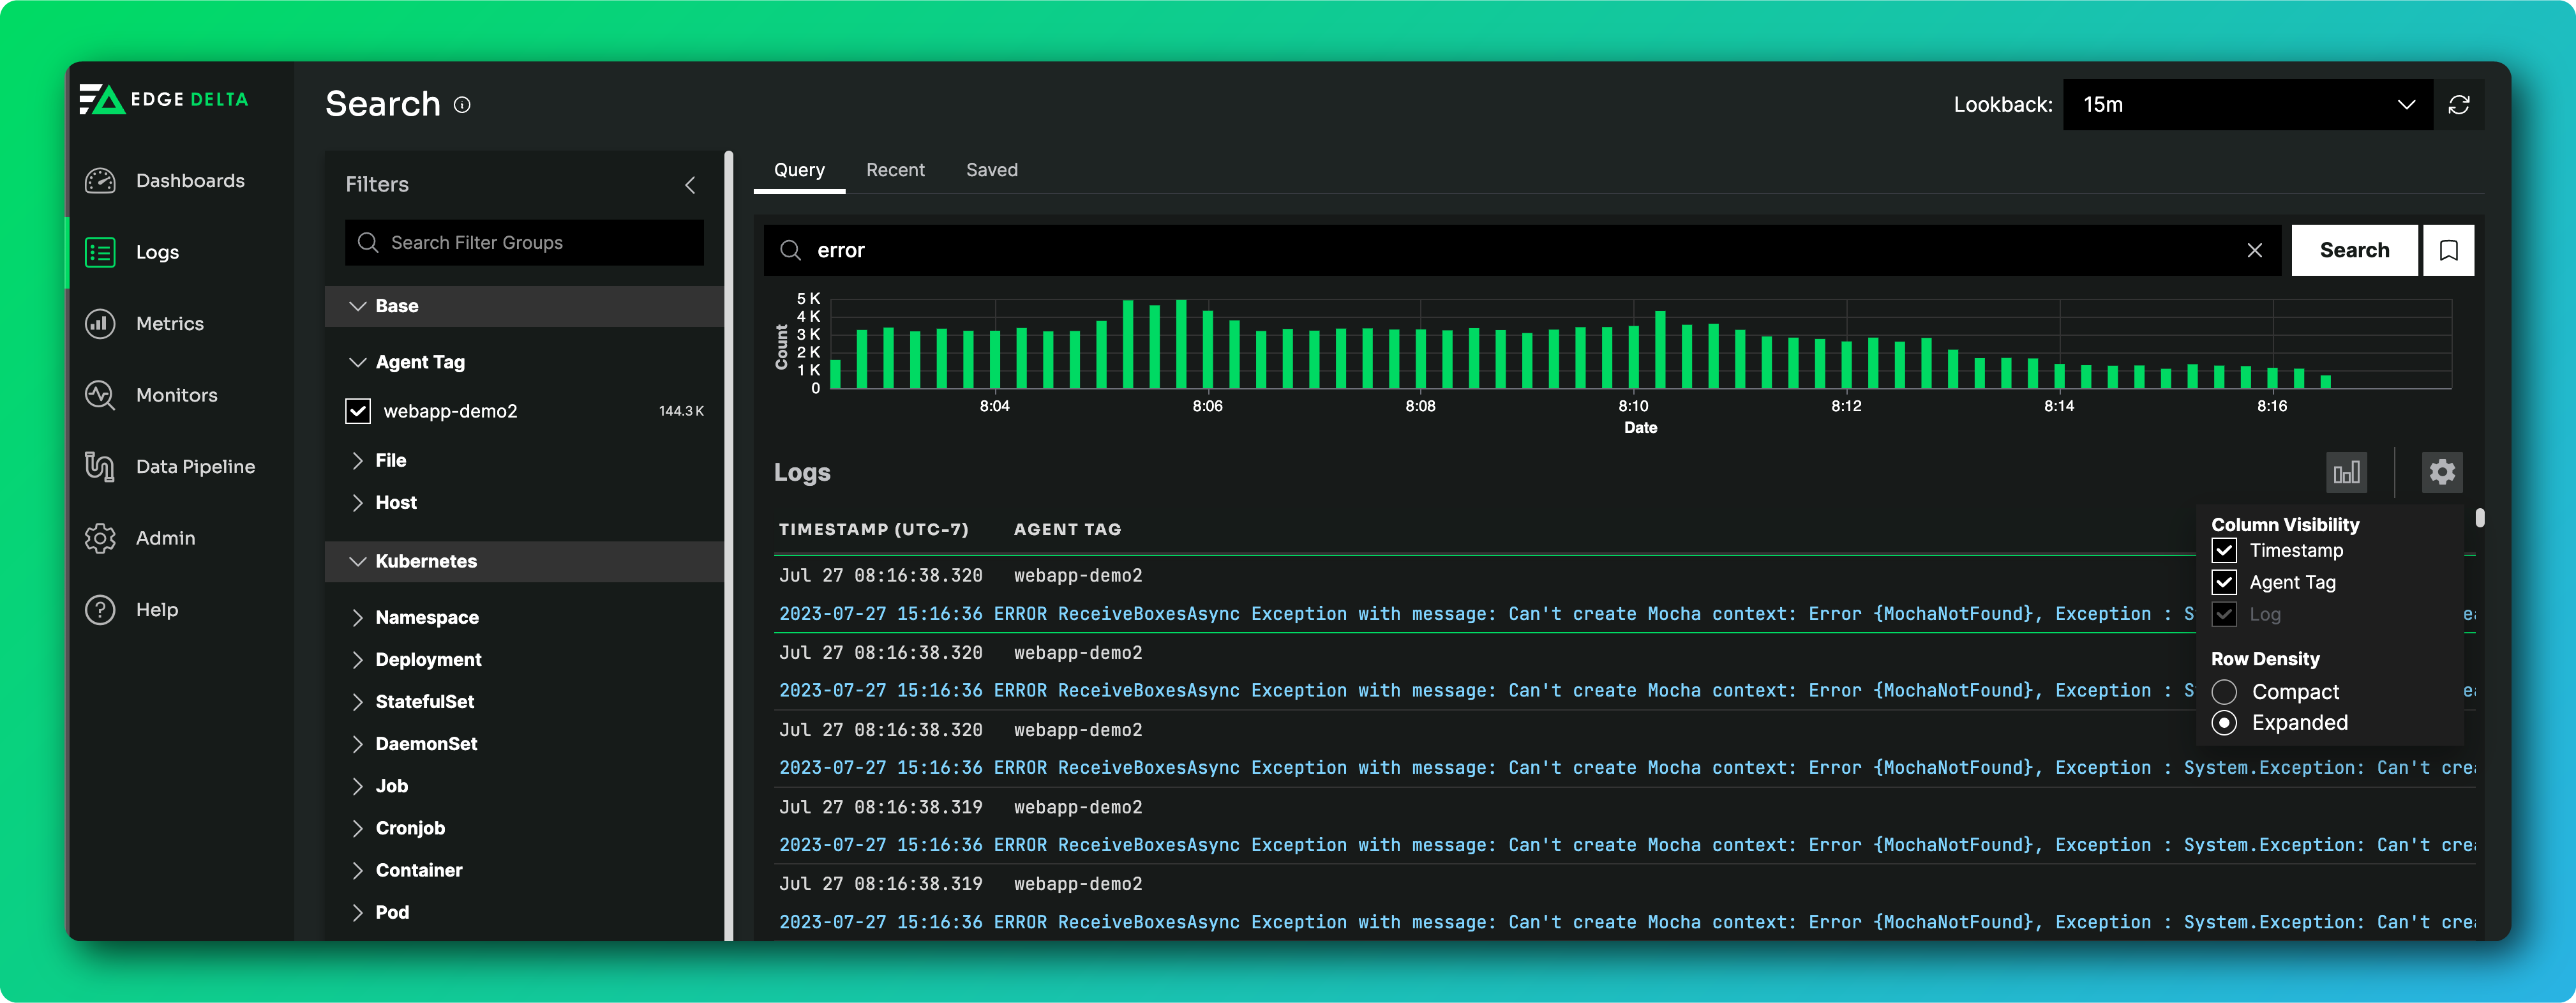
Customizable Row Density allows you to choose between compact and expanded views, making it easy to scan through shorter log lines at-a-glance or drill into detailed stack traces—all without losing surrounding context.
In addition to the upgrades above, we also added keyboard shortcuts and improved the log table interface.
Log Search and Analytics is a big part of our mission to simplify observability and drive transparency and predictability. In the coming weeks and months, we’ll continue listening to our customers for other areas to improve and innovate. Stay tuned!


