

In today’s increasingly complex, distributed, and cloud-native environments, observability is essential for maintaining system reliability, performance, and security. Unlike traditional monitoring, which focuses on predefined failures or thresholds, observability enables teams to ask new questions about system behavior, diagnose unknown issues, and perform real-time debugging and root cause analysis. By providing deep, correlated insights across infrastructure and applications, observability empowers developers, SREs, and operators to proactively detect anomalies, reduce downtime, and continuously improve user experience.
Observability spans a wide range of telemetry data types and tools, and it can be challenging to know what to focus on. In this post, we’ll break down the three core pillars of observability — metrics, logs, and traces — and map them to practical use cases. We’ll also discuss how Edge Delta’s Telemetry Pipelines not only ingest this data, but also transform, enrich, and correlate it into high-value, actionable signals that can be forwarded to any downstream destination.
Whether you’re building from scratch or refining your current approach, this guide is designed to help you get the most out of your observability and security data at scale.
Metrics
Metrics are used for monitoring system or application behavior by tracking quantitative measurements over time. They help answer questions such as “how much,” “how often,” or “how long” and are used in dashboards, alerts, anomaly detection, trend analysis, and performance baselines.
General Use Case Examples for Metrics
| Category | Use Case | Metric Examples |
|---|---|---|
| System Performance | Monitor infrastructure health and performance | CPU usage, memory consumption, disk I/O, network throughput |
| Application Health | Detect app slowdowns, errors, or bottlenecks | Request latency (p50/p95/p99), error rate, throughput, DB query time |
| Capacity Planning | Forecast resource needs and avoid scaling issues | Disk usage trends, memory pressure, concurrent users, and container limits |
| Incident Detection | Alert on performance degradation or failures | 5xx error rate spikes, latency thresholds, service unavailability |
| Security Monitoring | Detect anomalies and suspicious activity | Login attempts per user, failed auth rate, unusual network ports accessed |
| Business Analytics | Track business KPIs and user behavior | Daily active users (DAU), conversion rate, cart abandonment, revenue per region |
| SLA/SLO Tracking | Monitor and enforce service-level agreements | % requests < 500ms, uptime percentage, error budget burn rate |
| Feature Rollout | Measure the impact of new features or releases | Feature adoption rate, session duration, crash frequency post-release |
| User Experience (UX) | Optimize UX by monitoring real user metrics | Page load time, API latency, time to first byte (TTFB), frontend errors |
| Developer Productivity | Monitor CI/CD health and engineering efficiency | Build times, deployment frequency, and test failure rates |
| Cost Optimization | Identify underused resources and optimize cloud spend | Idle VM time, low-traffic services, high egress bandwidth costs |
| Custom Domain Metrics | Track domain-specific KPIs relevant to your product or service | Number of trades (for fintech), dropped frames (for streaming), battery usage (IoT) |
Real-Time Metric Enrichment with Edge Delta
Metric data often lacks the contextual signals needed to correlate it with a specific service, component, or workflow — context that’s essential for effective issue detection and resolution. With Edge Delta’s Telemetry Pipelines, teams can enrich metrics with custom tags before they’re indexed, enabling more cohesive and actionable insights within their observability platforms.
For example, imagine we’re collecting Prometheus metrics and routing them into Edge Delta:
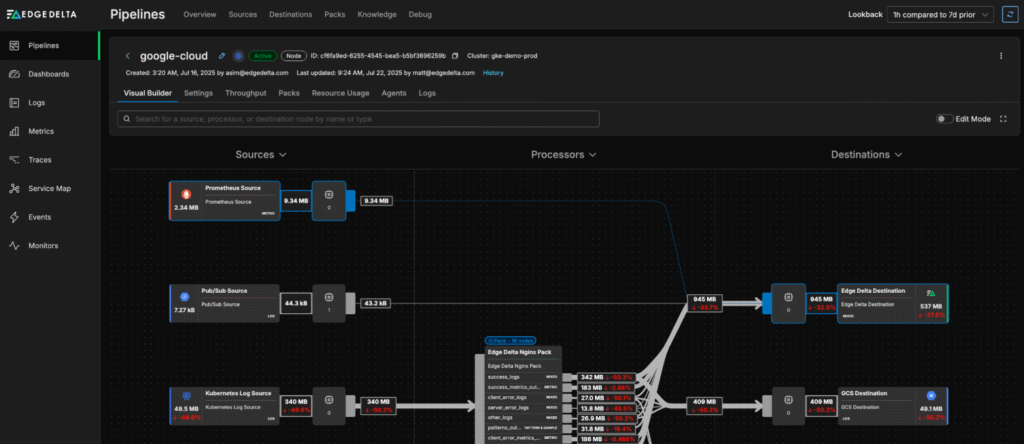
In this scenario, we need to tag the metrics with the correct team in order to clarify who’s responsible for monitoring them downstream. Using Edge Delta Live Capture, we can swiftly build OTTL enrichment logic to assign these metrics to the observability platform team:
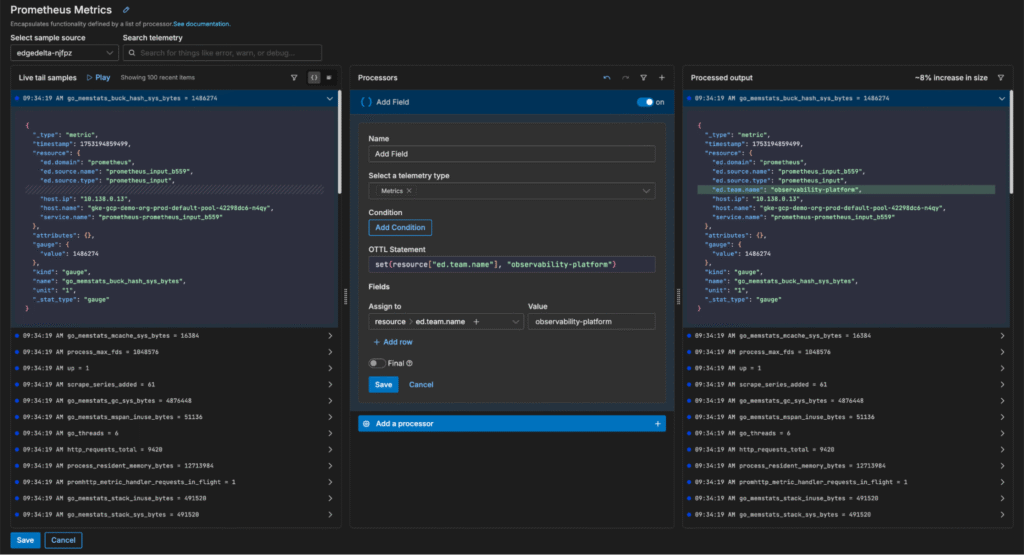
By tagging these Prometheus metrics in real time, we ensure they’re delivered downstream in a clean, standardized, and context-rich format for the right team.
Logs
Logs are unstructured or semi-structured records of discrete events. They help you understand what happened in a system — often after the fact — in response to unexpected or undefined behaviors like application crashes, failures, or potential security incidents. In these cases, you might not yet know which metrics to track, but you expect the relevant details are being logged by the application, system, or infrastructure components.
Logs are especially useful for providing narrative context during investigations of complex, time-sensitive, or multi-step issues. They’re often enriched with metadata such as timestamps, log level (e.g., INFO, WARN, ERROR), user IDs, and session IDs — all of which help you reconstruct the sequence of events, understand severity, correlate related events across systems, and trace issues back to specific users or sessions.
General Use Case Examples for Logs
| Category | Use Case | Log Examples |
|---|---|---|
| Debugging | Understand application failures, crashes, or unexpected behavior | Stack traces, exception messages, and debug output |
| Incident Response | Investigate production incidents and outages | Error logs, HTTP 500s, timeouts, service restart messages |
| Security Monitoring | Detect unauthorized access or suspicious activity | Failed login attempts, privilege escalations, and access log anomalies |
| Compliance and Auditing | Prove that systems are behaving according to policy and regulation | User activity logs, data access logs, and configuration changes |
| Performance Tuning | Identify bottlenecks or inefficiencies through patterns in log messages | Long-running queries, slow API responses, and retry loops |
| Change Tracking | Track configuration changes, deployments, and updates | Git commit logs, CI/CD pipeline logs, and infrastructure change events |
| Workflow Monitoring | Monitor business logic and end-to-end process flow | Order processing steps, transaction state changes, job start/complete logs |
| User Behavior | Analyze how users interact with systems or applications | Login logs, clickstream logs, feature usage events |
| Root Cause Analysis | Reconstruct what happened before and during an incident | Log traces correlated across systems, error breadcrumbs |
| Threat Hunting | Proactively identify malicious or abnormal activity | Lateral movement, brute-force patterns, use of unusual tools or IPs |
| Distributed Tracing | Supplement trace spans with context-rich logs | Logs that include trace_id, span_id, user/session metadata |
| Infrastructure Monitoring | Diagnose issues with servers, containers, and cloud infrastructure | Systemd logs, container stdout/stderr, service crash dumps |
Intelligent Patternization with Edge Delta
Log data is essential for deep investigations and forensic analysis, but it can be difficult to understand overall log behavior by looking at a running list of individual log items. With Edge Delta’s Telemetry Pipelines, teams can generate high-level log summaries by extracting recurring patterns from log bodies in real time — providing immediate insight into trends.
To enable this functionality, simply add a Log to Pattern processor to your desired multi-processor:
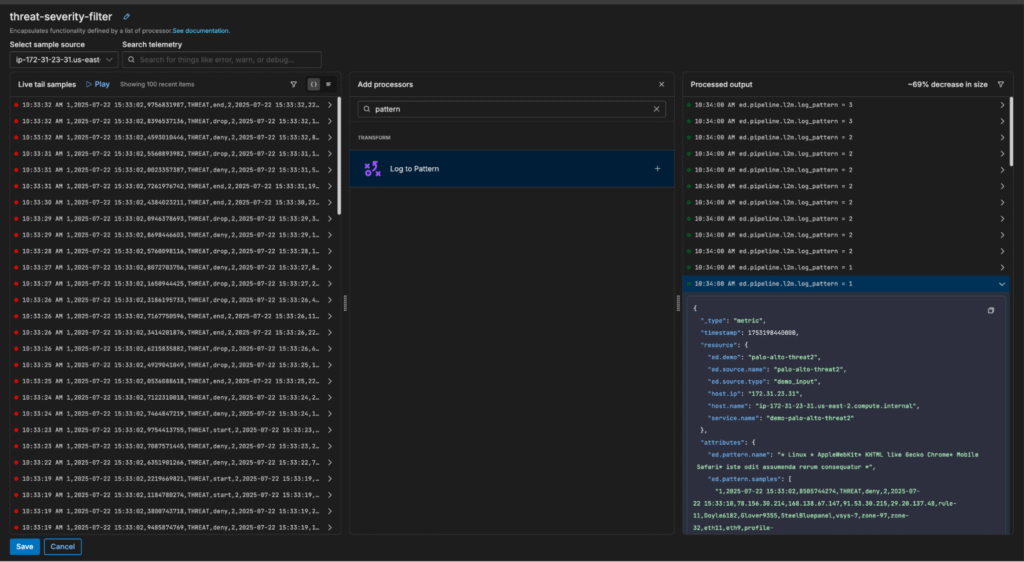
Once created, patterns can be sent to any downstream destination. This includes Edge Delta’s Observability Platform, which provides an out-of-the-box view into pattern behavioral trends:
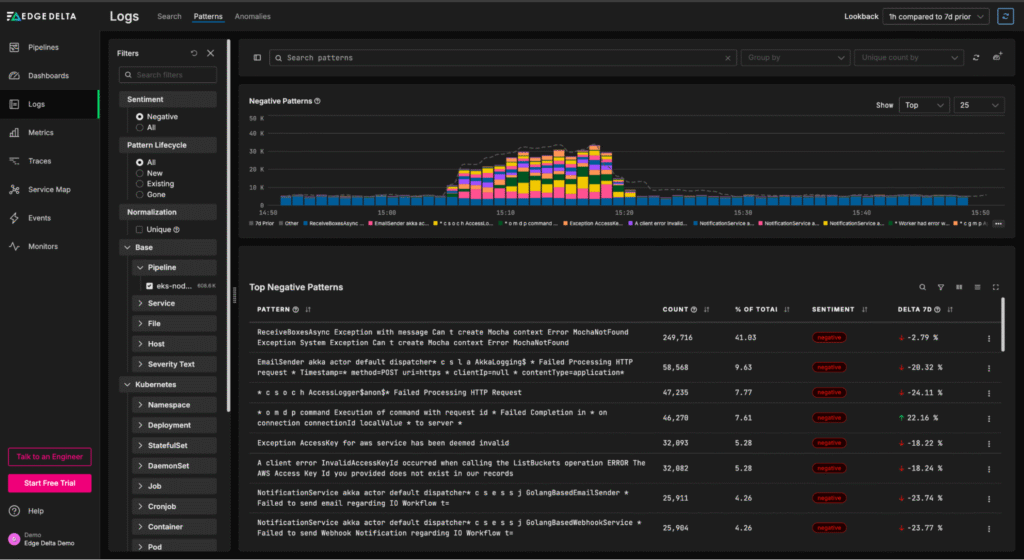
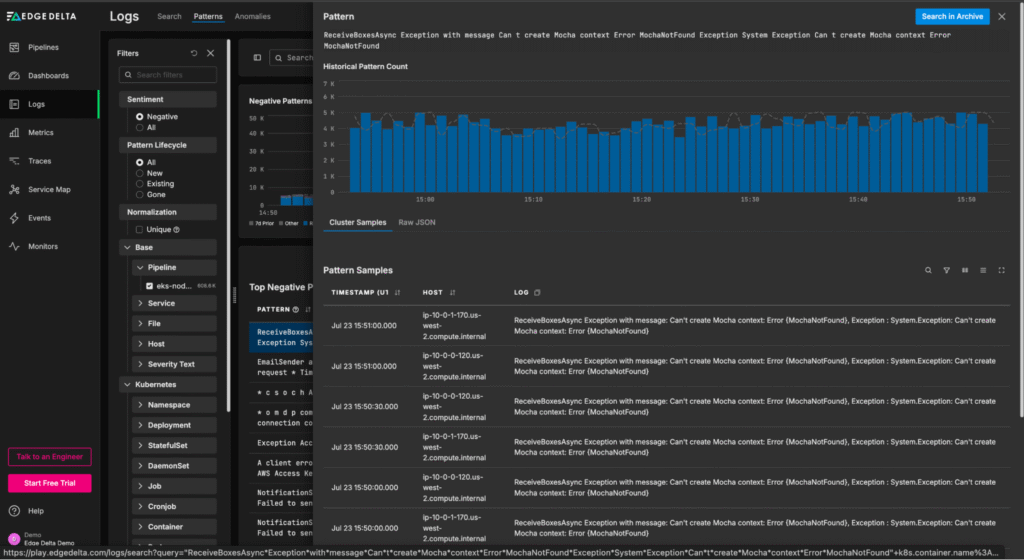
From this “Patterns” page, teams can quickly understand log behavior at a glance, and easily drill into the full-fidelity log items associated with a particular negative-sentiment pattern:
Traces
Traces are end-to-end records of individual requests or transactions as they move through a system, broken into spans that represent each operation or service hop along the way. They help us understand the “where and why.”
Each span captures key details like timing, status, metadata, and parent-child relationships — all of which come together to form a complete request flow graph.
Tracing is especially valuable in microservices, serverless, and other distributed architectures, where logs and metrics can’t provide the context needed to understand performance bottlenecks or failure points.
General Use Case Examples for Traces
| Category | Use Case | Trace Examples |
|---|---|---|
| Distributed Request Tracking | Follow a single request as it moves across microservices or tiers | Trace ID spans covering API Gateway → Auth Service → DB → Cache → Response |
| Latency Bottleneck Identification | Identify where time is spent in request flows | Slow span in DB query or downstream service call stands out in the trace timeline |
| Root Cause Analysis | Understand which component in a chain caused an error or slowdown | Error or exception tagged in the relevant span with stack trace or status code |
| SLA/SLO Enforcement | Track service performance against latency or availability objectives | 99th percentile latency for a specific endpoint exceeding the threshold |
| Service Dependency Mapping | Visualize service-to-service communication and dependencies | Auto-generated service map from collected spans and traces |
| Cold Start and Initialization Monitoring | Identify slow start times in serverless or container-based apps | First spans show long delays before actual processing starts |
| Load Testing and Stress Analysis | Understand system behavior under load | Spans show degraded performance or queue buildup under high traffic |
| Debugging Intermittent Failures | Spot flaky behavior or inconsistencies in service interactions | Traces reveal patterns (e.g., only fails when Service C is involved) |
| Feature Rollout Observability | Compare request behavior before and after feature flag toggles | Traces from different release versions or experiments show changed span durations |
| Queue and Message Bus Timing | Measure time spent in async systems like Kafka, RabbitMQ, and SQS | Separate spans for message enqueue, dequeue, processing, and acknowledgment |
| Contextual Alerting | Enrich alerts with trace context for faster resolution | Alert links to slow or failed traces with span hierarchy and service metadata |
| Security and Compliance | Track data flows or access to sensitive components | Traces showing which user accessed which resource, when, and how |
Tail-Based Sampling with Edge Delta
Modern systems generate incredibly high volumes of trace data due to the scale and complexity of their service-to-service interactions.
With Edge Delta’s Gateway Pipeline deployment, teams can apply tail-based sampling to filter out low-value traces before they’re shipped downstream, reducing ingestion costs and eliminating noise during troubleshooting.
It’s easy to configure tail-based sampling within Edge Delta’s UI — let’s walk through how it’s done using a demo pipeline running in our Playground environment.
First, we’ll enter the pipeline, click on the “Trace Tail Sampling” multi-processor node, and search for the Tail Sampling processor:
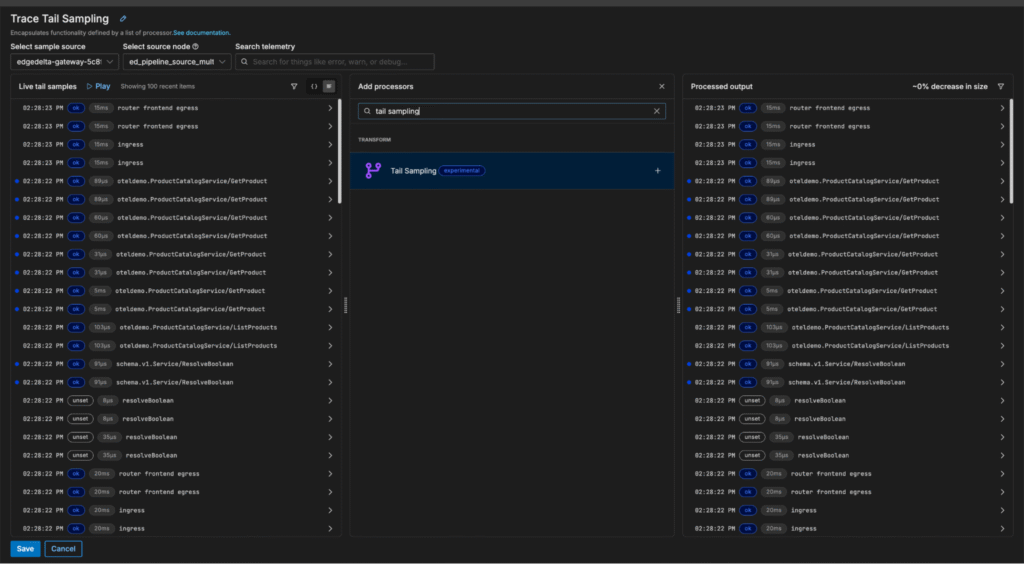
Once added, the Tail Sampling processor can be configured to sample trace data probabilistically — or by evaluating attributes like trace latency, span count, and status code:
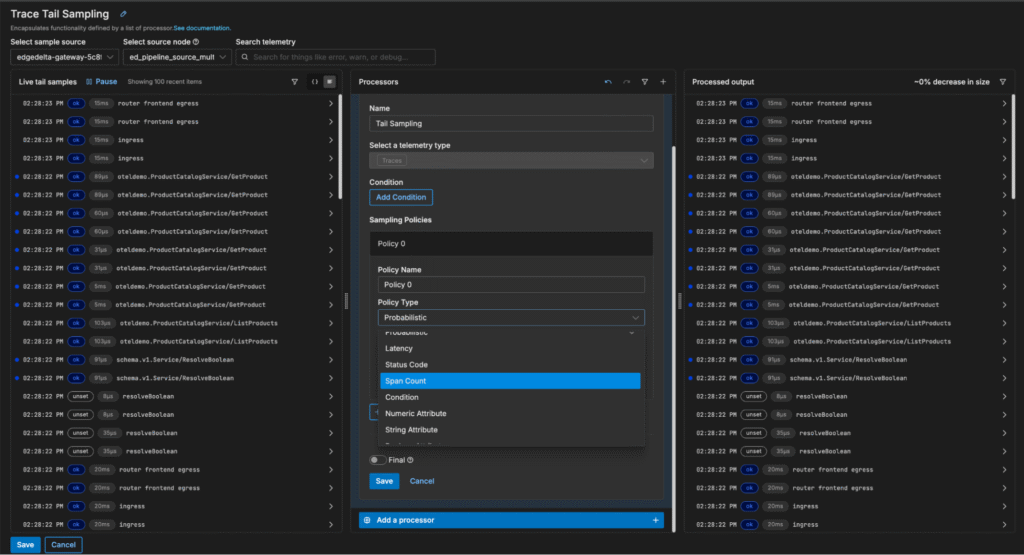
In this example, we want to focus on analyzing traces with a high span count. We can quickly add a new span count sampling policy to filter out small traces (in this case, those with fewer than 12 spans), which reduces trace volume by 63%:
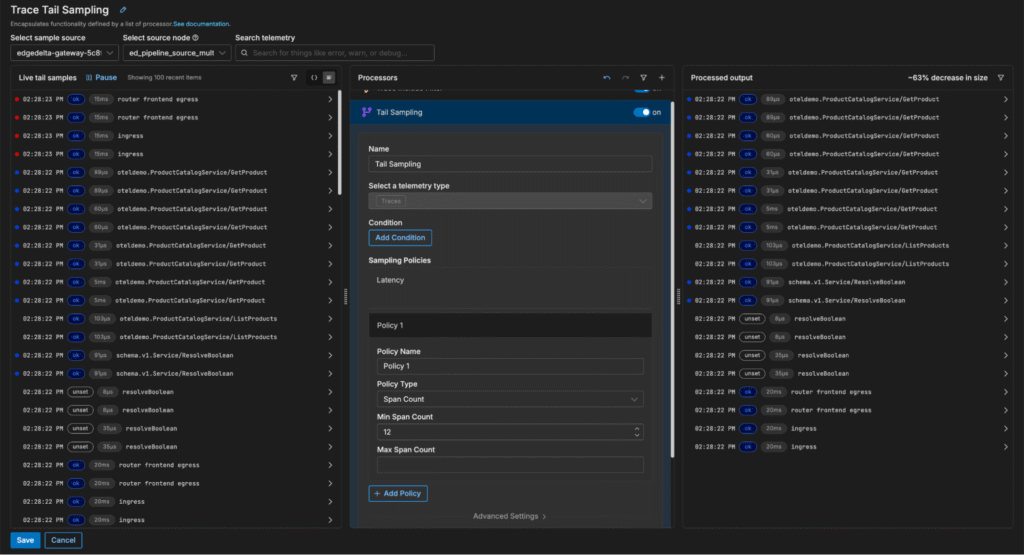
Once the change is saved, the Gateway Pipeline immediately begins dropping low-value traces at the source, before they clog up our costly downstream monitoring and analysis platforms — helping us evaluate critical trace data to pinpoint issues more efficiently.
Enhanced Observability with Edge Delta
Observability is no longer optional — it’s essential for operating and securing modern, distributed systems. Whether you’re tracking high-level performance through metrics, investigating unexpected behavior via logs, or analyzing request flows with traces, observability gives teams the visibility and insight they need to maintain reliability, resolve incidents quickly, and deliver exceptional user experiences.
But implementing an observability strategy requires more than data collection — it demands the ability to process, correlate, and act on that data in real time. That’s where Edge Delta comes in.
Edge Delta’s Telemetry Pipelines are purpose-built to help organizations harness the full power of observability. They not only ingest logs, metrics, and traces from your environment but also transform and enrich this data at the source to generate high-value, actionable signals. This enables you to detect anomalies earlier, reduce noise, and gain deeper insights — without waiting for data to reach a backend. Whether you’re storing data in Edge Delta’s own Observability Platform or forwarding it to other tools, you maintain control over performance, cost, and data fidelity.
No matter where you are on your observability journey, Edge Delta empowers you to build a smarter, more scalable observability architecture tailored to your needs.If you’d like to experiment with Edge Delta, check out our free, interactive Playground. You can also start a free trial to dig in on your own.


