


Performance regressions are the silent killers of system reliability. They can creep in with seemingly innocent code changes and go unnoticed until they accumulate and cause significant issues in production. This is especially common in microservice architectures. Issues within a single service often result in cascading failures across other services that rely on it to function, leading to user-facing performance degradation.
At Edge Delta, we’ve worked hard to create a robust benchmarking system to ensure the health and performance of our Go-based microservices. It works by automatically testing new agent component code thoroughly — both in isolation and in holistic real-world scenarios — before the changes reach production. In this post, we’ll explore how we leveraged Go’s native benchmarking functionality to build our own performance testing pipeline — and explain the key decisions we made along the way.
Benchmarking in Go
While integration testing and production monitoring are essential for assessing code performance, they often detect problems too late — after changes have been merged and deployed. Microbenchmarks are an effective solution that provide granular visibility into code performance and reliability by testing single-task executions against baselines before changes reach live environments. This allows us to:
- Isolate specific components for focused performance testing on every pull request
- Detect and alert on performance regressions within PRs
- Understand the impact of specific code changes on key metrics like CPU and memory usage
- Establish a performance baseline for future comparisons
Our microbenchmarking framework is built off of Go’s native benchmarking functionality, which simplifies benchmark creation with data and function types purpose-built for testing.
In our testing framework, each component (a logically-grouped section of code with inputs, processing steps, and an output) has an implementation that includes a corresponding benchmark_processor_test.go file. Each file defines a benchmark suite that runs automatically when any component changes are made, gathering performance metrics across multiple iterations to control for external factors and establish statistical significance. By comparing performance against previous baselines, we are able to determine how new code will impact the codebase when integrated.
Here is an example PR output generated by one such benchmarking test:
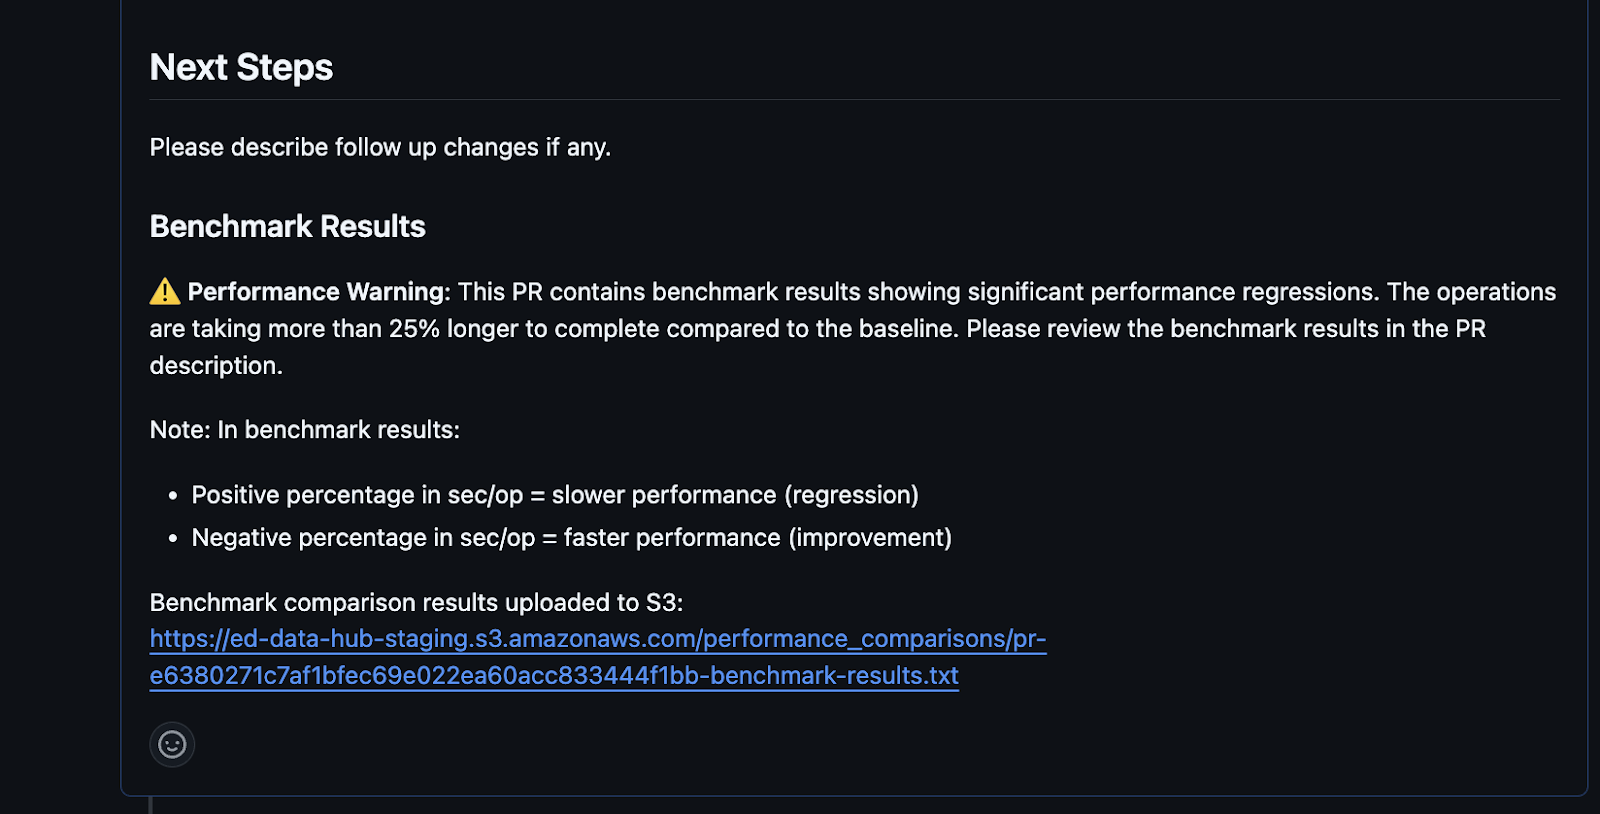
As you can see above, the test has collected benchmark results that indicate a performance regression. It has also provided a link to the S3 bucket where more detailed comparison results can be accessed.
Code Implementation Considerations
During implementation, we made several decisions to ensure our microbenchmarking framework performed as expected.
For instance, it was important to make sure each benchmark function only assessed elements of the hot path in order to isolate the code under test. Take the example benchmark code snippet below:
func BenchmarkProcessor(b *testing.B) {
p := NewProcessor()
testData := []byte("test data for processing")
for i := 0; i < b.N; i++ {
        /* expensive operations */
        tempFile, _ := ioutil.TempFile("", "benchmark")
        tempFile.Write(testData)
        tempFile.Close()
        fileData, _ := os.ReadFile(tempFile.Name())

        // b.ResetTimer()

        /* actual function to benchmark */
        p.Process(fileData)
        }
}
The setup work done before the commented line of b.ResetTimer() is not part of the Process function, which is the method we’re actually trying to assess. By uncommenting the ResetTimer call, the Go benchmark can ignore the initial file read and write operations and focus solely on the p.Process(fileData) function’s performance.
Additionally, it was important to leverage Go’s native iteration testing management for accuracy and efficiency. Take the example code snippet below. Go’s benchmarking will automatically continue to scale up b.N until a statistically significant result is reached. This means there’s no need for us to specify an upper limit ourselves (as is done with the “throughPutTest” variable in the incorrect approach):
// incorrect way to benchmark
func BenchmarkProcessor(b *testing.B) {
p := NewProcessor()
for i := 0; i < throughPutTest; i++ {
        p.Process(fileData)
        }
}
// correct way to benchmark
func BenchmarkProcessor(b *testing.B) {
p := NewProcessor()
for i := 0; i < b.N; i++ {
        p.Process(fileData)
        }
}
Tuning Go Flags for Optimal Benchmarking Performance
Go’s benchmarking framework offers powerful tools for controlling test execution, but default settings often prioritize speed over consistency. We carefully tuned our benchmark flags to maximize result reliability.
Key Flags We Use
- -benchmem: Measures memory allocations alongside execution time, helping us detect memory usage regressions
- -count=10: Runs each benchmark 10 times to ensure statistical significance
- -run=^$: Skips regular tests during benchmark runs to reduce environmental noise
- GOMAXPROCS=10: Sets a consistent number of available processors regardless of host configuration
Additionally, we leveraged Go’s internal benchstat tool for statistical analysis of benchmark results, and implemented a custom comparison threshold of 25% or higher. When the threshold is breached, the PR immediately updates its status to “blocking in review”.
Holistic Benchmarking: Real-World Scenarios
The Importance of Agent Scenarios
While the above benchmarks help with assessing individual performance, many of our agent’s operations span many different components. By testing common customer scenarios and incorporating asynchronous or hard-to-isolate components — such as goroutines, channels, worker groups, and locks — into our benchmarks, we gain valuable insight into how each component will perform holistically once merged.
Our Approach
After each PR is merged and individual component benchmarks are verified, a CircleCI workflow triggers several pre-built scenarios using an agent executable, periodically recording CPU, memory, and allocation measurements. This approach has helped us catch several issues that didn’t have massive repercussions in isolation, but in full execution caused a significant increase in garbage collection and memory allocation.
Maintaining test scenarios is incredibly hard, as it requires a deep understanding of evolving customer usage patterns. Still, it’s a vital part of benchmarking. By tailoring our test cases to real-world scenarios, we can remain confident in our agent’s ability to perform in even the most limiting environments.
Self-Hosted CI Runners: Consistency Through Control
Why We Chose Self-Hosted
While cloud-based CI solutions offer convenience, they introduce several challenges for performance benchmarking:
- Hardware variability — Cloud providers often use heterogeneous hardware based on cost and availability, meaning your workload might run on different CPU generations or configurations between runs.
- Noisy neighbors — Shared infrastructure means other workloads can impact your performance measurements.
- Resource constraints — Many cloud CI environments limit CPU and memory resources, making performance measurements less representative of production performance.
These are big problems that lead to inconsistent benchmark results between runs. The same code can produce significantly different performance metrics on different executions, making it impossible to reliably detect regressions.
We decided to self-host our CI runners to overcome these challenges. By implementing self-hosted CircleCI runners on dedicated hardware, we were able to take full control over system configurations and tuning parameters — isolating testing environments and establishing consistent CPU, memory, and storage configurations. With containers built specifically for testing and that leverage owned infrastructure as the underlying hardware, we were also able to control for thread counts, fully enabling consistent comparisons across Go benchstat runs.
Our Implementation: A Walk Through the Pipeline
Our benchmark pipeline consists of two main components:
- Benchmark collection script: Runs when processor code changes are detected and stores results in version control
- Benchmark comparison script: Compares new results against the master branch and updates PRs with findings
The workflow operates as follows:
- When a PR modifies processor code, our CI system automatically triggers the benchmark collection script.
- The script identifies affected processors and runs their corresponding benchmarks, and the results are stored in a version controlled environment as part of the PR.
- The comparison script compares these results against the master branch baseline.
- Detailed comparison reports are uploaded to S3 for deeper analysis.
- The PR description is updated with a summary of performance changes.
- Significant regressions (>25%) trigger a warning that must be addressed before merging.
- After merging, the agent scenarios are run and results are also uploaded to S3.
- Results can be queried through an API or viewed on our support page, with metadata-based filtering and sorting available.
Below is a table with example results of a benchmark run:
| Test Date | Scenario | CPU (millis) | Alloc (MB) | Memory Percent | Logs/Sec | Commit Link |
|---|---|---|---|---|---|---|
| 2025-05-18-19-44 | scenario8 | 82.95 | 29.9 | 1.59 | 10750 | Commit |
| 2025-05-18-20-09 | scenario8 | 84.46 | 31.35 | 1.61 | 10744.44 | Commit |
| 2025-05-19-13-53 | scenario8 | 83.61 | 31.19 | 1.59 | 10738.88 | Commit |
| 2025-05-19-15-29 | scenario8 | 94.1 | 31.43 | 1.62 | 10741.66 | Commit |
As you can see the latest run for this scenario signals a potential performance impact. We can look closer at what the scenario is testing and what change was made to understand the extent and severity of the regression.
Results and Lessons Learned
This benchmarking system has completely transformed our development process. We’ve proactively prevented performance regressions by giving developers visibility into the impact of their changes before code is merged. This performance-first mindset is now embedded in our culture, leading to a significant drop in production incidents.
Along the way, we’ve learned that consistency is key — controlling all environmental variables is essential for producing reliable results. Automation is also crucial, as manual benchmarking can be prone to inconsistency and human error that can invalidate performance results. Additionally, making performance data visible in pull requests keeps performance top-of-mind for engineers, while clear thresholds ensure teams focus only on meaningful regressions.
Together, these practices have enabled us to build more performant software — faster and with greater confidence — so that our customers can practice observability and security at enterprise scale.


