In the first part of this series we deployed the Prometheus Operator Helm chart to start building up our monitoring suite. With the metrics, alerting server and integrated dashboards, we can monitor cluster health, pods, nodes and Kubernetes workloads resource usage and statuses. However, we have yet to monitor more interesting and relevant things such as production applications and services running for customers that provide business value.
As a reminder we deployed Prometheus Operator under Kubernetes namespace “monitoring” and release name was “promop”.
In this post (Part 2/2), we will add the missing piece, the Edge Delta Agent (link to part 1/2 here). Edge Delta’s Agent is the distributed “edge” component of the Edge Delta observability solution.
The Agent system:
- Tracks applications, services, devices at the edge where telemetry data is generated
- Keeps track of metrics
- Intelligently analyzes log data
- Automatically generates baselines against analyzed telemetry data
- Detects anomalies
- Collects contextual information when an anomaly occurs
- Generates alerts and notifications
These additional capabilities make detecting issues and fixing problems much more efficient.
On top of these abilities, the Edge Delta Agent can also function as a Prometheus exporter (on steroids) for organizations who want to also keep their existing monitoring pipeline. So let’s deploy the Edge Delta Agent and really monitor our application.
Subscribing
Edge Delta Agent is connected to a cloud managed service. First we need to register in a couple of steps for installation.
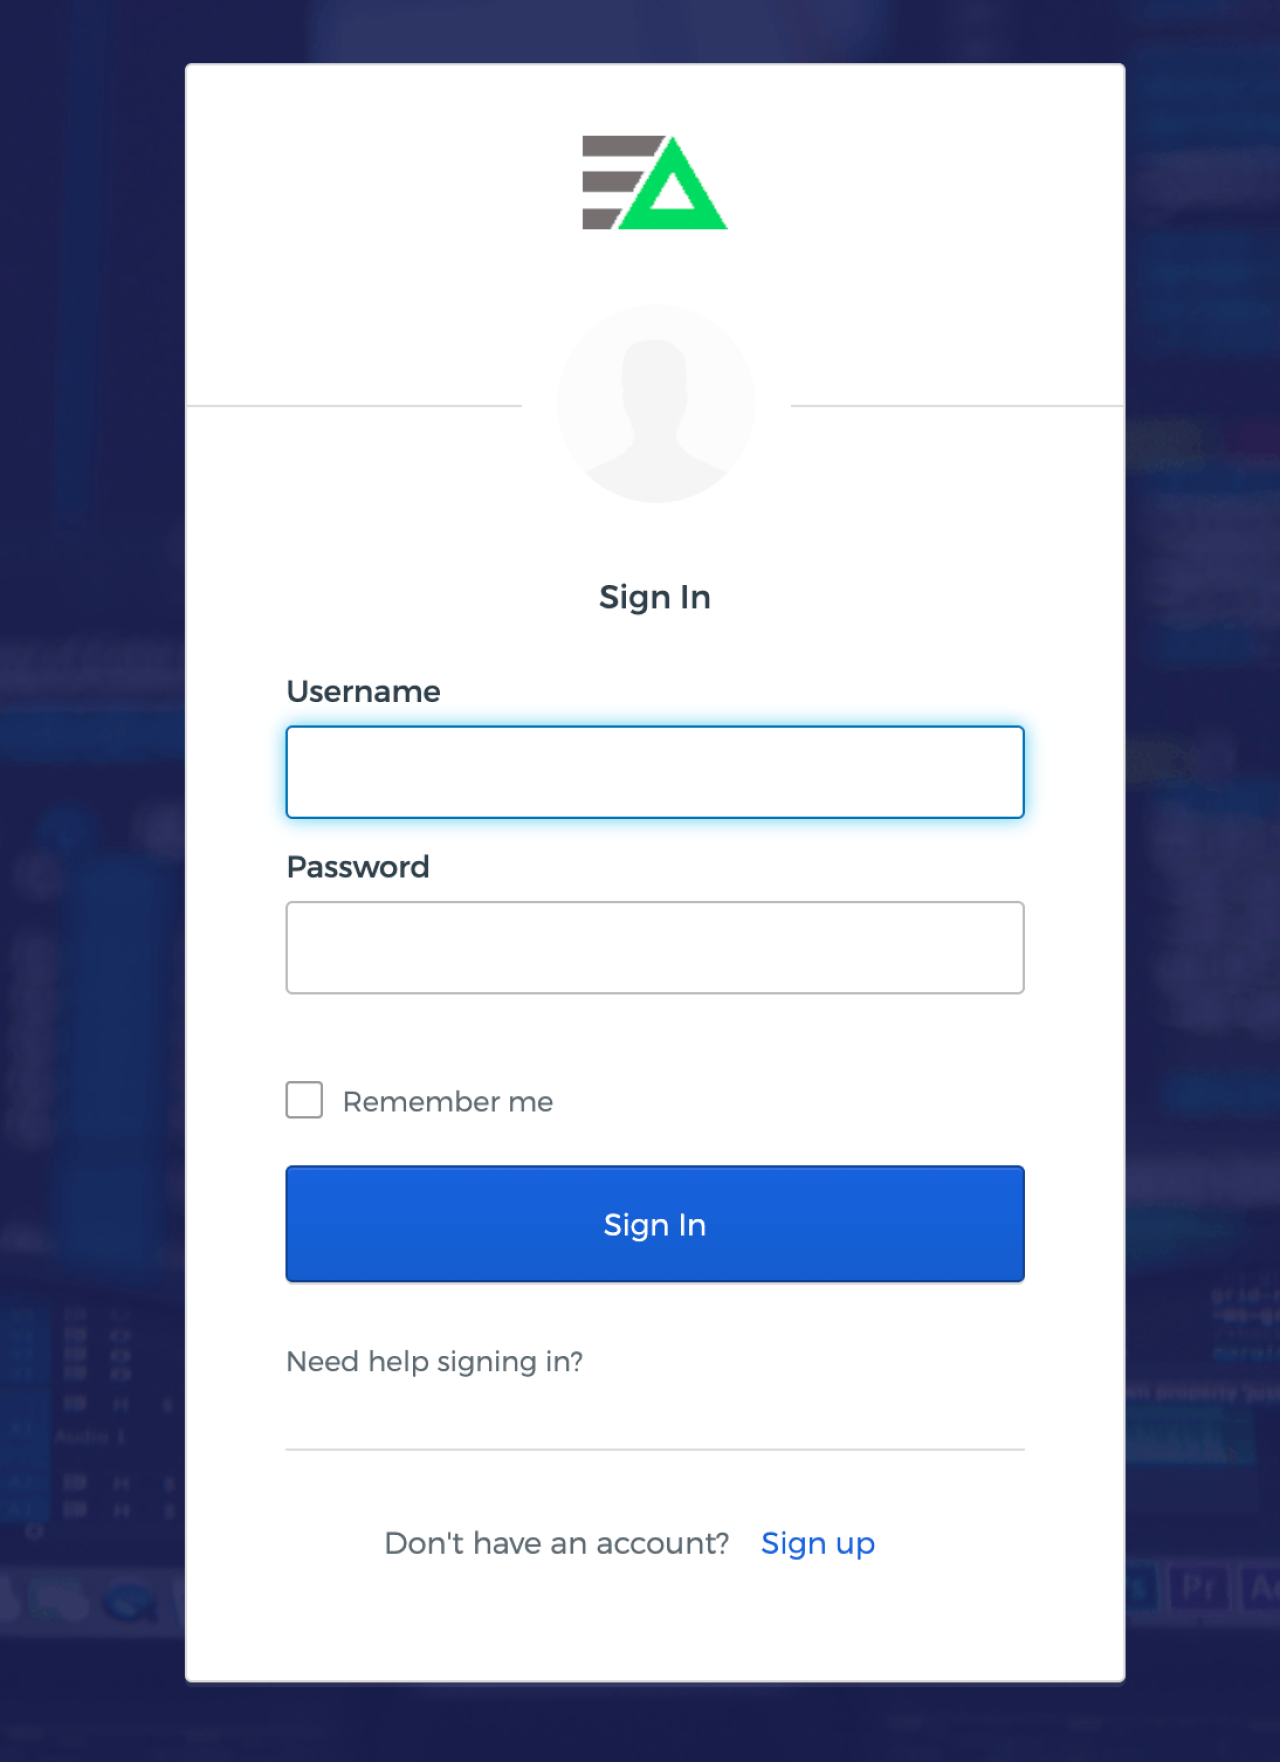
First visit https://app.edgedelta.com.
Follow the prompts to create an account:
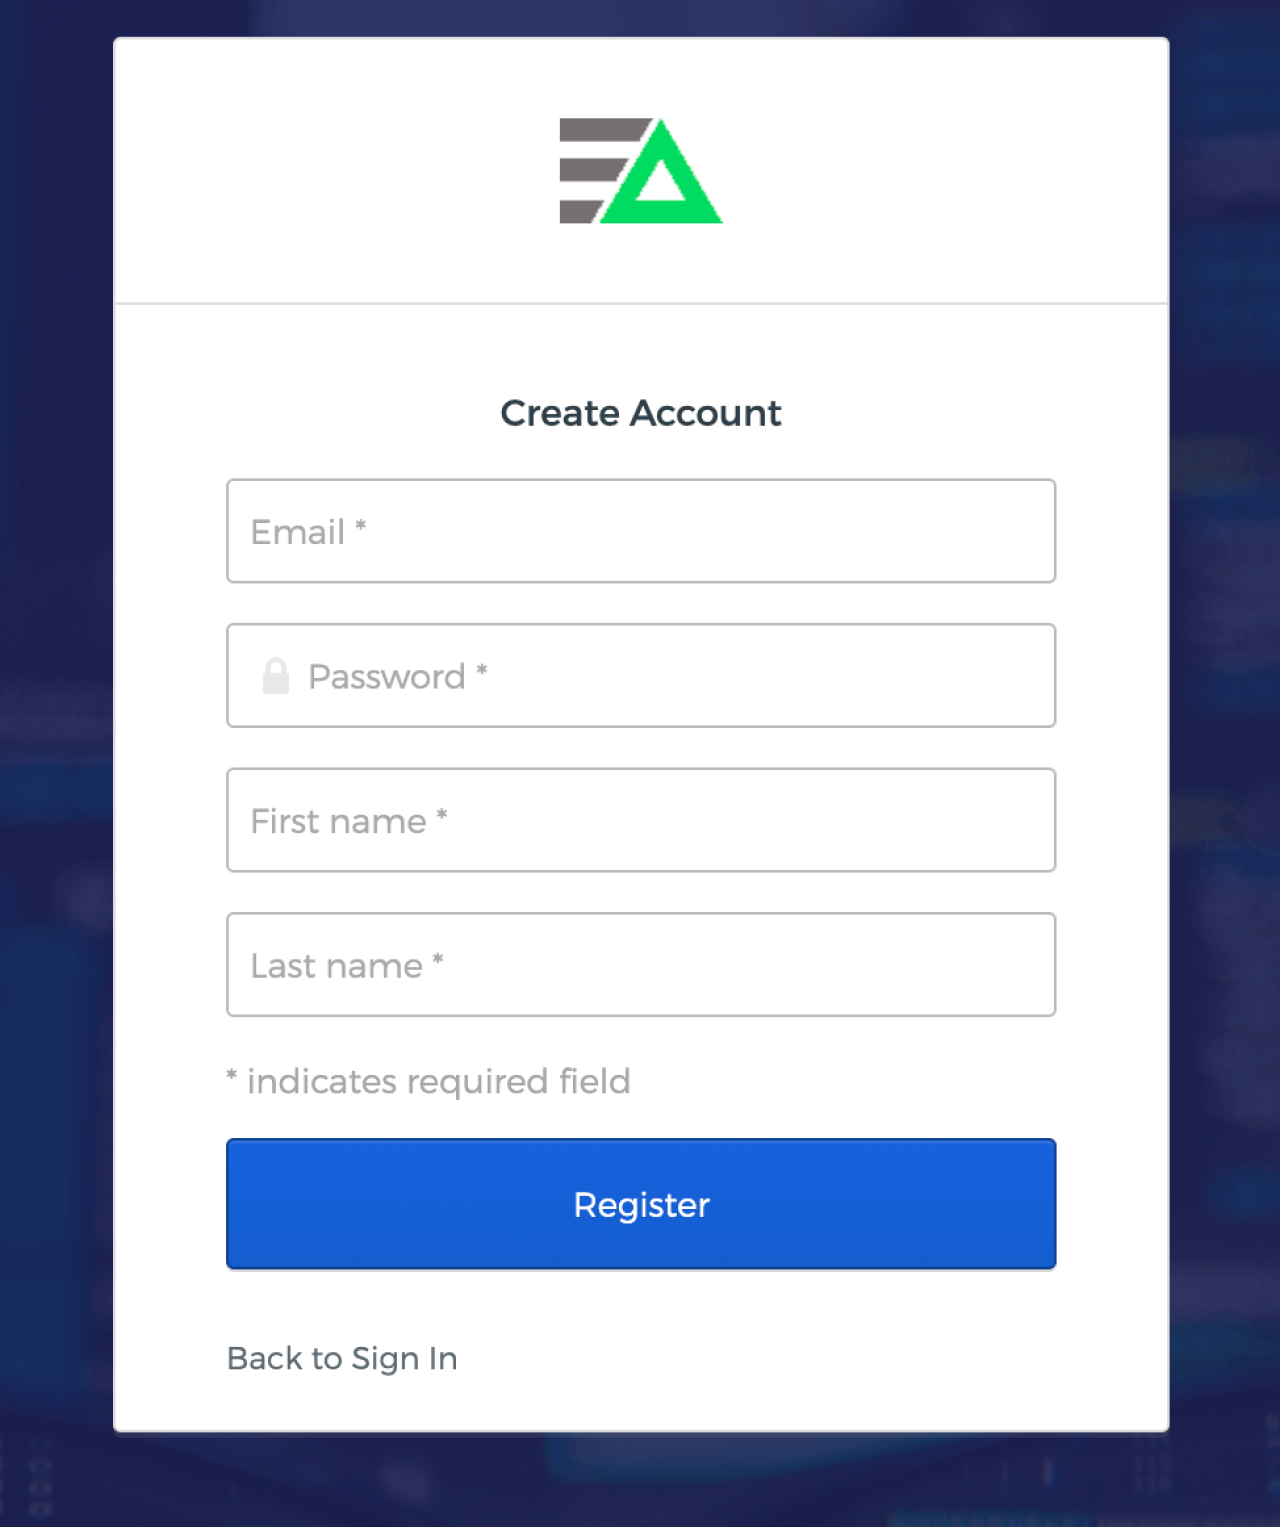
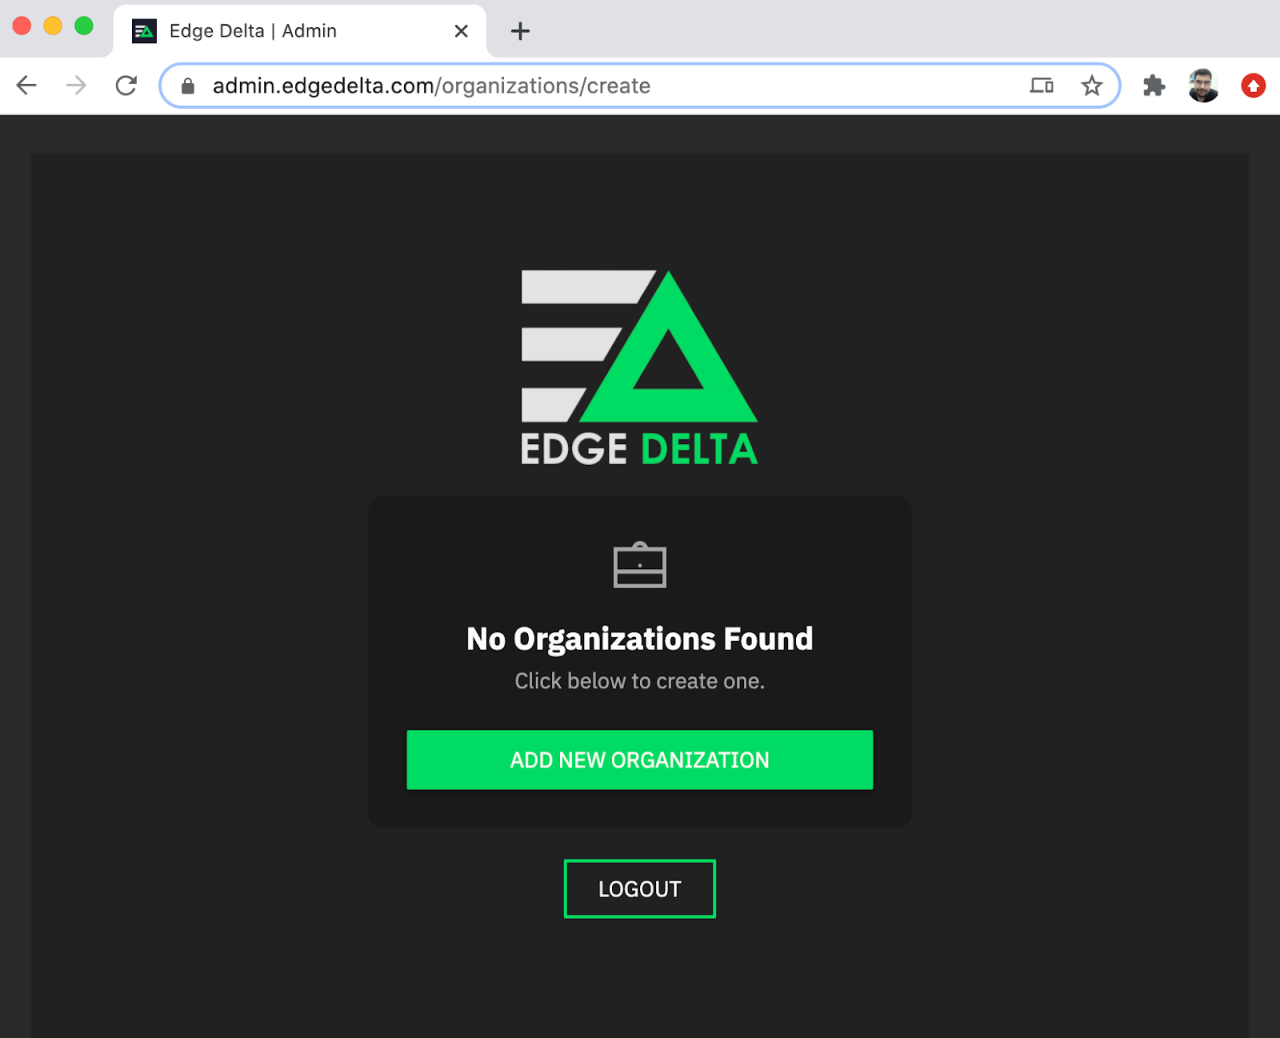
Create an organization where you can manage your agents by clicking ADD NEW ORGANIZATION.
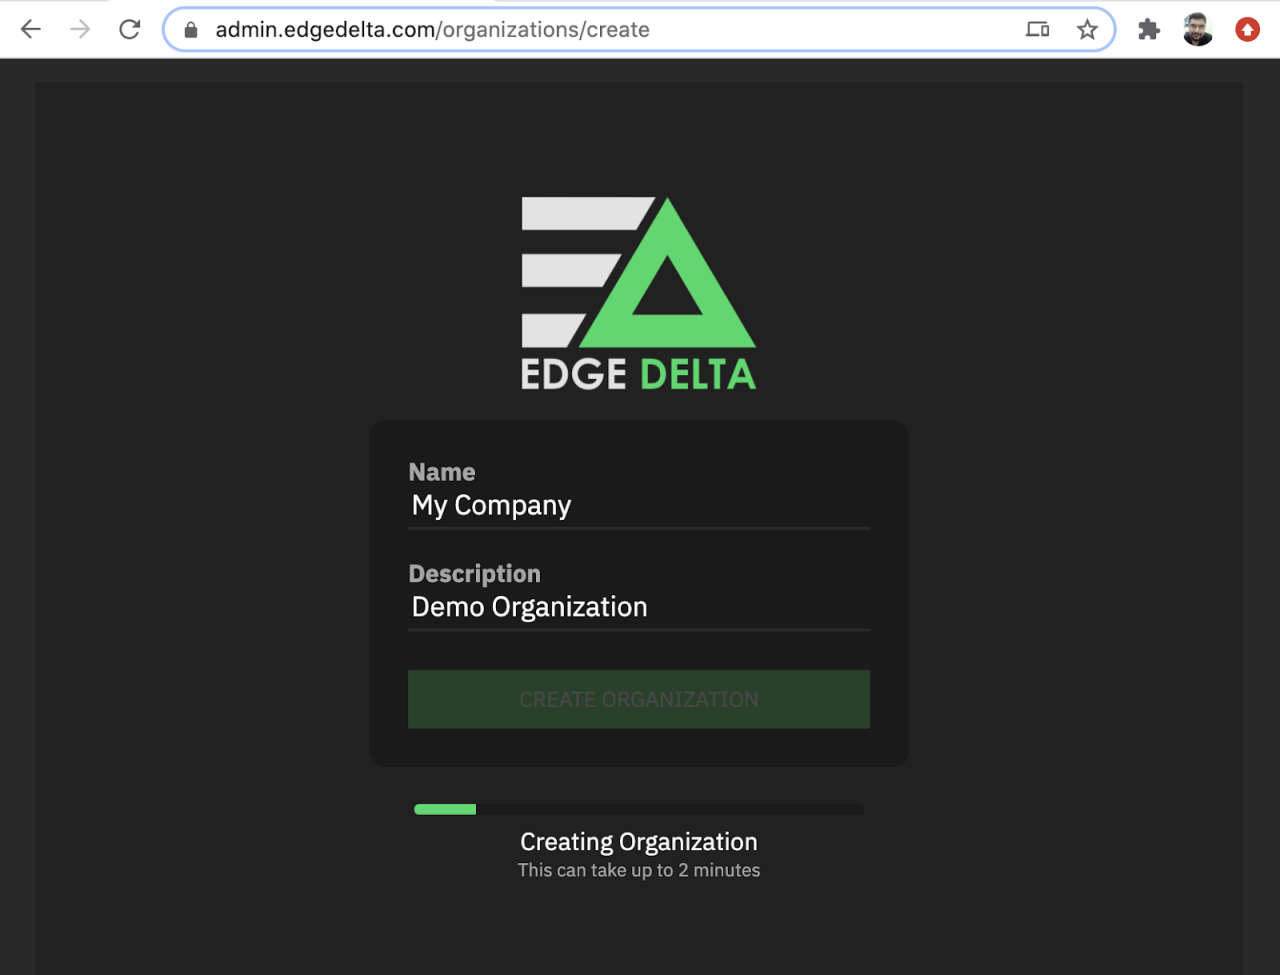
Fill in Organization Name and Description and click CREATE ORGANIZATION.
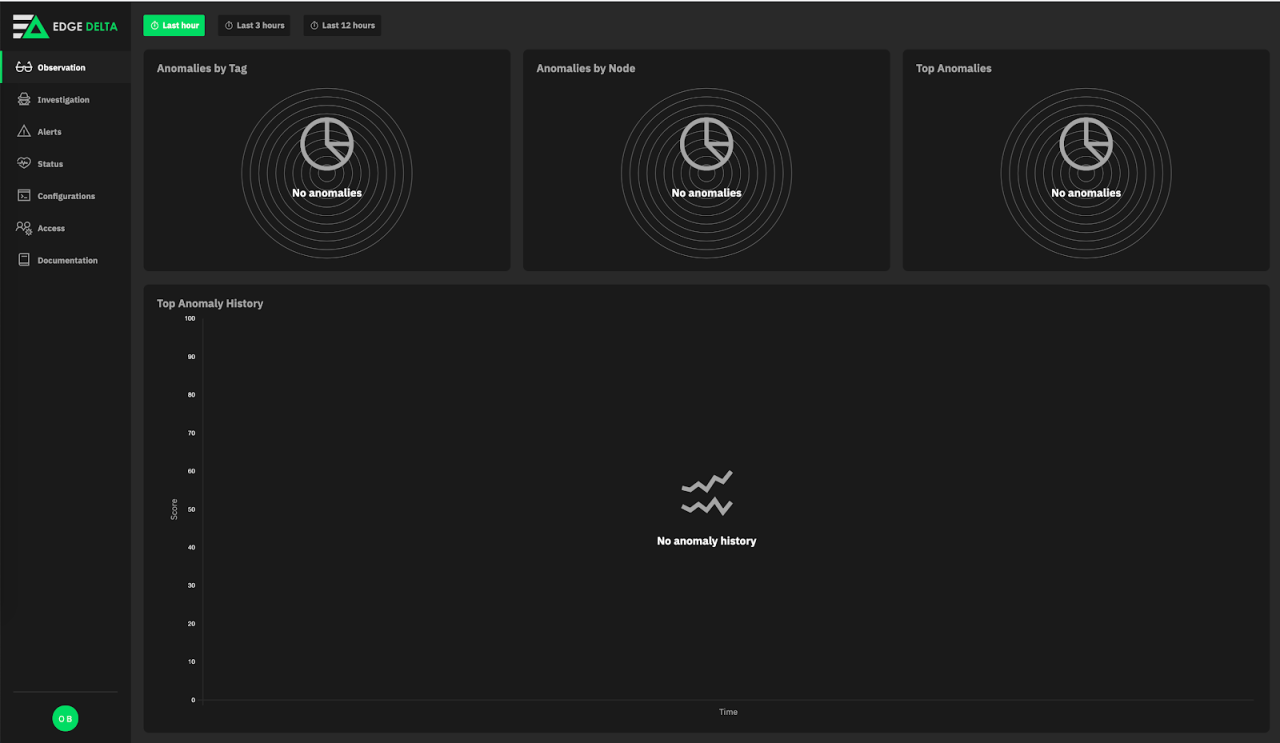
After creating the organization we are greeted by the dashboard, which is unsurprisingly empty (as we currently have no agents deployed). Let’s click Configurations on the left navigation menu.
Configuration
Configurations have three sample configurations to monitor common platforms. Since we want to monitor our Kubernetes pods, click CREATE CONFIGURATION.
Here is a simple configuration to collect logs from all pods in “myapp” namespace. You can also use “default” if you do not run your services in a namespace. Regardless, you will need to update “namespace=myapp” in line 10 to a namespace that exists in your cluster, alternatively you can specify a pod or set of pods via “pod=pod-prefix*”
The agent collects logs and analyzes them to create log clusters, which are log patterns that are generated, giving valuable insight into the status of your app without further application specific configuration.
version: v2
agent_settings:
  tag: prometheus-k8s-demo
inputs:
  kubernetes:
    - labels: myapp
      include:
        - "namespace=myapp"
processors:
  cluster:
    name: clustering
    num_of_clusters: 50
    samples_per_cluster: 2
    reporting_frequency: 30s
workflows:
  myapp-wf:
    input_labels:
      - myapp
    processors:
      - clustering
Reminder: Make sure to change line 10 (namespace)
Paste above config after changing namespace, tag and description as you desire as seen below:
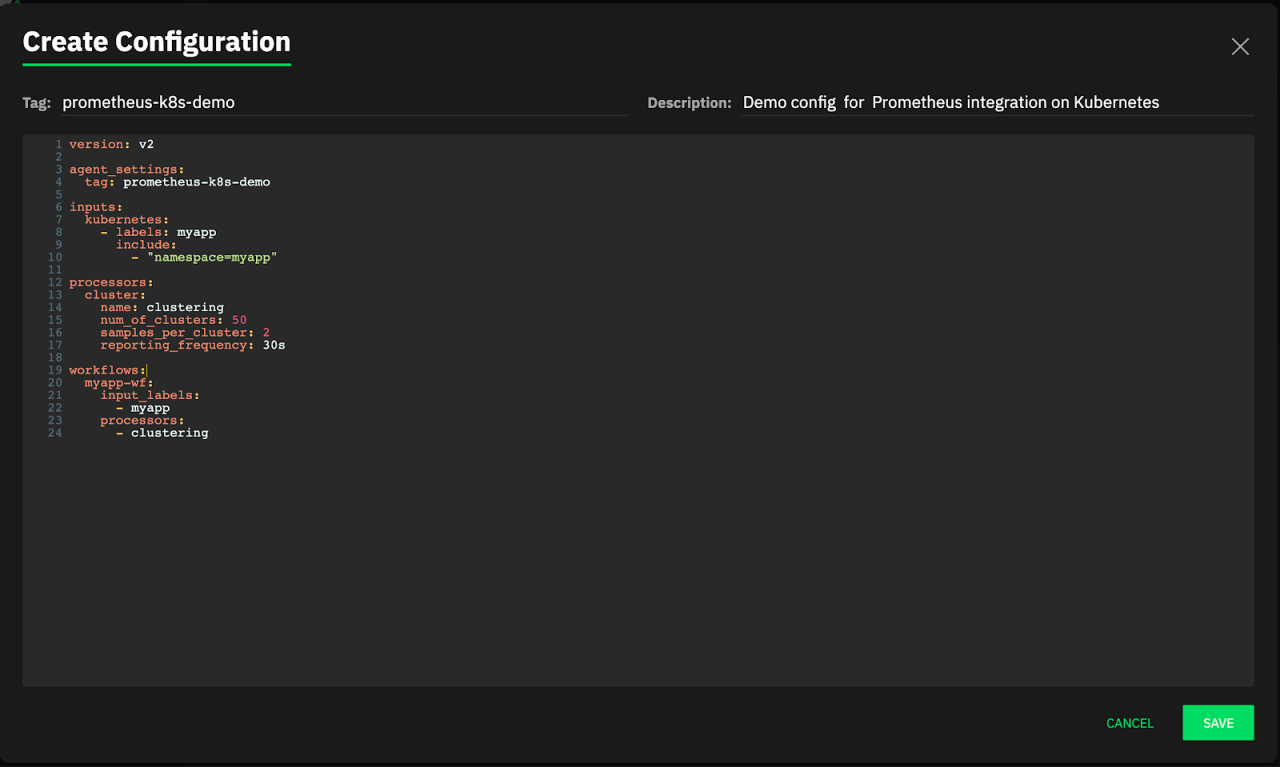
Click the Save button, and bottom of the Configurations table you can see the new agent configuration we created.

The UUID starting with 0f4… is the generated API Key for my configuration, yours will be a different key. Keep that key and we will set it as a secret Kubernetes environment variable for your Edge Delta agent deployment on your cluster.
First we need to deploy the agent itself. The below command will deploy the agent without requiring any change:
Run Command:
kubectl apply -f https://edgedelta.github.io/k8s/edgedelta-agent.ymlExpected Output:
namespace/edgedelta created
daemonset.apps/edgedelta created
clusterrolebinding.rbac.authorization.k8s.io/edgedelta created
clusterrole.rbac.authorization.k8s.io/edgedelta created
serviceaccount/edgedelta created
This will deploy the agent pods in edgedelta namespace but the agent will not yet start properly since we are missing the ed-api-key secret.
Let’s create the secret, ed-api-key should be set to your API Key fetched from UI above:
Run Command:
kubectl create secret generic ed-api-key
    --namespace=edgedelta
    --from-literal=ed-api-key="0f415c6c-83c3-4a02-8532-092abf12d1bc"
Expected Output:
secret/ed-api-key createdWait a few seconds, then check the pod status:
Run Command:
kubectl get pods -n edgedeltaExpected Output:
NAME              READY   STATUS    RESTARTS   AGE
edgedelta-dpcd8   1/1     Running   0          5s
edgedelta-wdnl8   1/1     Running   0          12s
I have 2 log generating pods running under myapp namespace.
Check the status page.
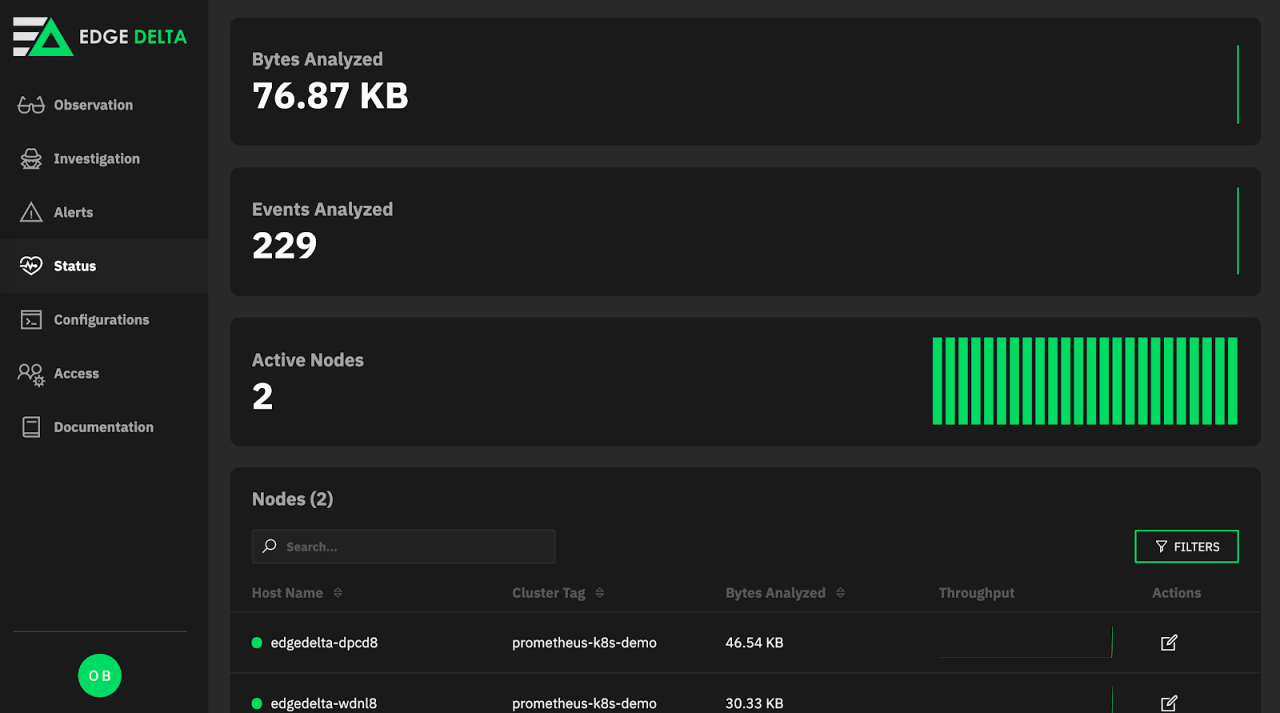
As seen above, this 2 node Kubernetes cluster is visible and events from myapp namespace are successfully flowing.
To be able to guide Prometheus to get metrics locally from Edge Delta Agent we need one more step. Download edgedelta-prom-servicemonitor.yml
You need to update “promop” in value in edgedelta-prom-servicemonitor.yml with your helm release name for prometheus, if you give another release name:
release: promopYou can check helm release names as below:
Run Command:
helm ls --all-namespacesExpected Output:
NAME  	NAMESPACE 	REVISION	UPDATED                             	STATUS  	CHART                    	APP VERSION
promop	monitoring	1       	2020-08-28 19:49:30.516141 +0300 +03	deployed	prometheus-operator-9.3.1	0.38.1
Also you need to update service monitor name to match the release name in same file:
# name should match default servicemonitors
# kubectl get servicemonitor -n monitoring
name: promop-prometheus-operator-edgedelta
Now we are ready to apply service and servicemonitor configuration for prometheus.
Run Command:
kubectl apply -f edgedelta-prom-servicemonitor.ymlExpected Output:
servicemonitor.monitoring.coreos.com/promop-prometheus-operator-edgedelta created
service/edgedelta-metrics created
After waiting a few seconds, we can connect to our Grafana dashboard. As you recall from the Part 1 here is the way to do that:
Run Command:
kubectl port-forward svc/promop-grafana 8080:80 -n monitoringExpected Output:
Forwarding from 127.0.0.1:8080 -> 3000
Forwarding from [::1]:8080 -> 3000
Monitoring Log Clusters
Open your browser to https://edgedelta.com/
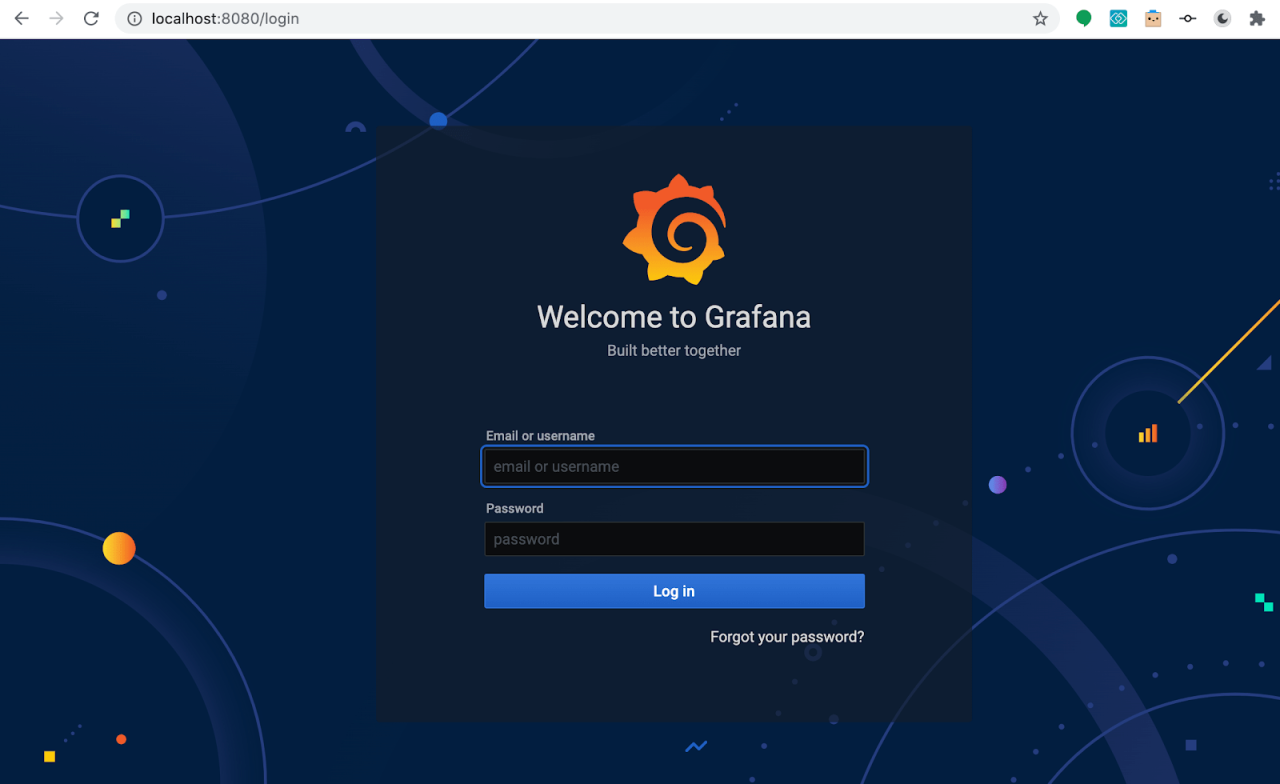
Default Grafana username is admin and password is prom-operator.
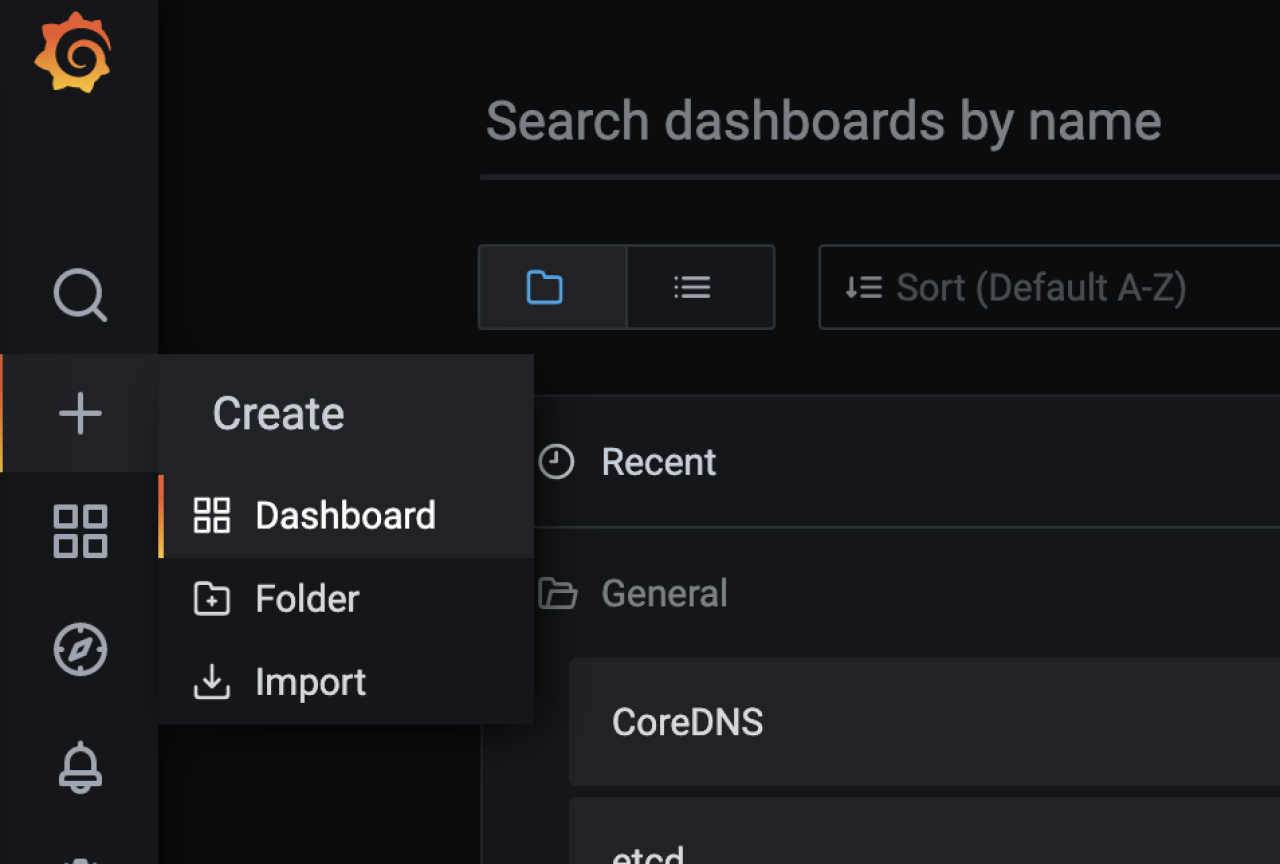
Click + icon and select Dashboard to create a new Dashboard
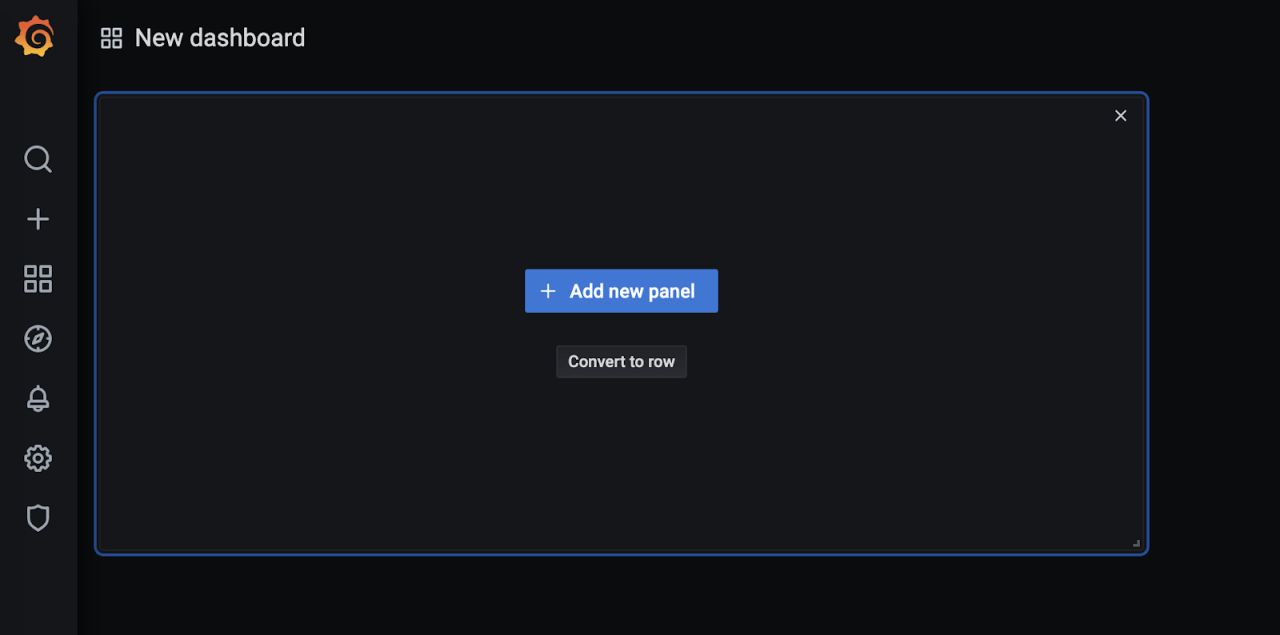
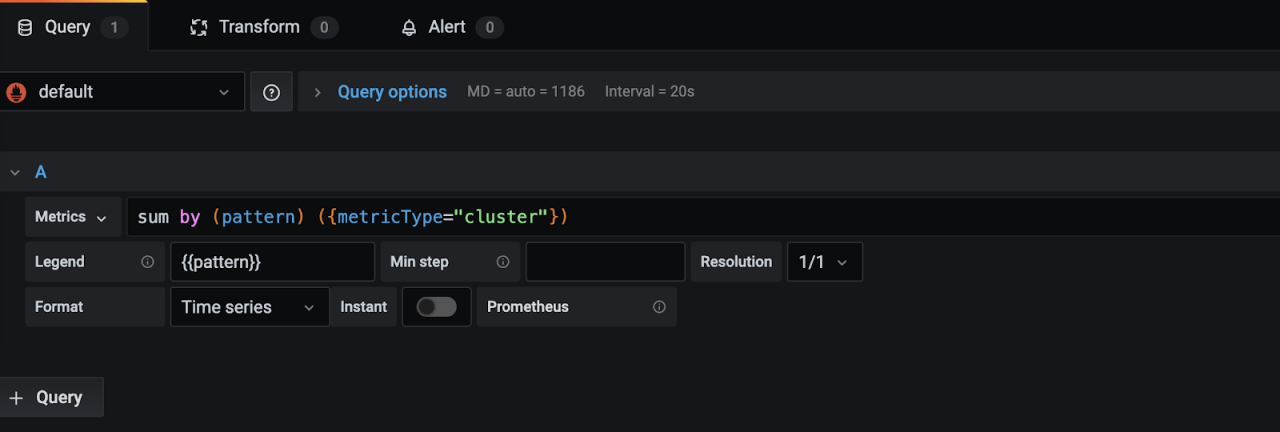
In our new click + Add new panel. And add the query sum by (pattern) ({metricType=”cluster”}) which gives the number of log clusters collected and analyzed.
For better visualization set Legend as {{Pattern}} in same panel.
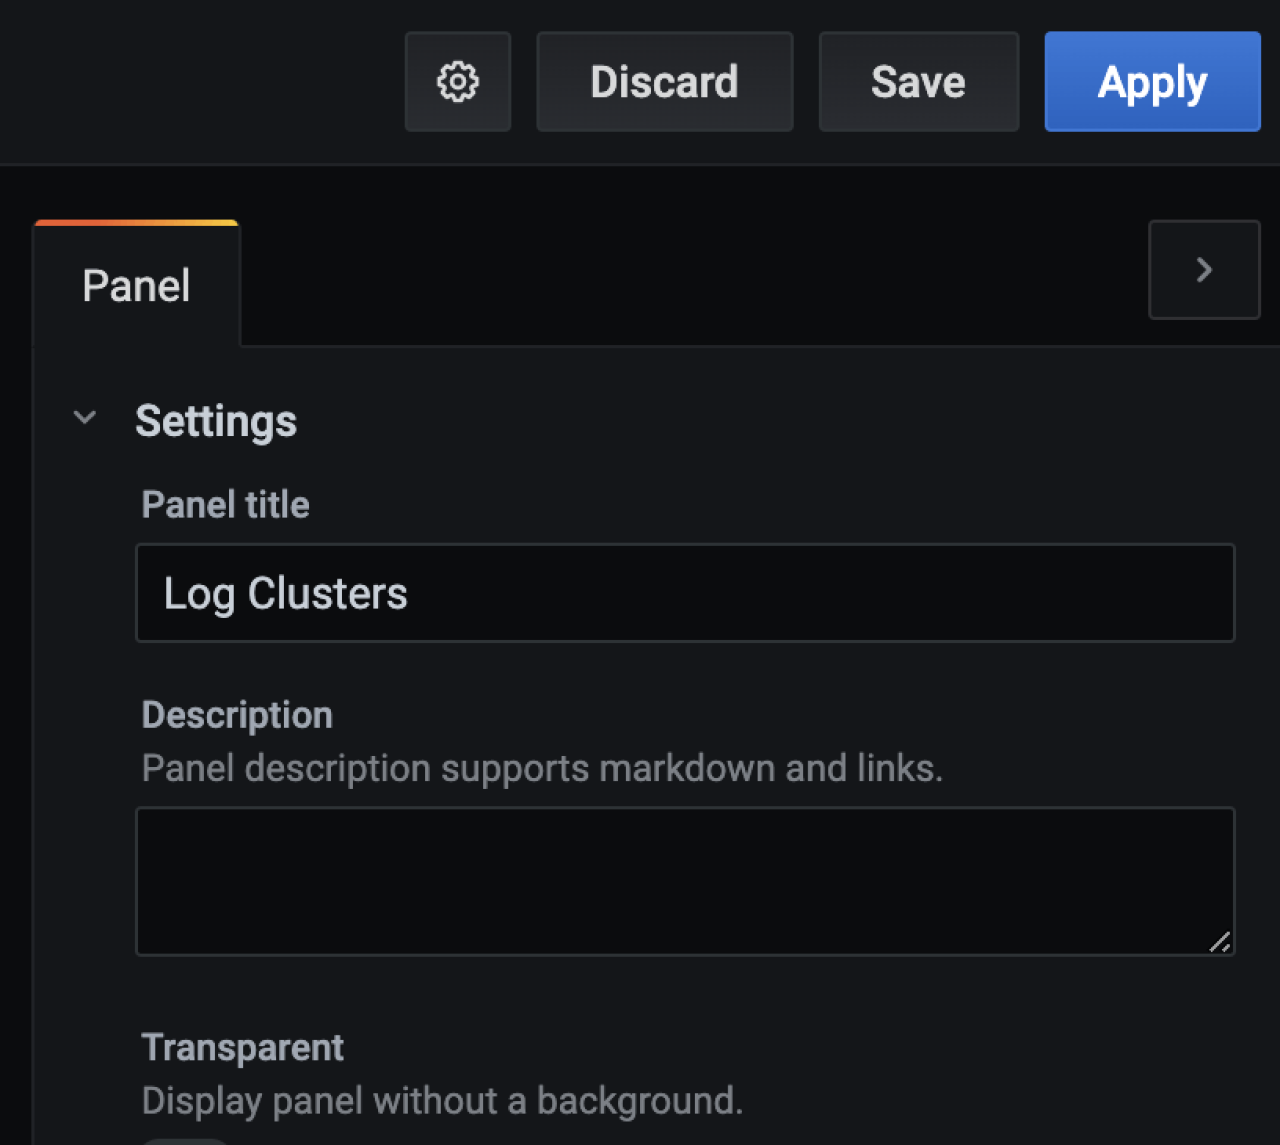
Set panel name as Log Clusters and click Apply at the top right corner.
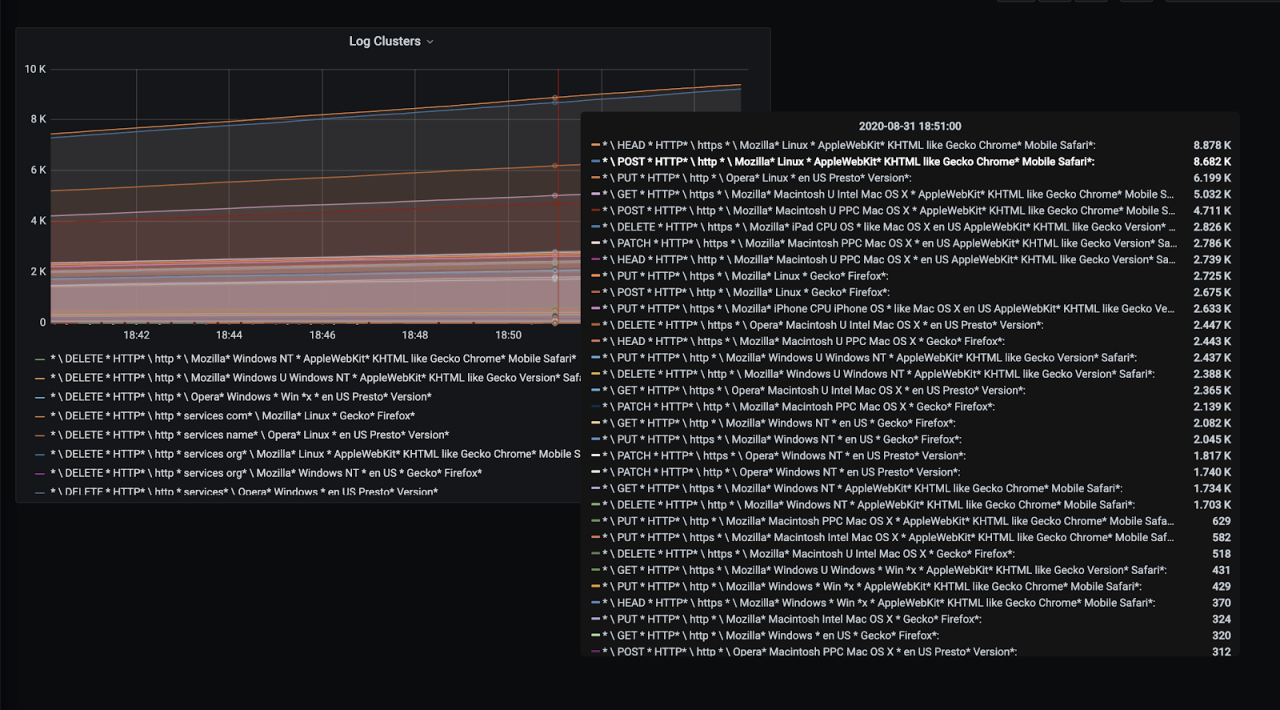
And we have our application logs clustered depending on its variance within the application context automatically. Since my log generating app generates web server access logs, logs are grouped according to request types, protocol(http or https) and coming user agents. You might see a very different distribution depending on your application.
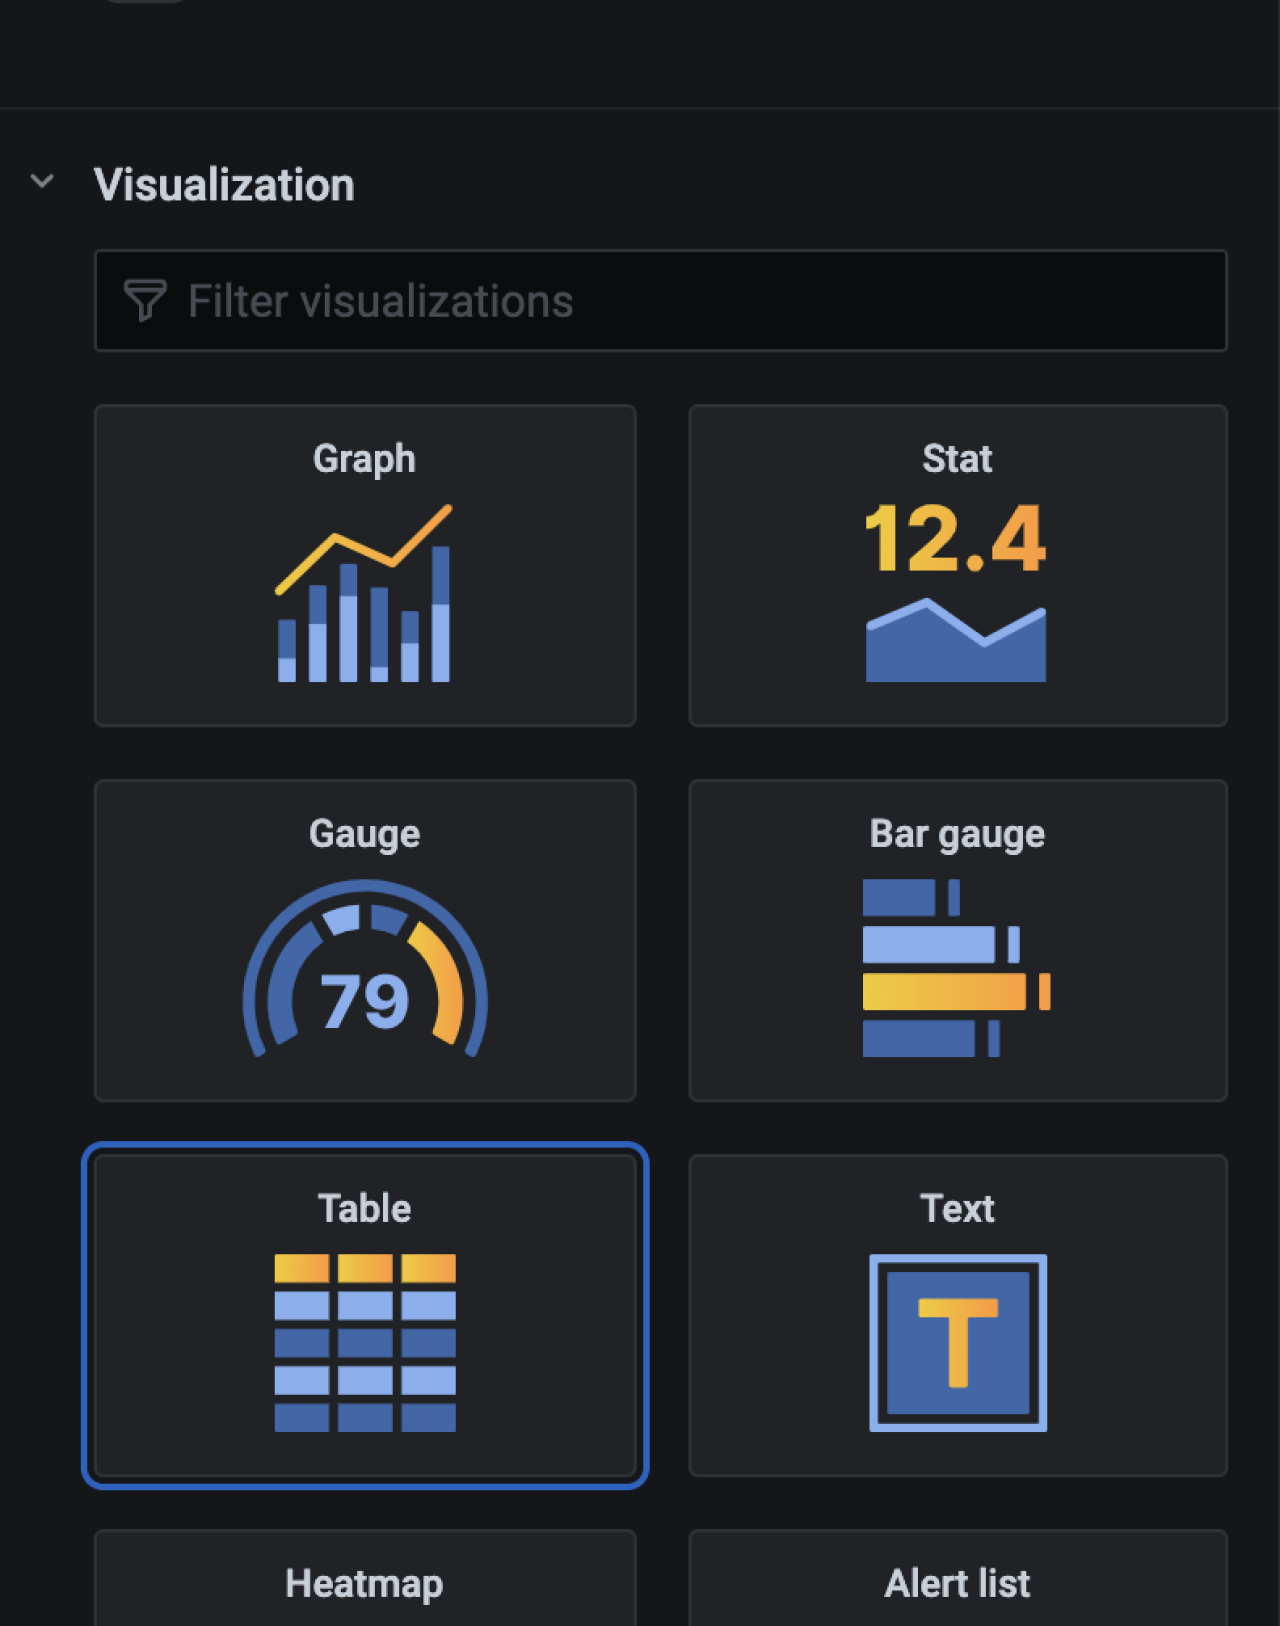
Instead of a graph you can also view cluster groupings as a table in Grafana. Click Add Panel disk icon again, paste the same query sum by (pattern) ({metricType=”cluster”}) and legend {{Pattern}}. This time select the Table visualization at the panel.
To get the cluster distribution table at latest reported instant, enable Instant toggle below the query and click Value table header to sort log patterns in decreasing order in table.
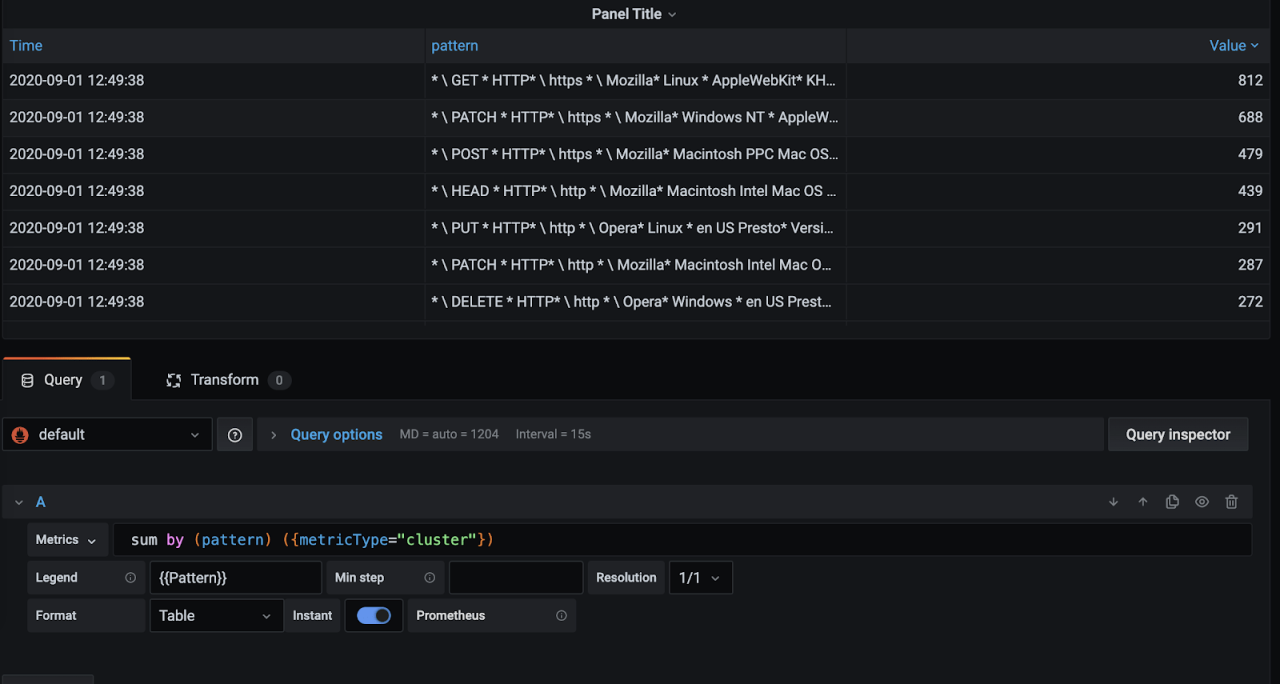
Click Apply.
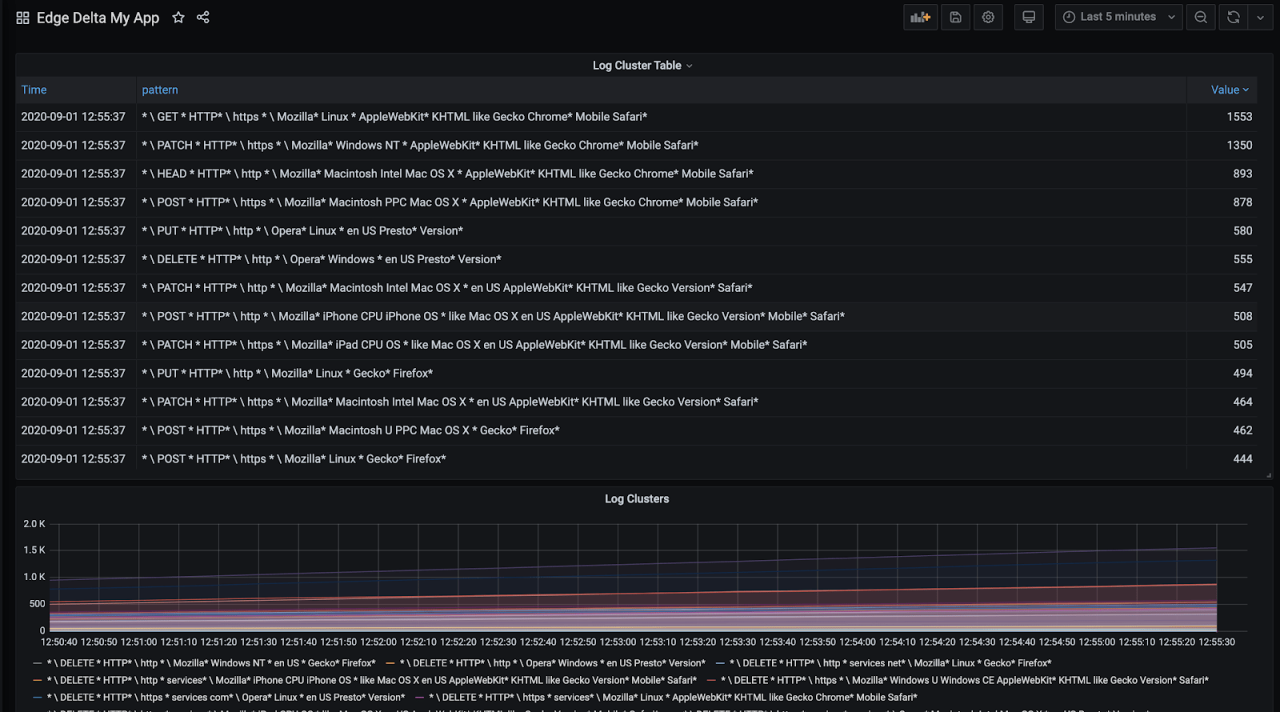
Now we have a table where we can see the grouped log patterns and easily check the most frequent or least frequent events easily. These are usually the most interesting ones to figure application behavior or identify an issue.
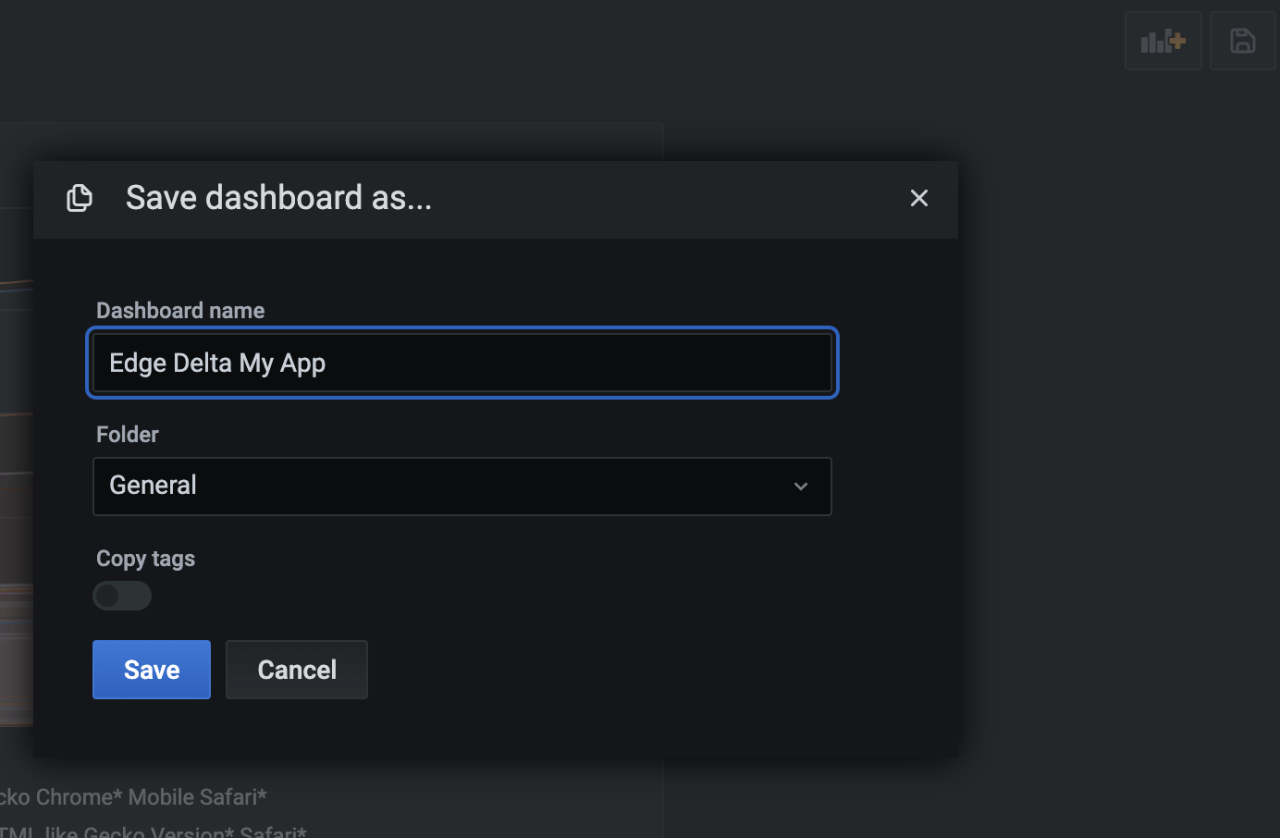
Click the disk icon at the top right to save the Dashboard so that you can refer it whenever you need.
Monitoring Errors
Cluster visualization is really helpful to have an idea but you might want to get actual metrics and detecting anomalies from your application.
Consider this demo application which generates lots of web access logs. I want to monitor the response code of request so that I can identify internal errors, or unauthorized access attempts. Here is a sample log from my demo application:
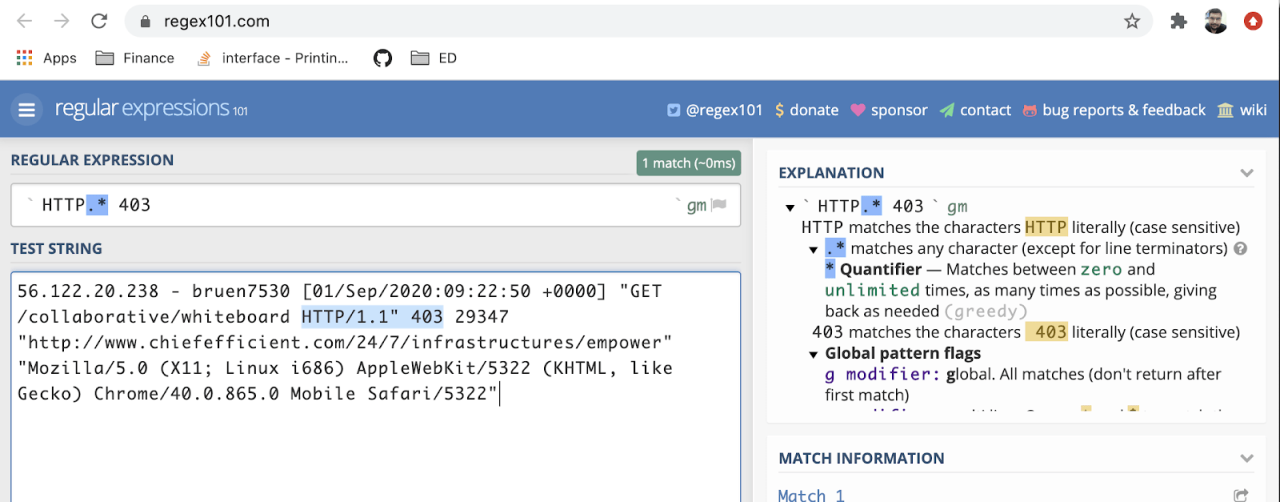
56.122.20.238 - bruen7530 [01/Sep/2020:09:22:50 +0000] "GET /collaborative/whiteboard HTTP/1.1" 403 29347 "http://www.chiefefficient.com/24/7/infrastructures/empower" "Mozilla/5.0 (X11; Linux i686) AppleWebKit/5322 (KHTML, like Gecko) Chrome/40.0.865.0 Mobile Safari/5322"Status codes are found between HTTP/..” and the next space.
Let’s match the status code via simple regexes below:
- Unauthorized: HTTP.* 403
- Internal Errors: HTTP.* 500
You can use https://regex101.com with your log sample to find the correct pattern. Select Golang to make sure you use the right dialect of regex.
Let’s update our config with this pattern by defining http-status regex processor and adding it to our workflow as below:
version: v2
agent_settings:
  tag: prometheus-k8s-demo
inputs:
 kubernetes:
   - labels: myapp
     include:
       - "namespace=myapp"
processors:
 cluster:
   name: clustering
   num_of_clusters: 50
   samples_per_cluster: 2
   reporting_frequency: 30s
 regexes:
   - name: auth-error
     pattern: HTTP.* 403
   - name: internal-error
     pattern: HTTP.* 500
workflows:
  myapp-wf:
    input_labels:
      - myapp
    processors:
      - clustering
      - auth-error
      - internal-error
To update the configuration you need to open your config in Configurations, and click the edit button with pencil icon.

Paste the config and click save
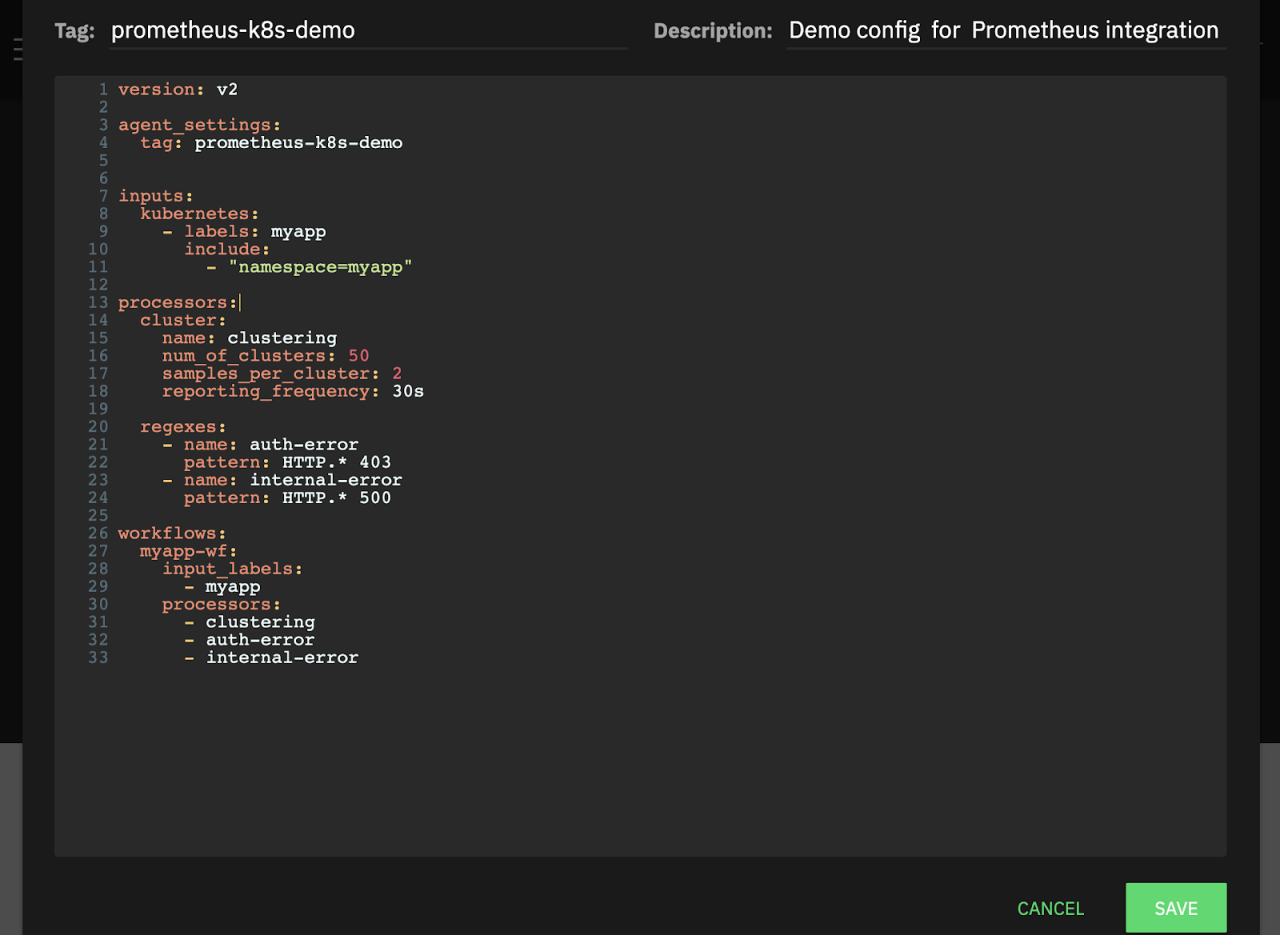
After waiting a few seconds for the agent to fetch the new configuration and start collecting metrics we can add our new metrics to Grafana.
For authentication failures we will monitor rate of change with Prometheus query:
sum(irate(auth_error_count[30s]))
For internal errors we will use query Prometheus query:
sum(irate(internal_error_count[30s]))
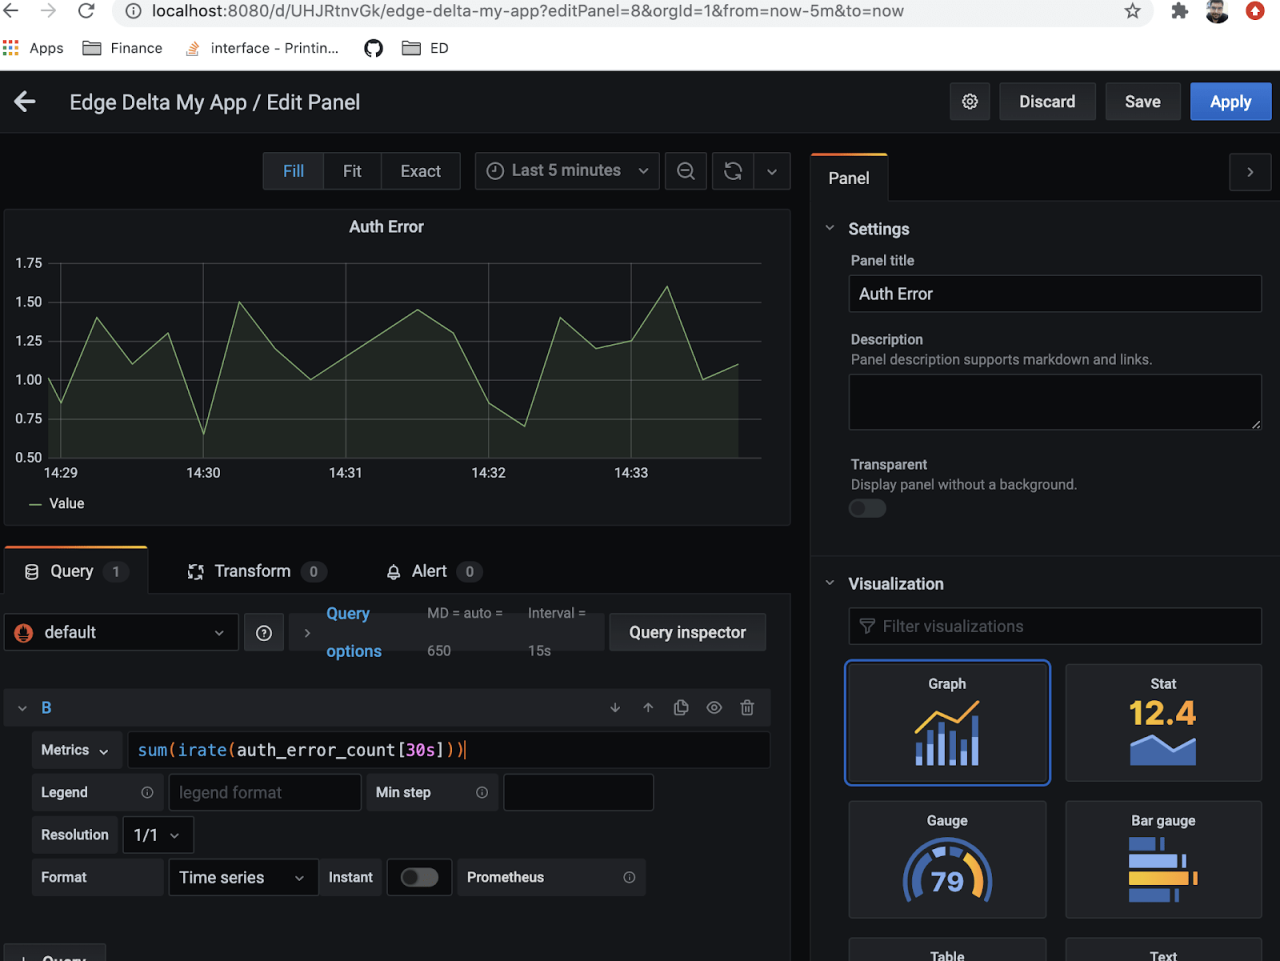
Here is the dashboard board with new metrics.
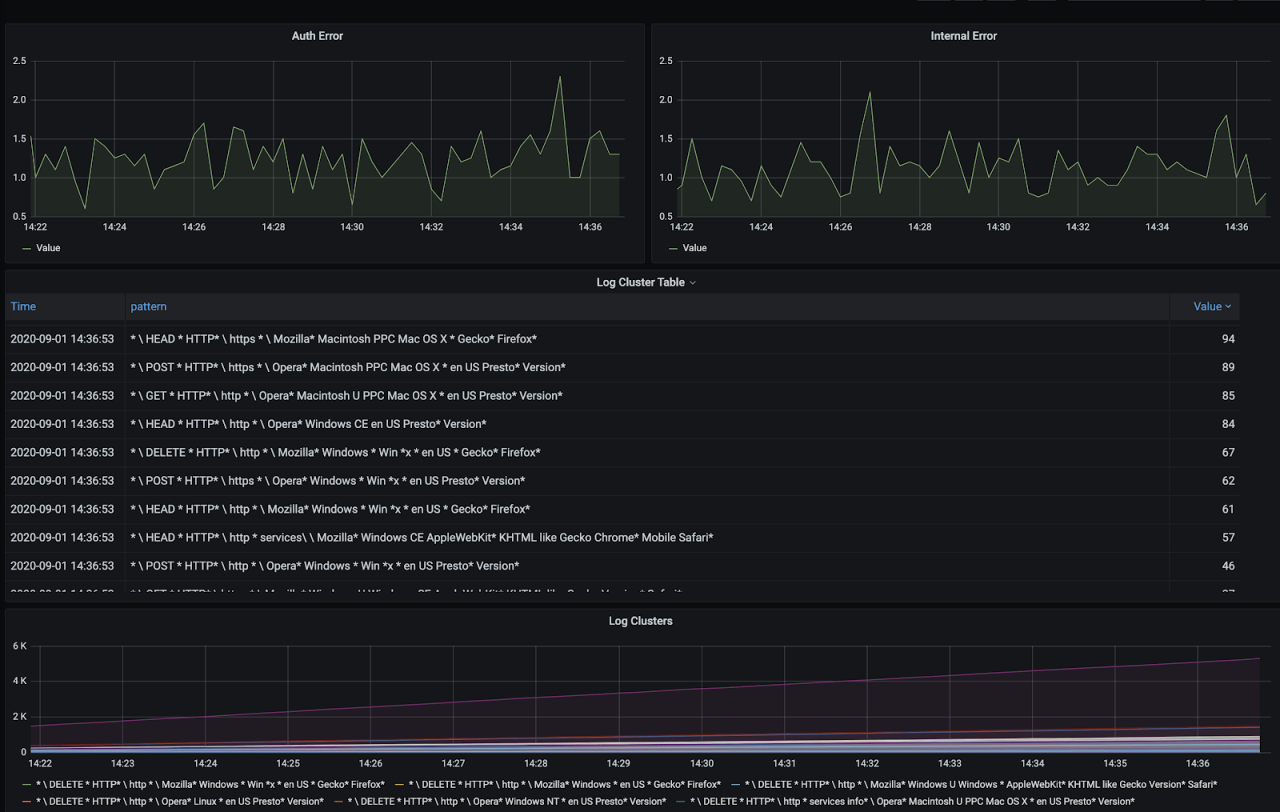
Instead of trying to figure out trends in changes manually you can simply replace query with auth_error_anomaly1 and internal_error_anomaly1 to monitor the anomaly scores automatically generated by Edge Delta agent.
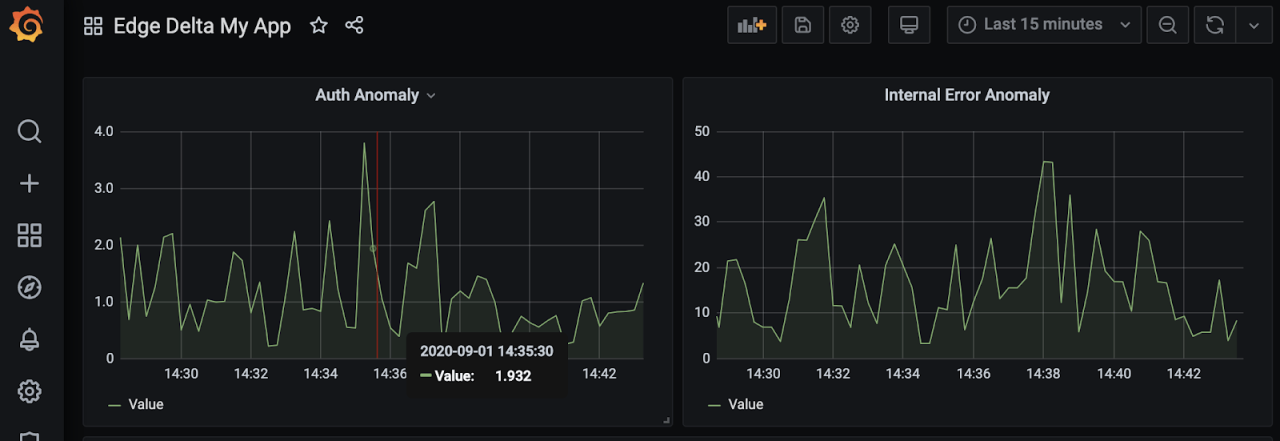
In addition to this Grafana Dashboard we can check anomalies in Edge Delta Dashboard:
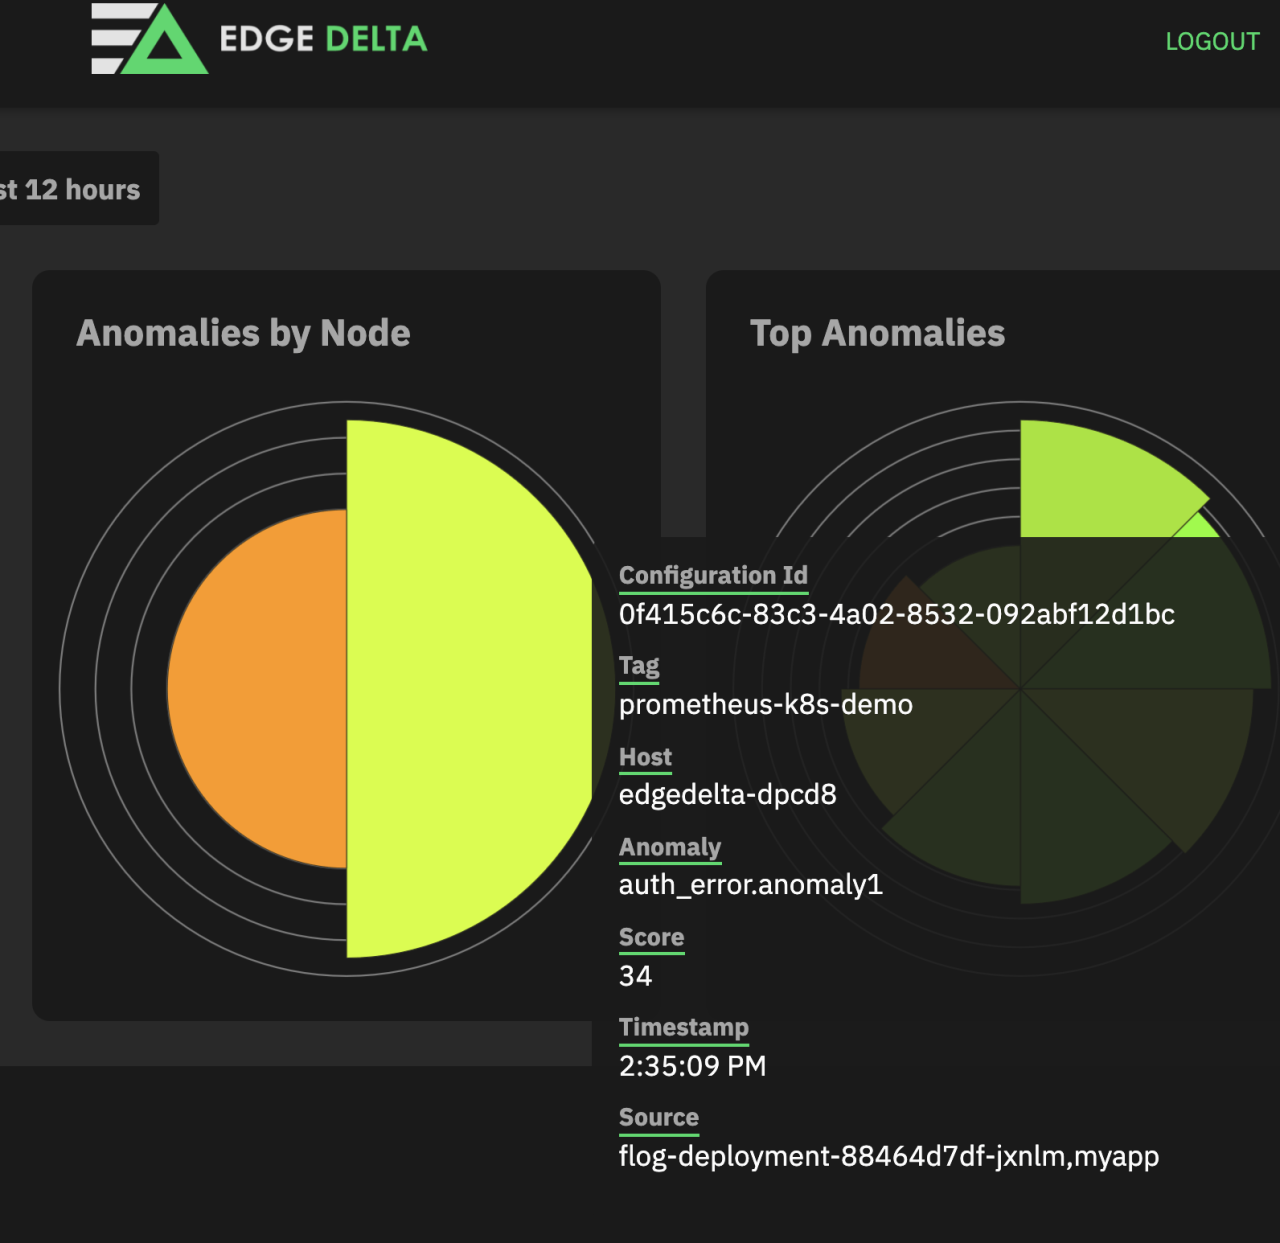
We have successfully achieved a high level of visibility about our cluster health and resources, general state of our applications, and specific metrics that can be collected from application logs!
Although this was just scratching the surface, Edge Delta has lots of options and configurations for different use cases. My next blog post is going to delve deeper into the more of the Edge Delta functionality, stay tuned!
If you don’t want to wait – you can submit a support request or contact the team for additional scenarios like configuring alerts and getting anomaly contexts, tracing transactional operations, endpoint security anomaly detection and more.
References:
Prometheus Aggregation Operators


