The Prometheus Operator Helm chart provides a very nice monitoring tool set to monitor your cluster without any configuration. It includes Prometheus (the open source widely used metrics and alerting server) and Grafana (front end for visualizing the monitored components in dashboards). It provides readily available dashboards where you can monitor your cluster health, pods, nodes and Kubernetes workloads, right out of the box.
In this post (Part 1/2), we will deploy the Prometheus Operator and start monitoring our cluster (If you want to skip ahead to the Edge Delta deployment, see part 2/2 here.
Prerequisites
You need to have a working accessible Kubernetes cluster. Also kubectl and helm commands should be available on your machine:
Installation
Prometheus Operator uses custom resource definitions (CRD) for Prometheus configuration and service discovery. Due to a minor issue in current version, first install CRD manifests manually:
Run Command:
kubectl apply -f https://raw.githubusercontent.com/coreos/prometheus-operator/release-0.38/example/prometheus-operator-crd/monitoring.coreos.com_alertmanagers.yaml
kubectl apply -f https://raw.githubusercontent.com/coreos/prometheus-operator/release-0.38/example/prometheus-operator-crd/monitoring.coreos.com_podmonitors.yaml
kubectl apply -f https://raw.githubusercontent.com/coreos/prometheus-operator/release-0.38/example/prometheus-operator-crd/monitoring.coreos.com_prometheuses.yaml
kubectl apply -f https://raw.githubusercontent.com/coreos/prometheus-operator/release-0.38/example/prometheus-operator-crd/monitoring.coreos.com_prometheusrules.yaml
kubectl apply -f https://raw.githubusercontent.com/coreos/prometheus-operator/release-0.38/example/prometheus-operator-crd/monitoring.coreos.com_servicemonitors.yaml
kubectl apply -f https://raw.githubusercontent.com/coreos/prometheus-operator/release-0.38/example/prometheus-operator-crd/monitoring.coreos.com_thanosrulers.yaml
Expected Output:
customresourcedefinition.apiextensions.k8s.io/alertmanagers.monitoring.coreos.com created
customresourcedefinition.apiextensions.k8s.io/podmonitors.monitoring.coreos.com created
customresourcedefinition.apiextensions.k8s.io/prometheuses.monitoring.coreos.com created
customresourcedefinition.apiextensions.k8s.io/prometheusrules.monitoring.coreos.com created
customresourcedefinition.apiextensions.k8s.io/servicemonitors.monitoring.coreos.com created
customresourcedefinition.apiextensions.k8s.io/thanosrulers.monitoring.coreos.com created
The default helm installation does not provide any persistency. Without it metric retention will be short, metrics and configured dashboards will be gone after a pod restart, which makes this monitoring system hardly usable. Below helm values.yml file content provides 10 GiB storage for Prometheus and 10 GiB storage(default size) for Grafana:
prometheus:
  server:
    persistentVolume:
      enabled: true
  prometheusSpec:
    storageSpec:
      volumeClaimTemplate:
        spec:
          accessModes: ["ReadWriteOnce"]
          resources:
            requests:
              storage: 10Gi
  retentionSize: "10GiB"
grafana:
  persistence:
    enabled: true
Save this file as values.yml to use in the following command to install the chart. We will use “monitoring” namespace and Prometheus Operator release name will be “promop”. Installation might take a while:
Run Command:
helm install -f values.yml promop stable/prometheus-operator -n monitoring --create-namespaceExpected Output:
manifest_sorter.go:192: info: skipping unknown hook: "crd-install"
manifest_sorter.go:192: info: skipping unknown hook: "crd-install"
manifest_sorter.go:192: info: skipping unknown hook: "crd-install"
manifest_sorter.go:192: info: skipping unknown hook: "crd-install"
manifest_sorter.go:192: info: skipping unknown hook: "crd-install"
manifest_sorter.go:192: info: skipping unknown hook: "crd-install"
NAME: promop
LAST DEPLOYED: Fri Aug 28 19:49:30 2020
NAMESPACE: monitoring
STATUS: deployed
REVISION: 1
NOTES:
The Prometheus Operator has been installed. Check its status by running:
  kubectl --namespace monitoring get pods -l "release=promop"
Visit https://github.com/coreos/prometheus-operator for instructions on how
to create & configure Alertmanager and Prometheus instances using the Operator.Monitoring
Installation completed, now we need to access our Grafana dashboard to start monitoring our cluster. The easiest and most secure way to deploy is via Port Forwarding. First let’s find out the Grafana service name in the monitoring namespace:
Run Command:
kubectl get svc -n monitoringExpected Output:
NAME                                      TYPE        CLUSTER-IP       EXTERNAL-IP   PORT(S)                      AGE
alertmanager-operated                     ClusterIP   None                     9093/TCP,9094/TCP,9094/UDP   7m37s
prometheus-operated                       ClusterIP   None                     9090/TCP                     7m27s
promop-grafana                            ClusterIP   172.20.200.40            80/TCP                       7m45s
promop-kube-state-metrics                 ClusterIP   172.20.225.32            8080/TCP                     7m45s
promop-prometheus-node-exporter           ClusterIP   172.20.163.170           9100/TCP                     7m45s
promop-prometheus-operator-alertmanager   ClusterIP   172.20.202.41            9093/TCP                     7m45s
promop-prometheus-operator-operator       ClusterIP   172.20.116.63            8080/TCP,443/TCP             7m45s
promop-prometheus-operator-prometheus     ClusterIP   172.20.132.97            9090/TCP                     7m45s
The Grafana service is called promop-grafana and listening on port 80. Lets forward it so that we can access via browser locally:
Run Command:
kubectl port-forward svc/promop-grafana 8080:80 -n monitoringExpected Output:
Forwarding from 127.0.0.1:8080 -> 3000
Forwarding from [::1]:8080 -> 3000
Open your browser https://edgedelta.com/
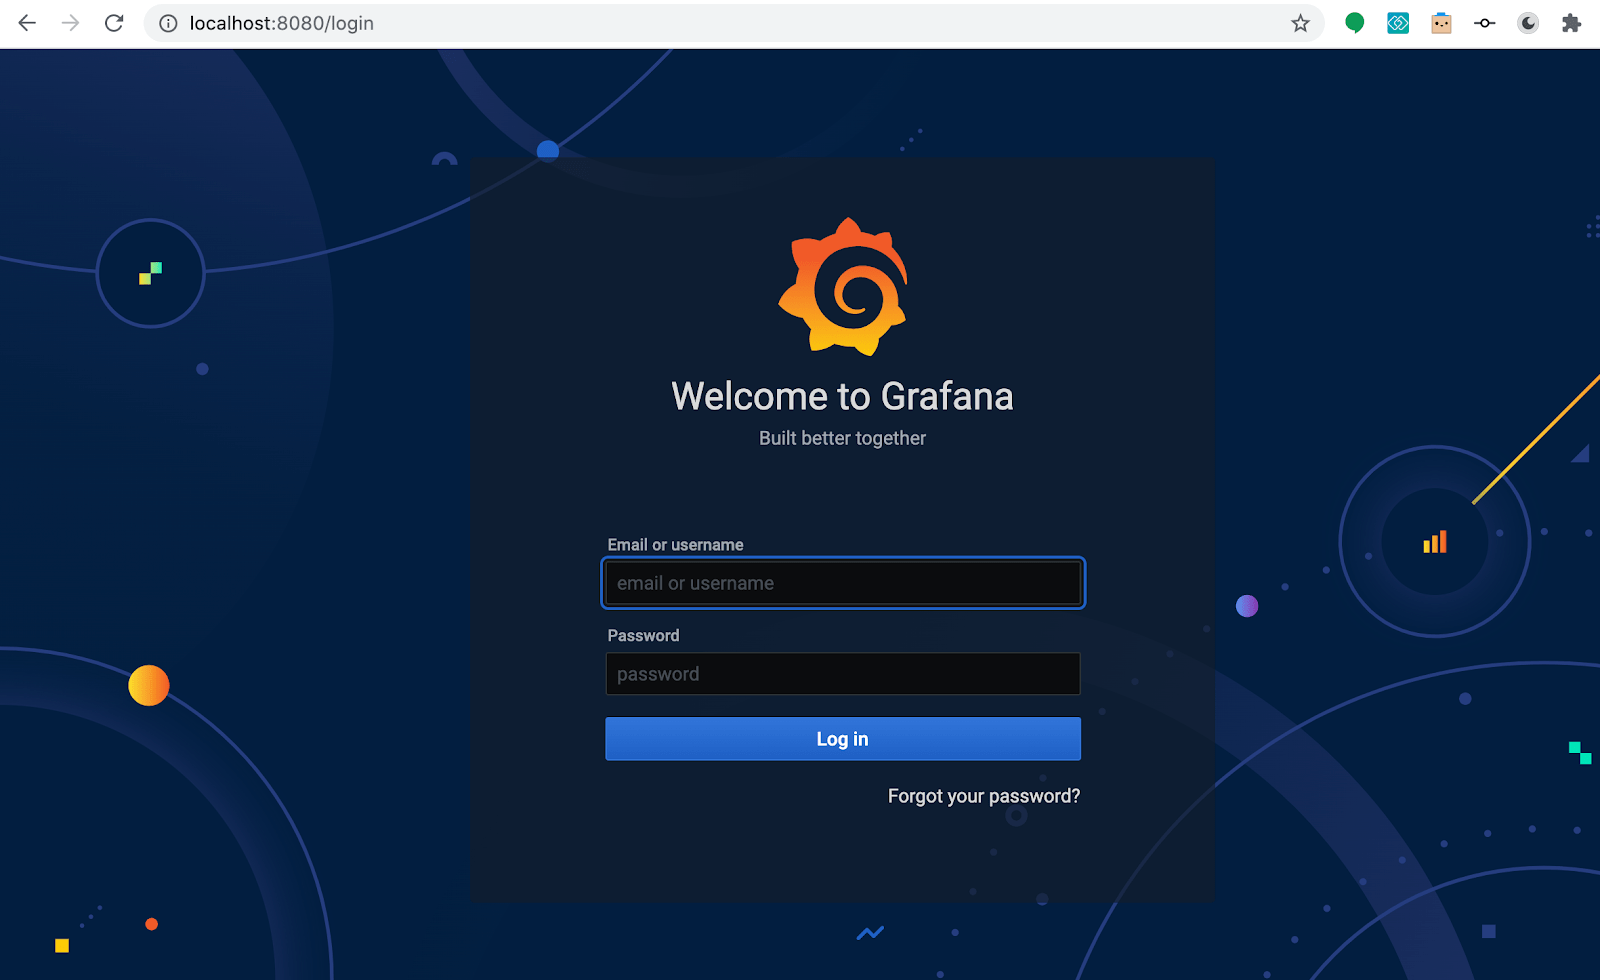
Default grafana username is admin and password is prom-operator.
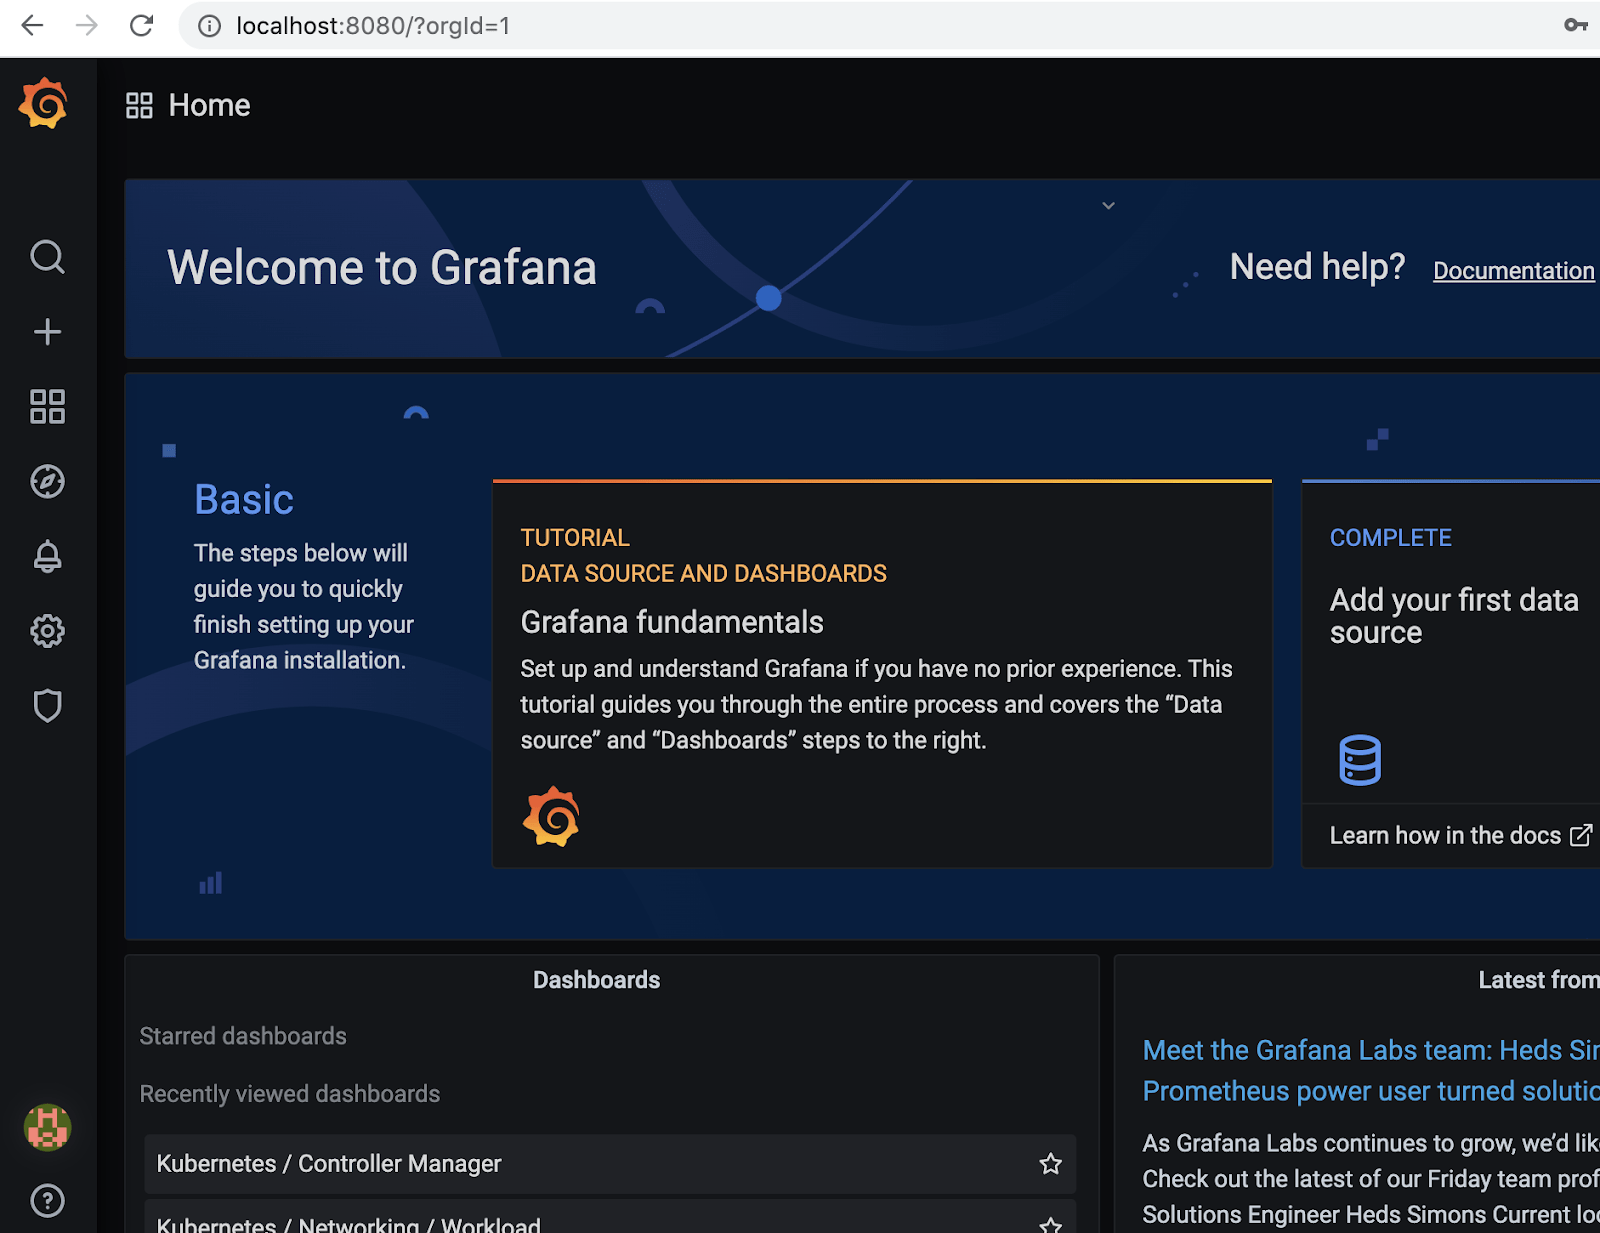
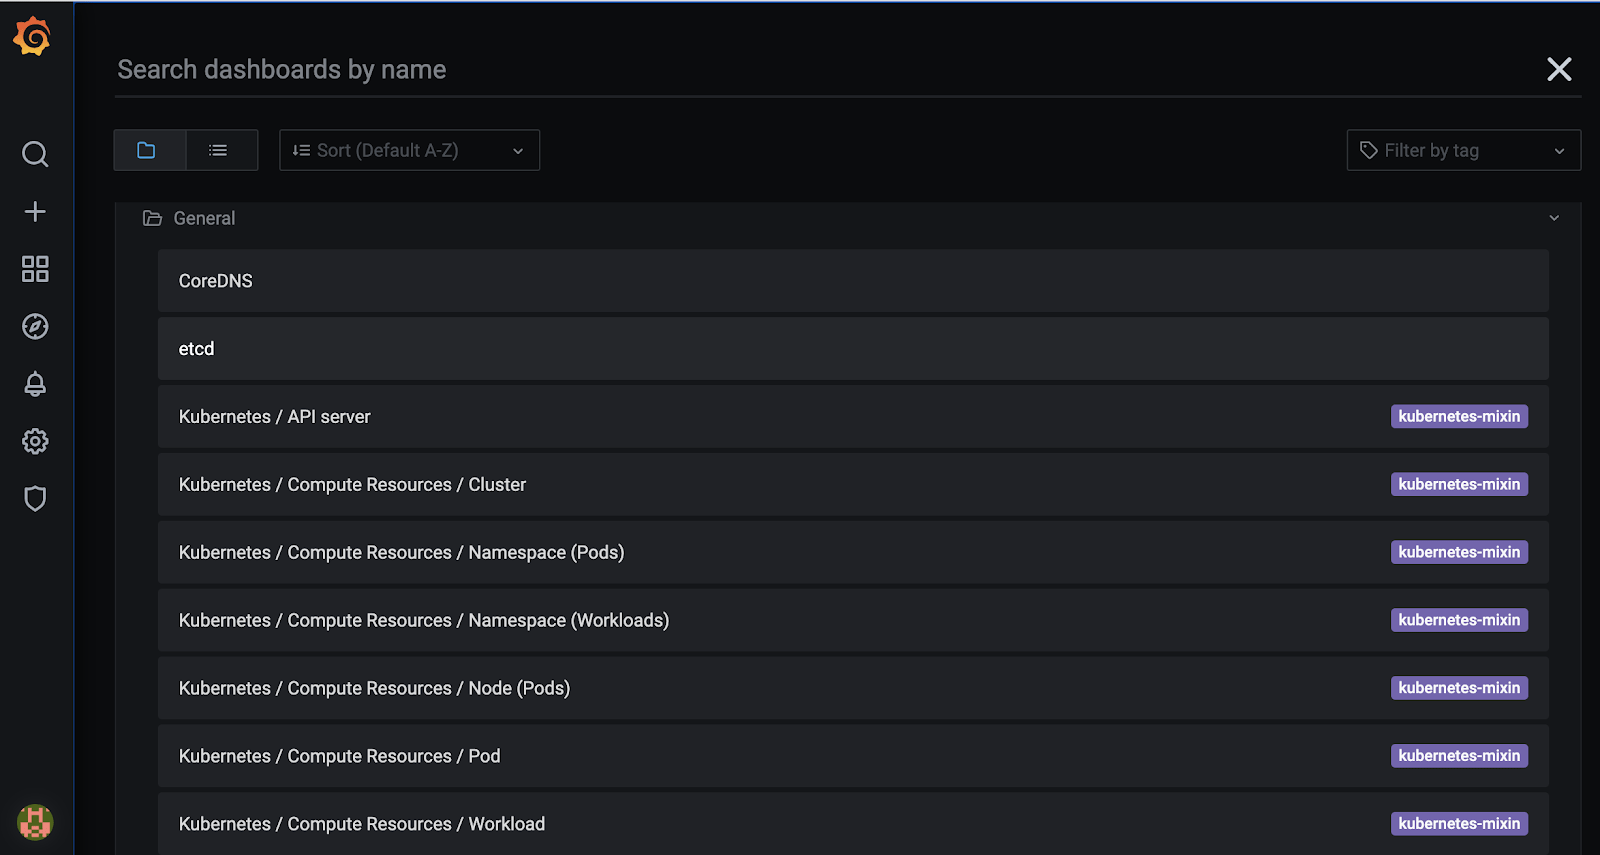
Clicking the magnifier icon opens the dashboard search screen where you can find ready made dashboards to monitor different Kubernetes resources:
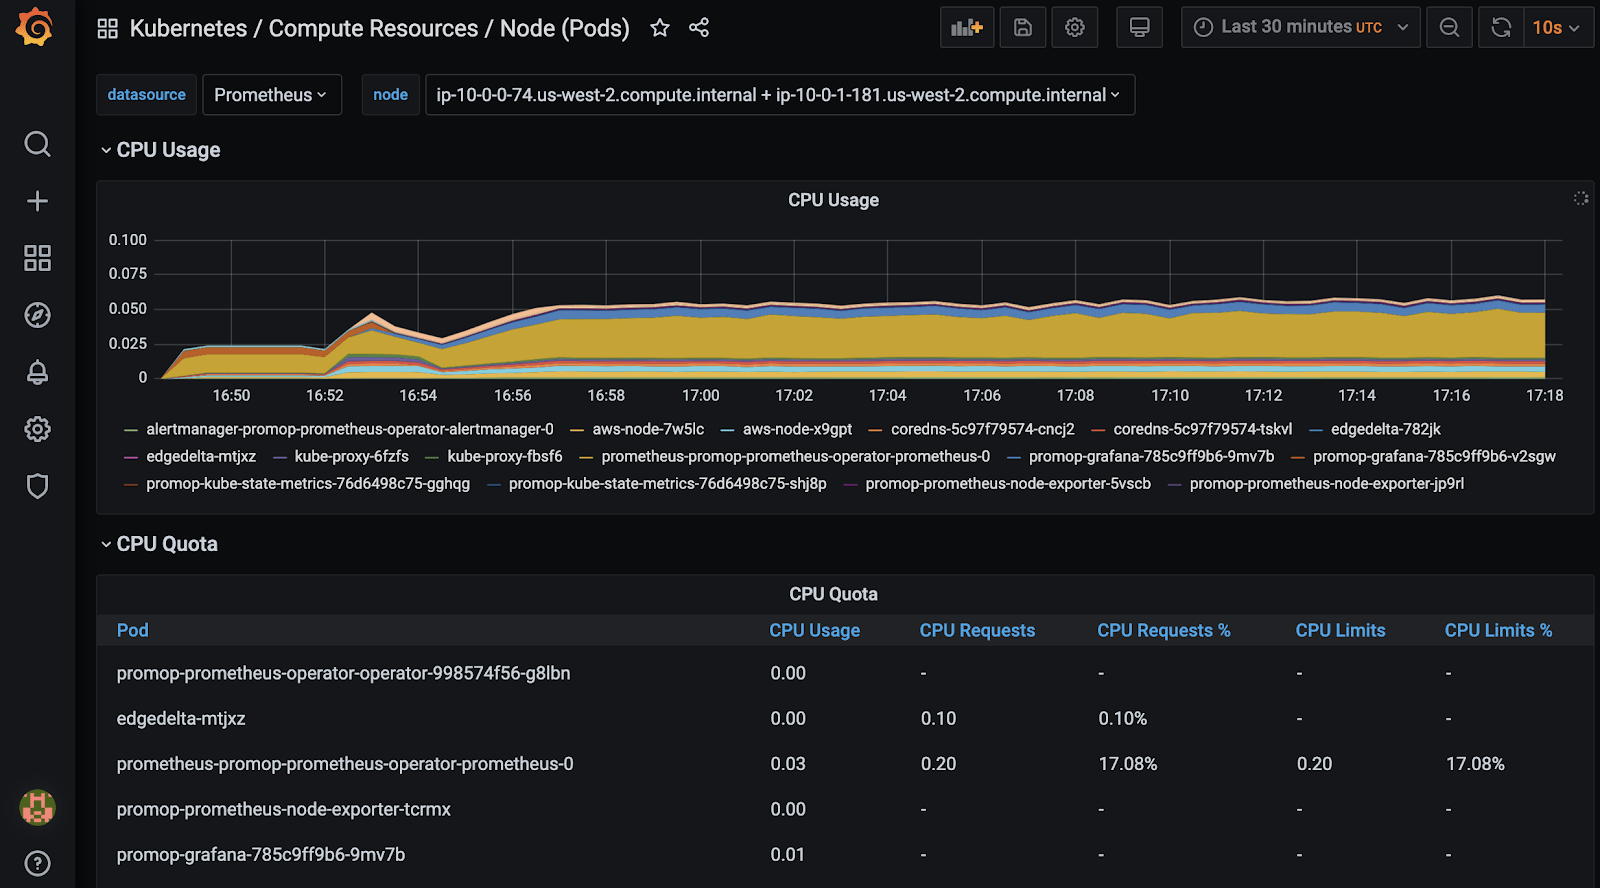
Let’s check the pod resource usage in node view:
This dashboard shows pod CPU and memory usage:
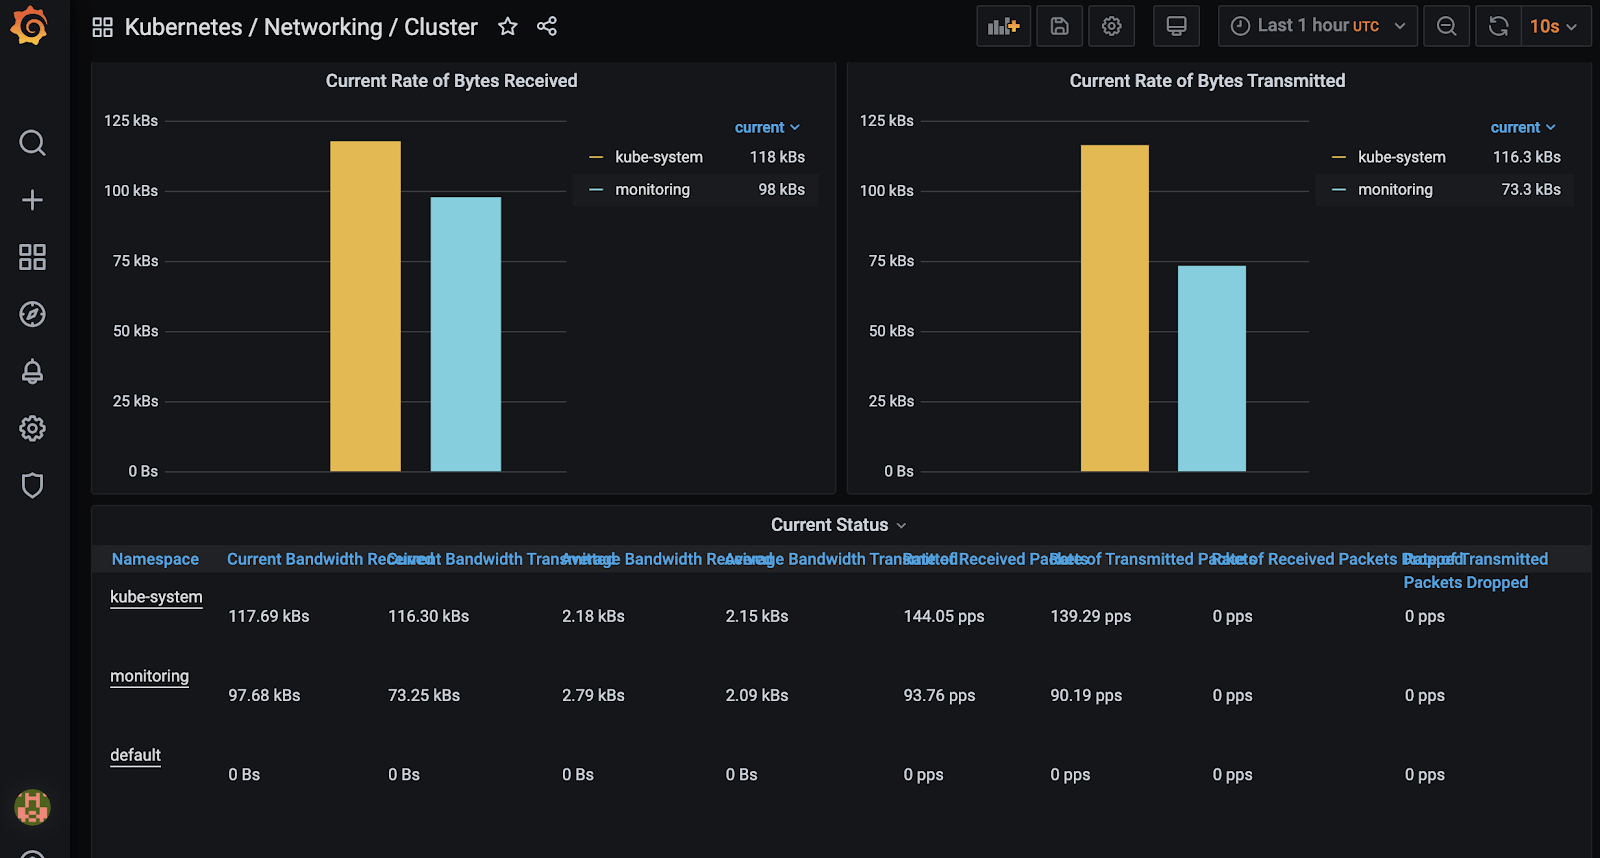
Another view to monitor incoming and outgoing traffic by namespaces:
Node resource usage:
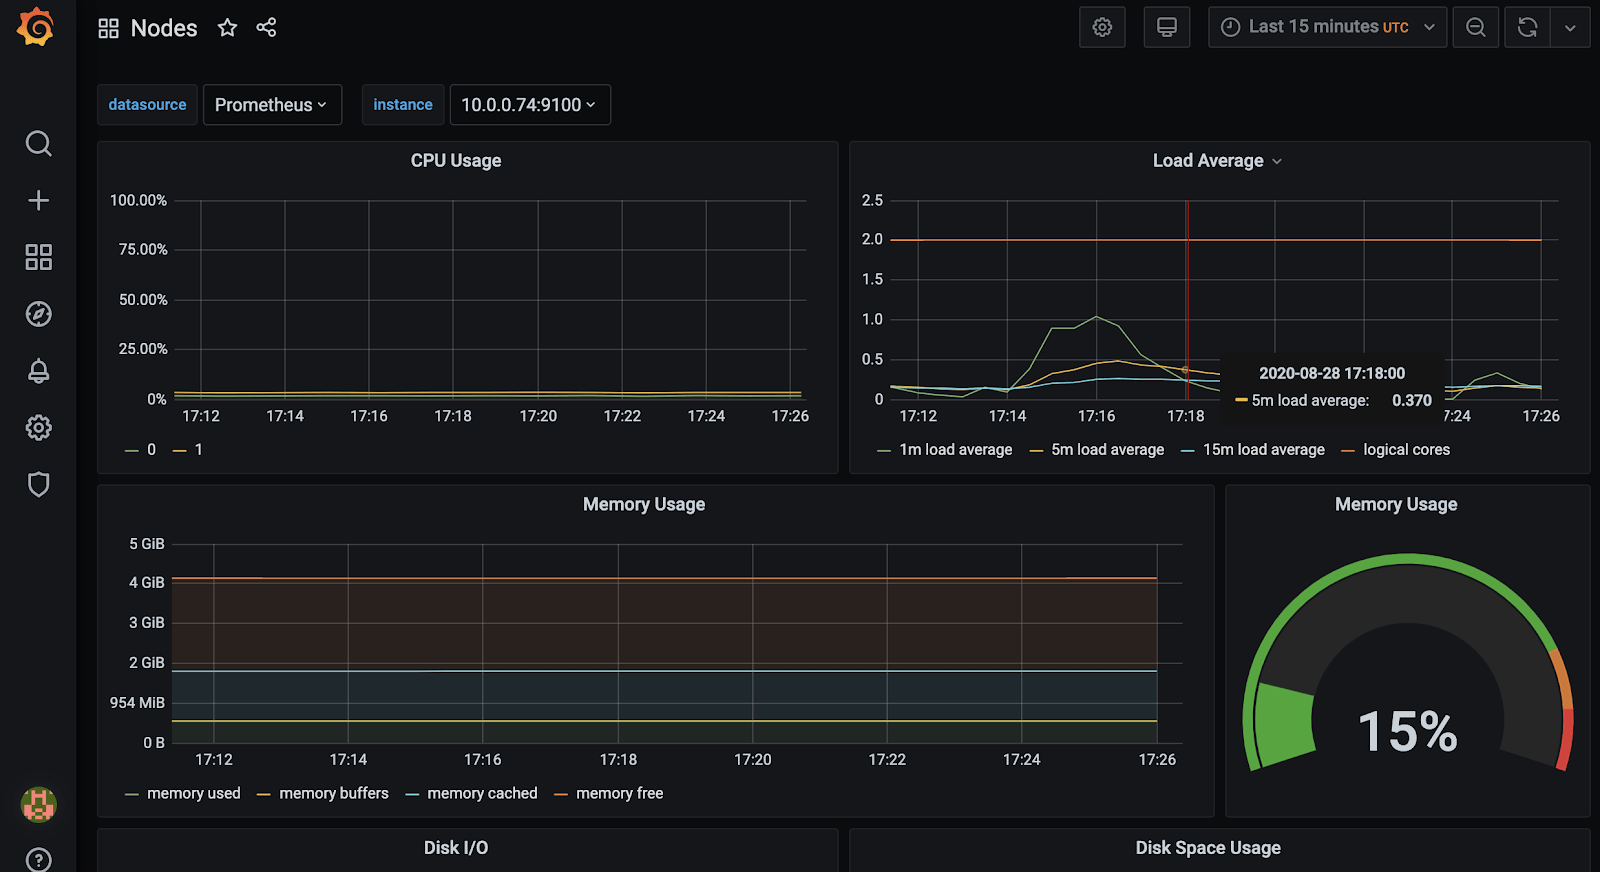
You can also monitor Kubernetes resource usage by services, namespaces, check metrics of kubernetes api server, etcd and other internal components.
So far we have achieved very good visibility into our cluster health and resource usage. However cluster health and resource usage is only a part of the puzzle. We have not monitored any actual applications deployed on our cluster that are connected to the business value created by organizations.
If you have noticed – there seems to be no easy way to see actual application metrics. You would need to implement a custom prometheus exporter in your application which is not an easy task. Even if you had the time and resources for the development efforts, you probably want to keep your service simple, dependency free and focus on performance. In some cases it might be impossible; for instance it could be a legacy service moved to the cloud, or you might not have access to source code. Finally, there is no application context when the issue happens unless you collect all logs and centralize them using a solution like elasticsearch and fluentd – these require some commitment.
To address these gaps and have insight into your application metrics – see Part 2 of this series which uses a simple configuration to deploy the Edge Delta agents into the mix, achieving full visibility into our cluster and services.


