


Content Delivery Network (CDN) log data and media player analytics data have traditionally operated in separate realms, making it challenging for video-on-demand platforms to trace and fix delivery issues. The Common Media Client Data (CMCD) standard helps bridge this gap, providing greater visibility and enabling quicker issue resolution. By combining client-side data with server-side metrics from a CDN, the resulting CMCD metrics — spanning areas such as buffer starvation, bitrate, throughput, and more — help media companies personalize content recommendations, improve advertising effectiveness, and ultimately deliver a better user experience.
However, managing and normalizing CMCD across different sources can be complex, as cloud services vary in how they deliver logs. For instance, some sources might send logs individually, while others ship them in bulk, which can lead to issues in data availability. And while CMCD-specific log data is typically collected in the JSON format, different sources may structure or encode it differently, making it difficult to standardize and extract metrics.
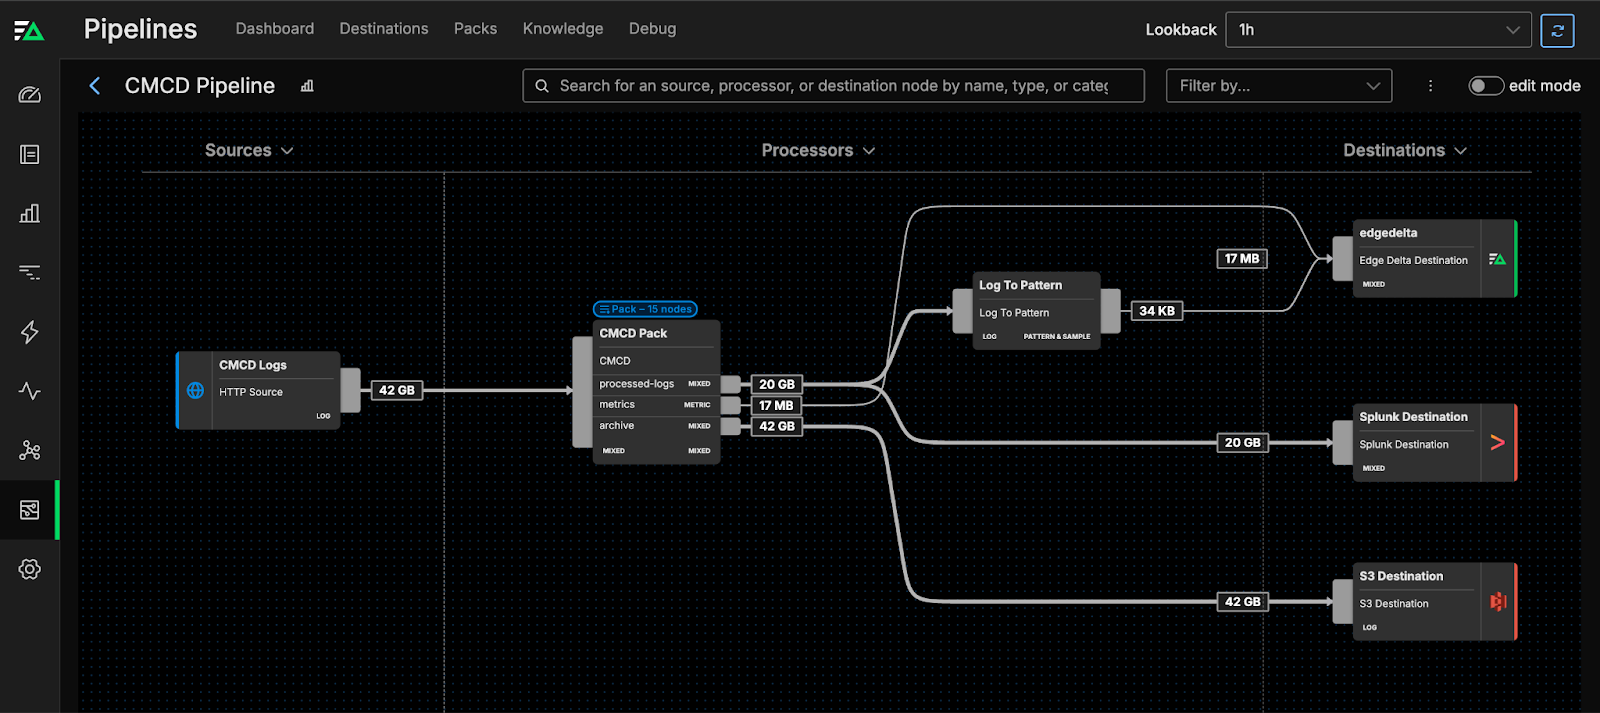
Edge Delta’s Pipeline Packs are pre-built collections of processing steps optimized specifically for popular telemetry data types and formats, including CMCD. With Edge Delta’s CMCD Pipeline Pack, log data is automatically standardized and processed as it travels through Telemetry Pipelines. The pack also extracts key metrics based on CMCD parameters, which power downstream analysis and dashboard visualizations.
In this article, we’ll explain how Edge Delta’s CMCD Pack works and outline steps for setting it up in your pipelines.
How the CMCD Pack Works
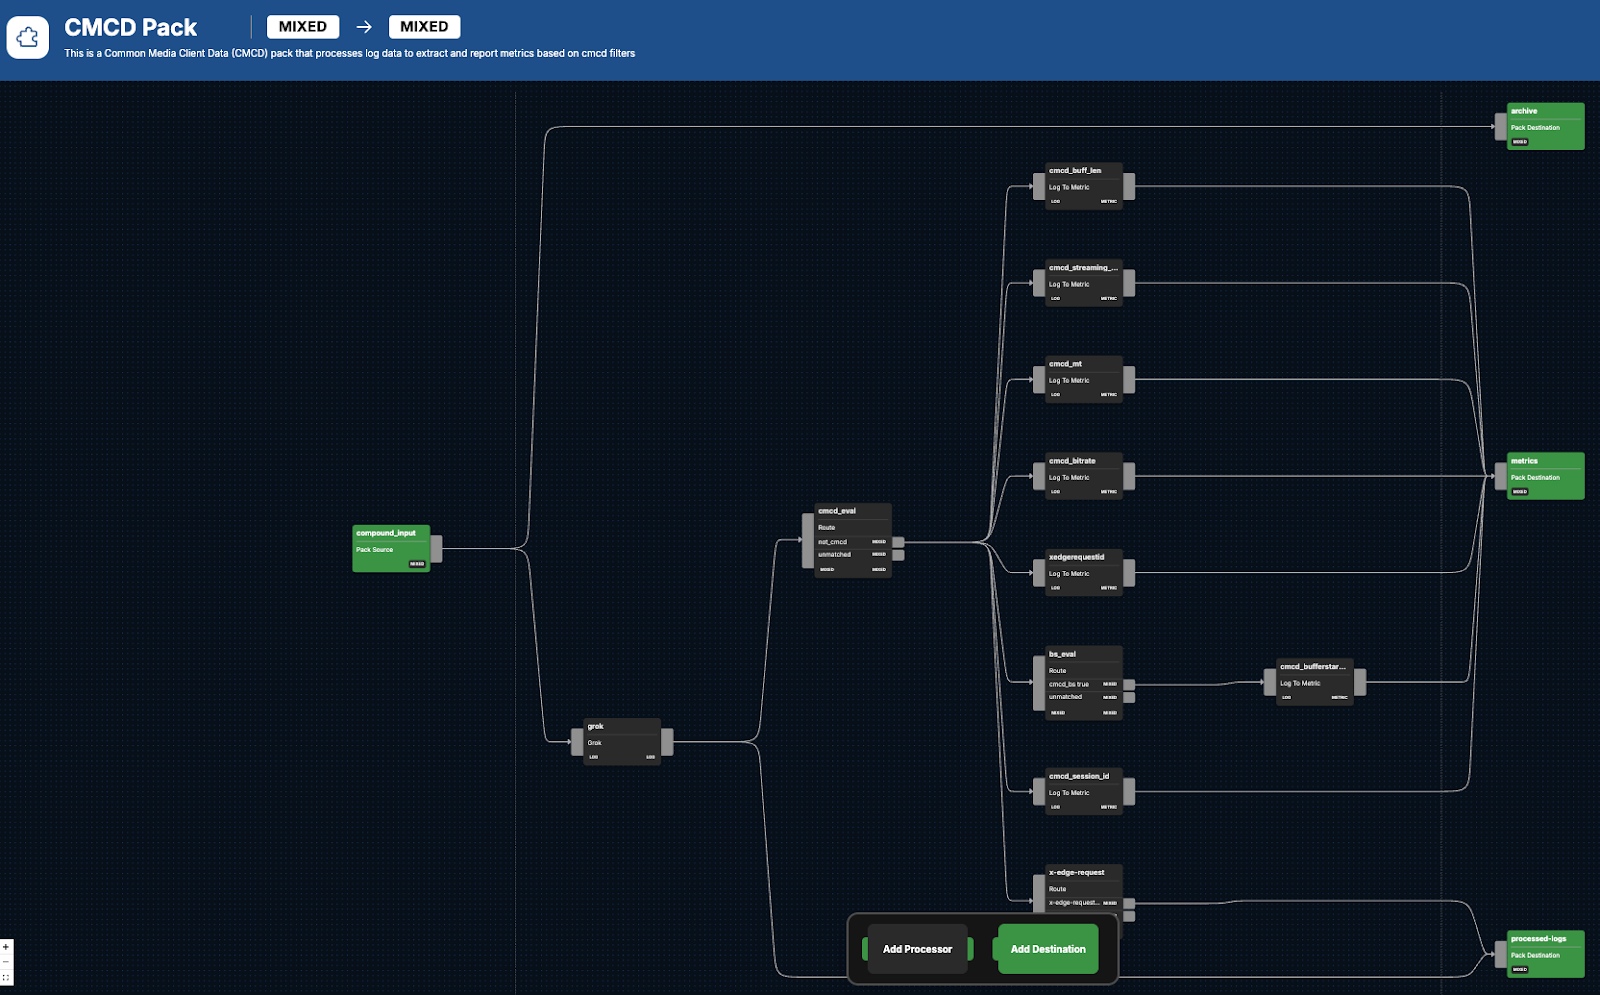
The pack begins by leveraging a Grok pattern to convert unstructured CMCD from various sources into a standardized, structured format. Multiple copies of the formatted logs are then created and sent further down the pipeline to extract metric and pattern information.
Take the following CMCD log, in its original format, as an example:
t=1612873423, v=2.1, c=WEB, br=1500, bs=10000, p=START, b=0.0, dl=0.1, url=https://example.com/video.mp4, rt=4.5, sd=1.0, cdn=akamai, dev=iphone, res=1920x1080, srv=us-east, rtcp=15, fm=mp4, lid=12345, psize=2000, pr=HDAnd here’s what the CMCD log looks like after being reformatted by our CMCD Pack:
{
  "timestamp": 1612873423,
  "version": "2.1",
  "client_type": "WEB",
  "bitrate": 1500,
  "buffer_size": 10000,
  "playback_state": "START",
  "buffer_health": 0.0,
  "download_speed": 0.1,
  "video_url": "https://example.com/video.mp4",
  "round_trip_time": 4.5,
  "stream_depth": 1.0,
  "cdn": "akamai",
  "device": "iphone",
  "resolution": "1920x1080",
  "server_location": "us-east",
  "rtcp": 15,
  "format": "mp4",
  "session_id": 12345,
  "packet_size": 2000,
  "video_quality": "HD"
}
With important fields normalized in a structured format, and a variety of metrics generated from the logs, downstream queries, monitoring, dashboarding, and additional analysis become easier and more effective. Throughout the process, any unnecessary log information gets routed to the unmatched path and eventually dropped. However, a full copy of the raw logs can be found in the archive output.
Let’s take a closer look at the processing steps that enable these transformations.
Processing Pathway: CMCD Evaluation
Next, logs move into the {cmcd_eval} node, which analyzes and filters your CMCD logs. Any logs lacking necessary CMCD session tracking information are then diverted to an alternate routing path. Meanwhile, the remaining logs continue on the journey.
Processing Pathway: Session ID Metrics
The cmcd_session_id node generates metrics, such as the number of logs for each unique session ID. These session-related metrics can provide important insight into user engagement in a streaming environment.
- name: cmcd_session_id
 type: log_to_metric
 pattern: .*
 interval: 1m0s
 skip_empty_intervals: false
 only_report_nonzeros: false
 metric_name: cmcd_session_id
 dimension_groups:
 - field_dimensions:
 - item["attributes"]["cmcd-session-id"]
Processing Pathway: Buffer Starvation Evaluation and Metrics
In the bs_eval node, logs with buffer starvation are identified, which helps diagnose issues related to media delivery. Logs that don’t fit this identifier move to the default unmatched route.
  - name: bs_eval
    type: route
    paths:
      - path: cmcd_bs true
        condition: item["attributes"]["cmcd-buffer-starvation"]==1
        exit_if_matched: false
Logs that do contain buffer starvation head into the cmcd_bufferstarvation node, which detects buffer starvation events and assists in uncovering deterioration patterns in the user experience, which is a critical component of predictive maintenance.
  - name: cmcd_bufferstarvation
    type: log_to_metric
    pattern: .*
    interval: 1m0s
    skip_empty_intervals: false
    only_report_nonzeros: false
    metric_name: cmcd_buffer_starvation
    enabled_stats:
      - count
Processing Pathway: Bitrate Metrics
The next stop is the cmcd_bitrate node, which generates metrics for bitrate encoding. Tracking metrics like the average, minimum, and maximum encoded bitrate correlates to quality of service analysis when determining whether streams are being delivered efficiently.
 - name: cmcd_bitrate
    type: log_to_metric
    pattern: .*
    interval: 1m0s
    skip_empty_intervals: false
    only_report_nonzeros: false
    metric_name: cmcd_enc_bitrate
    enabled_stats:
      - avg
      - max
      - min
    dimension_groups:
      - field_numeric_dimension: item["attributes"]["cmcd-encoded-bitrate"]
Processing Pathway: Detailed Request Evaluation
At the x-edge-request node, logs are evaluated on whether or not an x-edge-requst-id is present. Filtering by request ID assists with isolating log information that corresponds to specific content delivery requests. In this case, if an x-edge-requst-id is found, those logs continue on for further processing, while the remaining logs are dropped. However, a full copy of the raw logs can be found in the archive output.
  - name: x-edge-request
    type: route
    paths:
      - path: x-edge-request_true
        condition: item["attributes"]["x-edge-request-id"] != "-"
        exit_if_matched: false
Processing Pathway: Measured Throughput Metrics
To track metrics for CMCD measured throughput — which help quantify the rate at which streaming content is delivered — logs pass through the cmcd_mt node. With these metrics, organizations can better plan for capacity and network optimizations.
 - name: cmcd_mt
    type: log_to_metric
    pattern: .*
    interval: 1m0s
    skip_empty_intervals: false
    only_report_nonzeros: false
    metric_name: cmcd-mt
    enabled_stats:
      - avg
      - min
      - max
    dimension_groups:
      - field_numeric_dimension: item["attributes"]["cmcd-measured-throughput"]
Processing Pathway: Streaming Format Evaluation
The next stop is the sf_eval node, which determines whether or not streaming format details exist within the logs. Streaming format details can help with identifying discrepancies and troubleshooting content playback issues. Logs that don’t have these qualities move to the unmatched route path.
- name: sf_eval
    type: route
    paths:
      - path: streaming_format_eval
        condition: item["attributes"]["cmcd-streaming-format"]=="-"
        exit_if_matched: true
Processing Pathway: Streaming Format Plays Metrics
Video formats can include MP4, MOV, WebM, and more. Tracking streaming plays by format makes it easier to understand user preferences and helps inform overall media strategy.
To assist, logs are processed by the cmcd_streaming_format_plays node, which monitors the amount of plays performed by each streaming format and session ID.
- name: cmcd_streaming_format_plays
    type: log_to_metric
    pattern: .*
    interval: 1m0s
    skip_empty_intervals: false
    only_report_nonzeros: false
    metric_name: cmcd_streaming_format_plays
    enabled_stats:
      - count
    dimension_groups:
      - field_dimensions:
          - item["attributes"]["cmcd-streaming-format"]
          - item["attributes"]["cmcd-session-id"]
Processing Pathway: Buffer Length Metrics
Insight into buffer lengths helps delivery networks boost the quality of their streaming, especially for large user bases that are spread out geographically across the world.
The cmcd_buff_len node analyzes buffer lengths, and offers statistics relating to minimum, maximum, and average.
- name: cmcd_buff_len
    type: log_to_metric
    pattern: .*
    interval: 1m0s
    skip_empty_intervals: false
    only_report_nonzeros: false
    metric_name: cmcd_buff_len
    enabled_stats:
      - avg
      - min
      - max
    dimension_groups:
      - field_dimensions:
          - item["attributes"]["c-country"]
        field_numeric_dimension: item["attributes"]["cmcd-buffer-length"]
Processing Pathway: Outputting Processed Logs and Metrics
After all processing has been completed, there are three separate nodes where logs can be shipped to further destinations:
processed-logs: Routes logs after they have been filtered and metrics generated, ensuring post-processing storage for analytics.metrics: Contains aggregation of all computer metrics, for continued analysis.archive: All raw CMCD logs land here, ready to be sent to destinations for long-term storage and compliance tracking.
CMCD Node in Action
To start using the CMCD Pack, you’ll first need an existing pipeline in Edge Delta.
To set up a pipeline, go to Pipelines, click New Fleet, and choose between Edge Fleet or Cloud Fleet, depending on your hosting environment. Then, follow the setup instructions to complete the configuration.
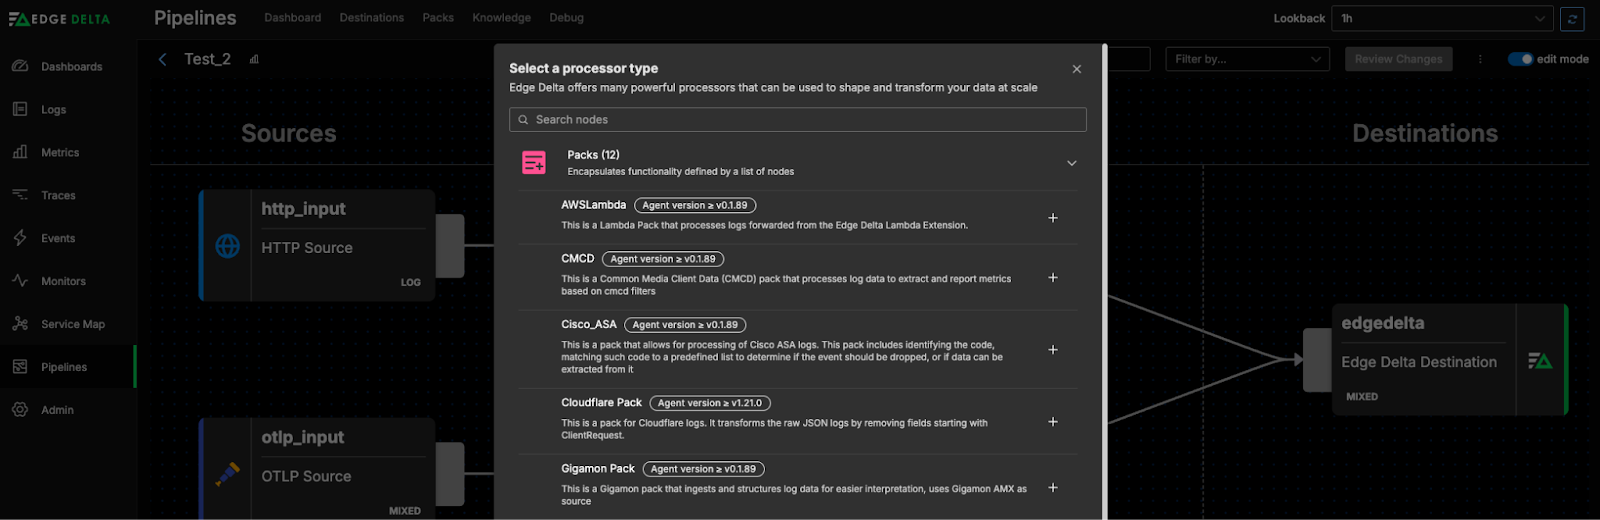
When your pipeline has been created, open the Pipelines menu, select Knowledge, then navigate to Packs. Scroll down to locate the CMCD Pack and hit Add Pack. This will relocate the pack to your library, which you can access any time from the Pipelines menu under Packs.
To add the pack to an existing pipeline, navigate to your Pipelines dashboard, select the pipeline where you want to apply the CMCD Pack, and enter Edit Mode. Use the Pipeline builder to configure it.
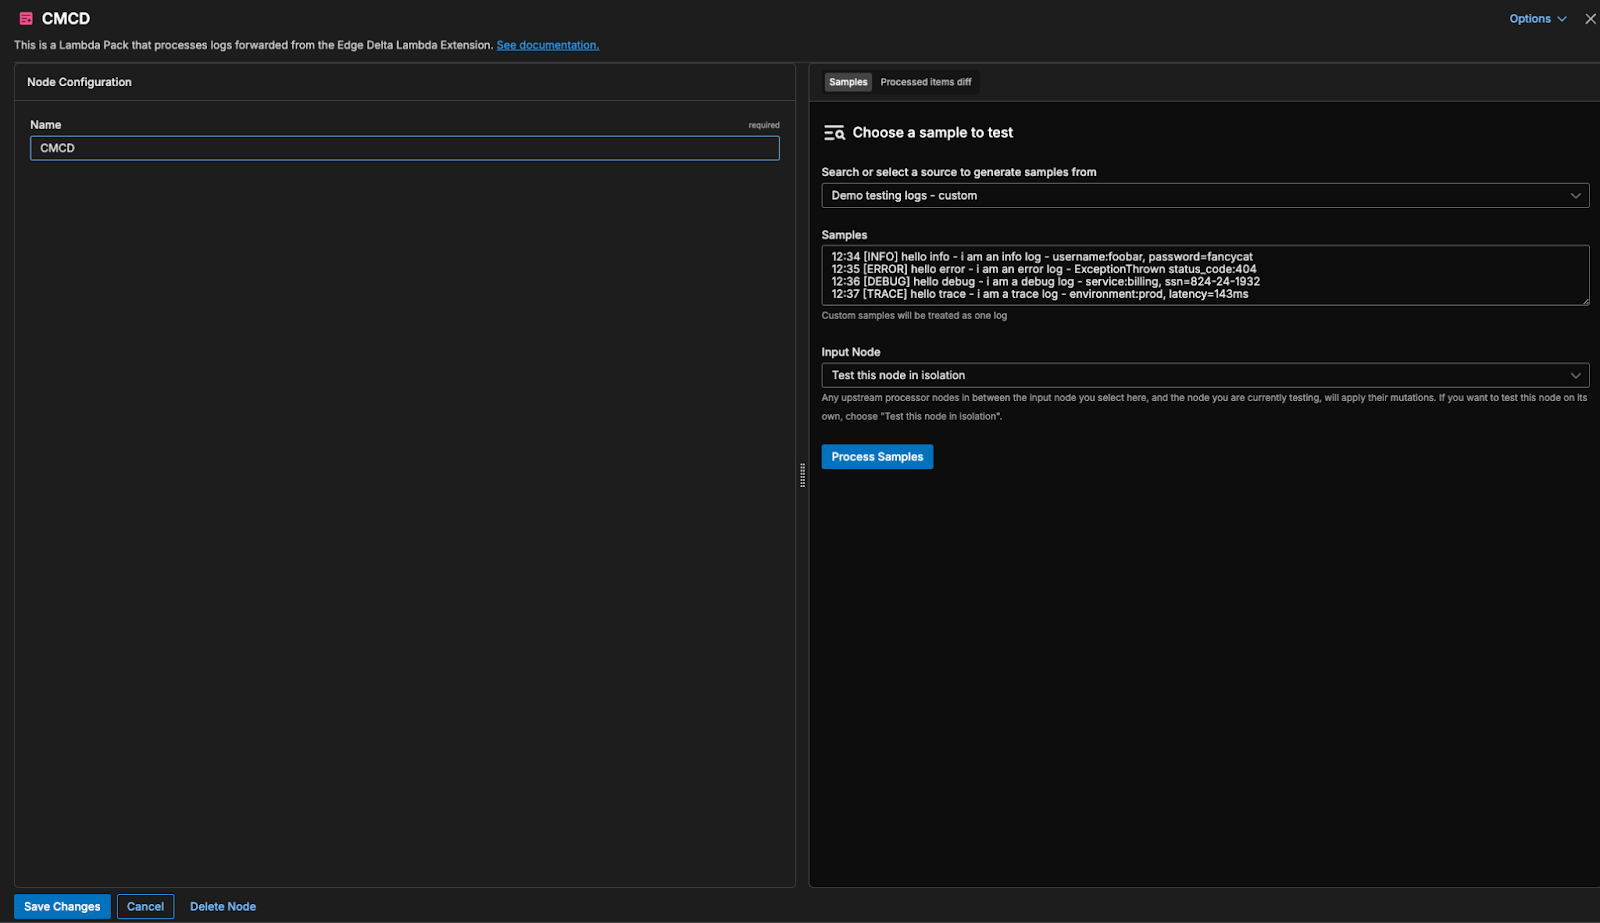
While in Edit Mode, click Add Processor, go to Packs, and select CMCD Pack. You’ll have the option to rename the pack from “CMCD Pack” to a name of your choice. Once you’re done, click Save Changes to apply the pack. Then, return to the Pipeline builder and drag the initial connection from your logs source into the pack.
To finalize the process, you’ll need to add some destinations. Edge Delta Telemetry Pipelines allow you to ship your processed data to any analysis platform — such as Grafana, Datadog, Splunk, and others — while also enabling you to send a full copy of your raw logs to any storage destination, such as S3, for archival or compliance purposes.

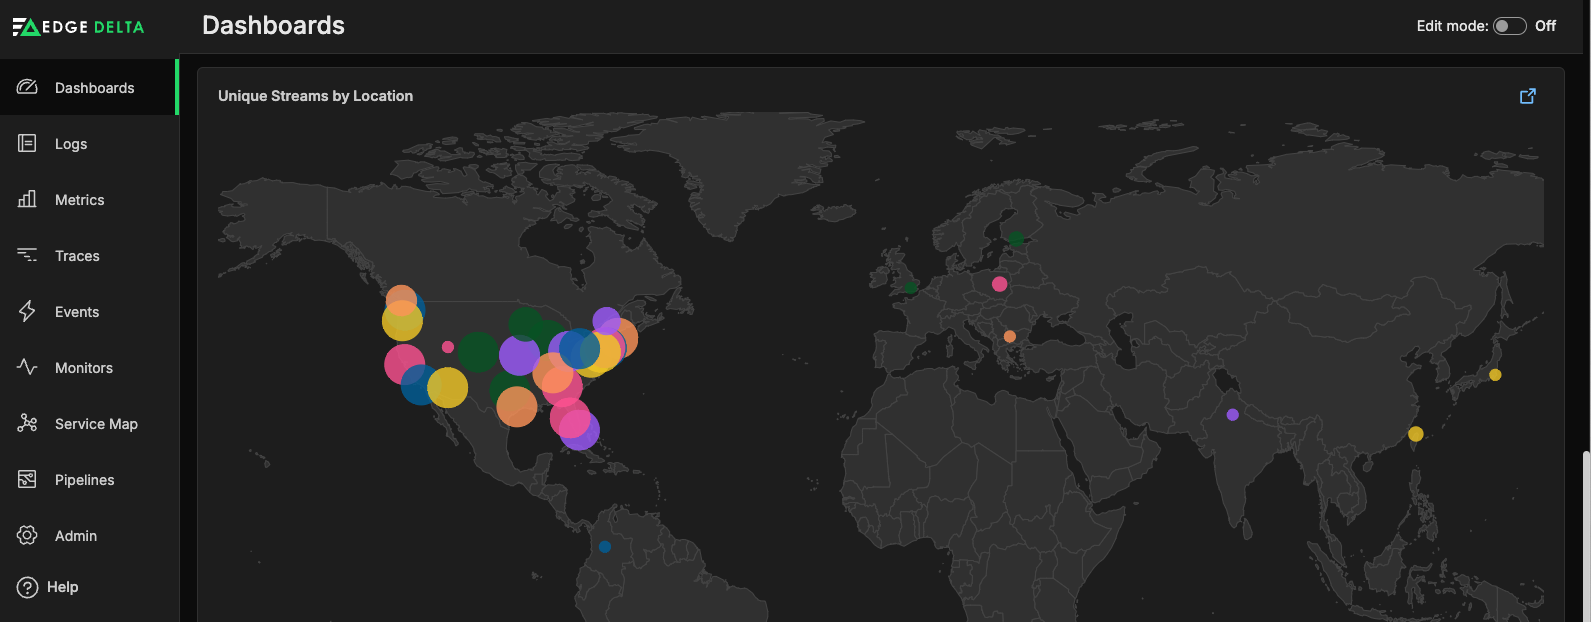
You can also route the data straight into Edge Delta. For instance, once the CMCD metrics have been extracted, they can be fed into Edge Delta for deeper analysis. In this case, you can create a custom dashboard using streaming encoded bitrate metric data to visualize bitrates by region:
When sent to Edge Delta’s backend, our easy-to-use dashboards and anomaly detection capabilities simplify and supercharge monitoring for teams working with CMCD.
Getting Started with the CMCD Pack
Edge Delta’s Packs help accelerate the process of extracting value from data that might otherwise seem too complex or time-consuming to analyze, including CMCD. Want to get your hands on our next-generation Telemetry Pipelines and play around with packs? Check out our free playground. You can also start a free trial.


