

Tail logs show you the latest information in a log file, letting you see what recently happened in a system. They provide a real-time view of your system, allowing you to spot problems and respond immediately.
The primary uses of tail logs in log monitoring and analysis include the following:
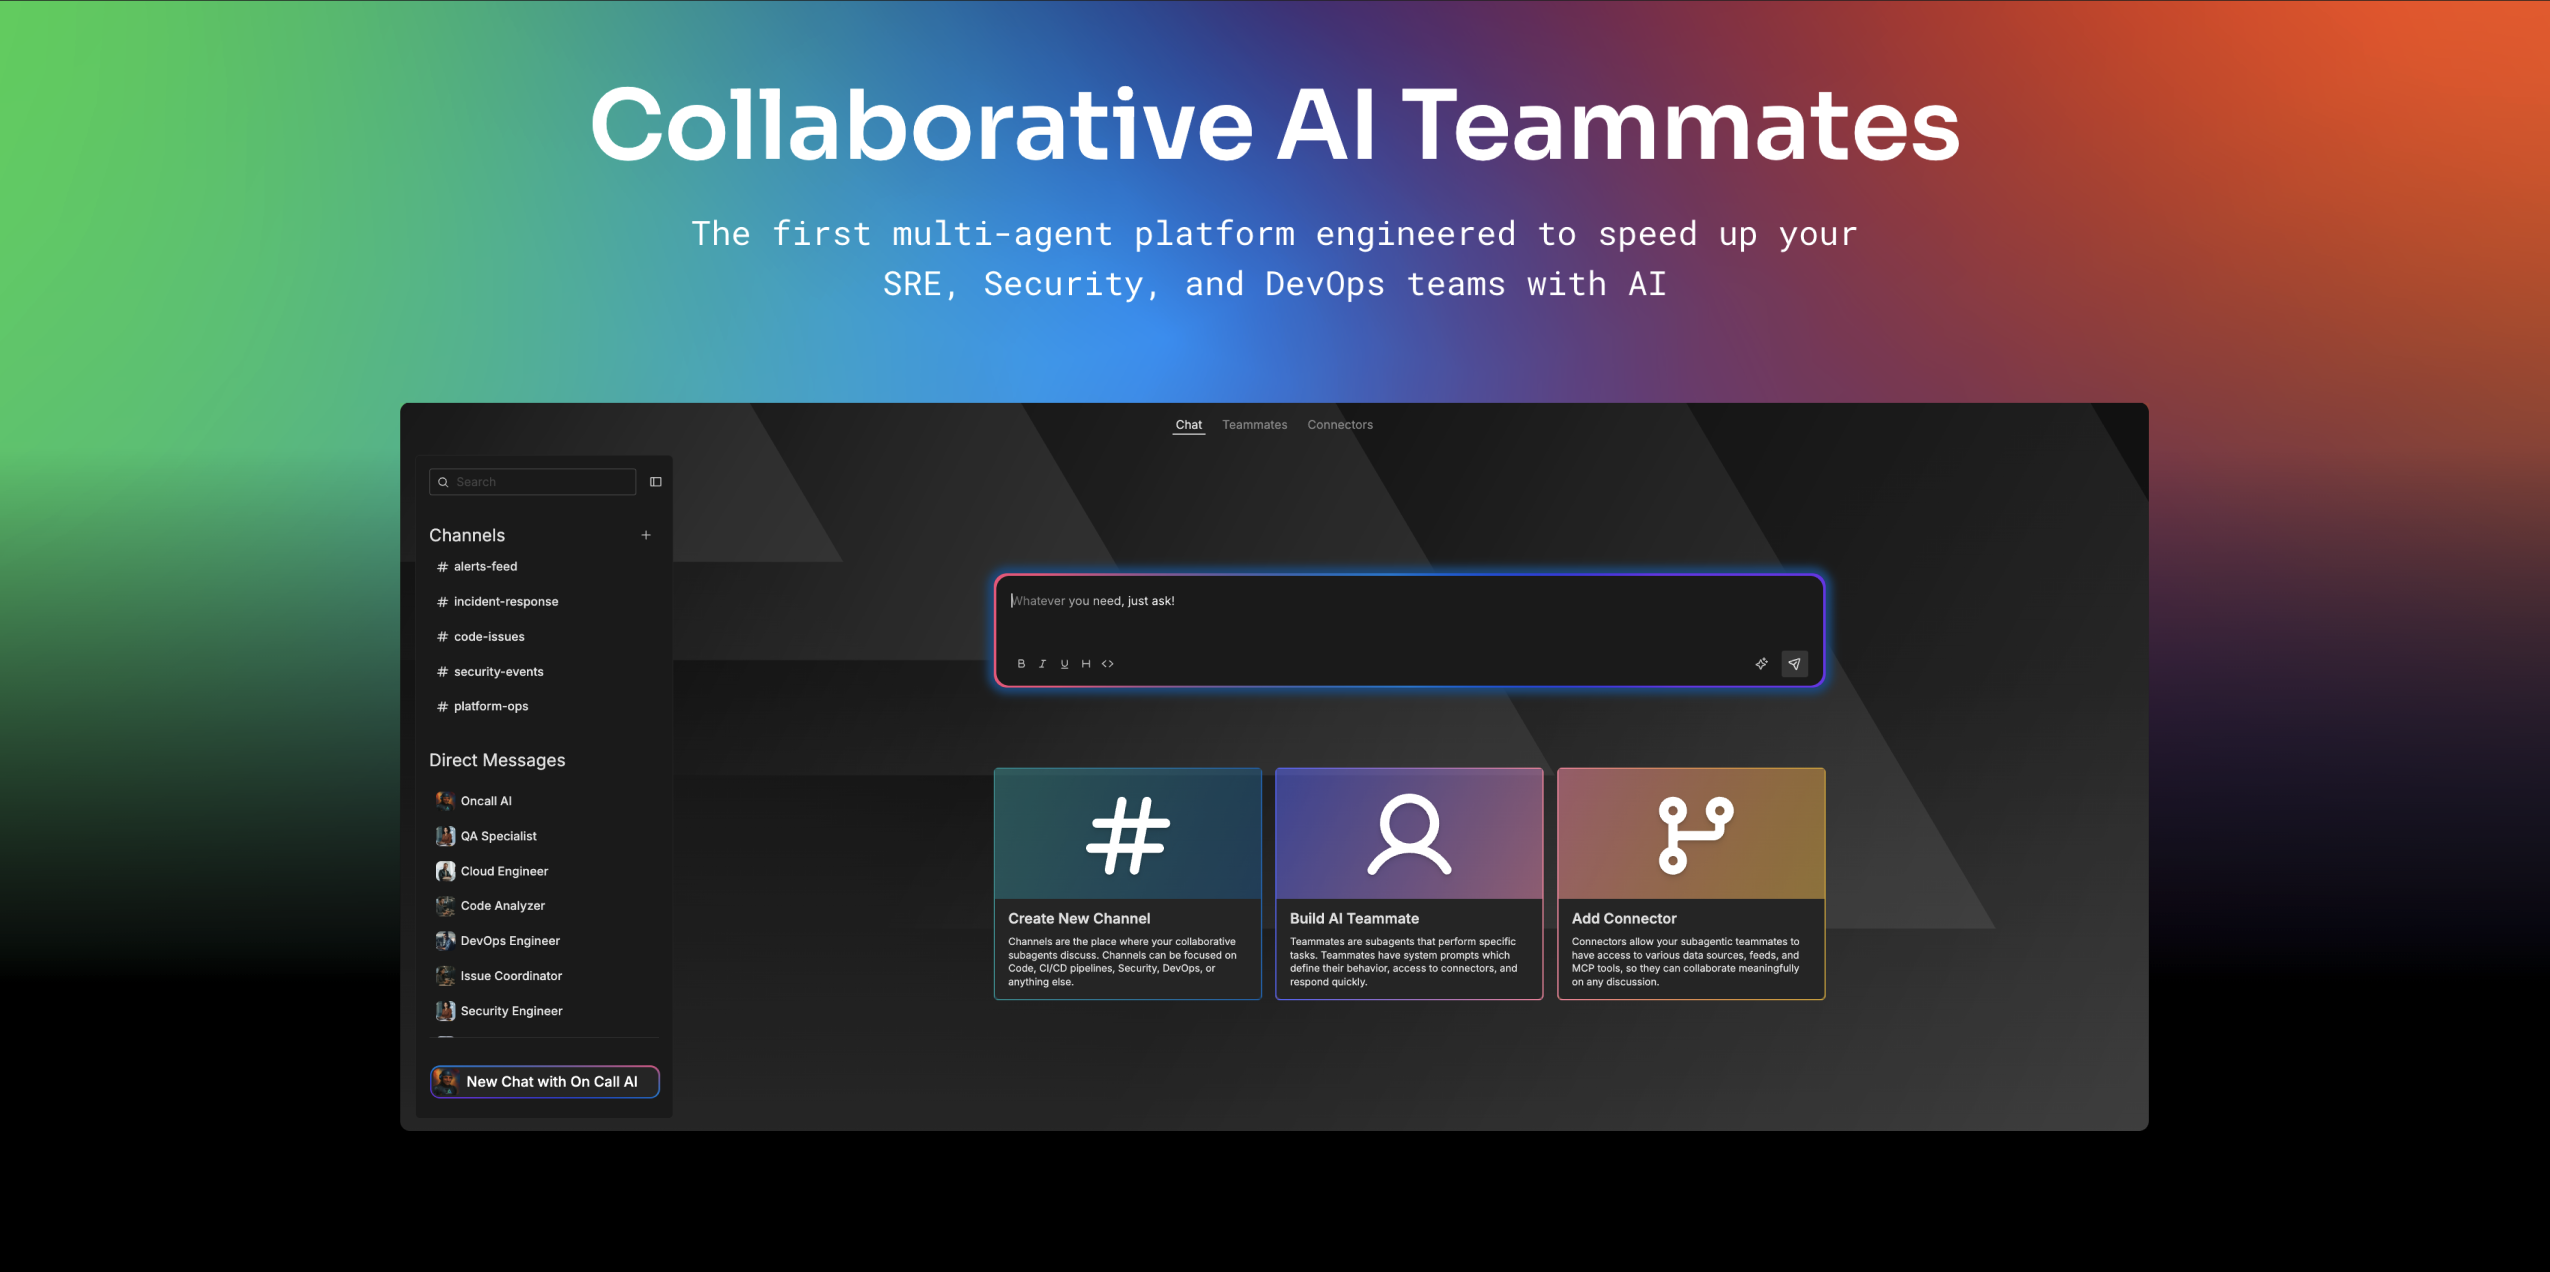
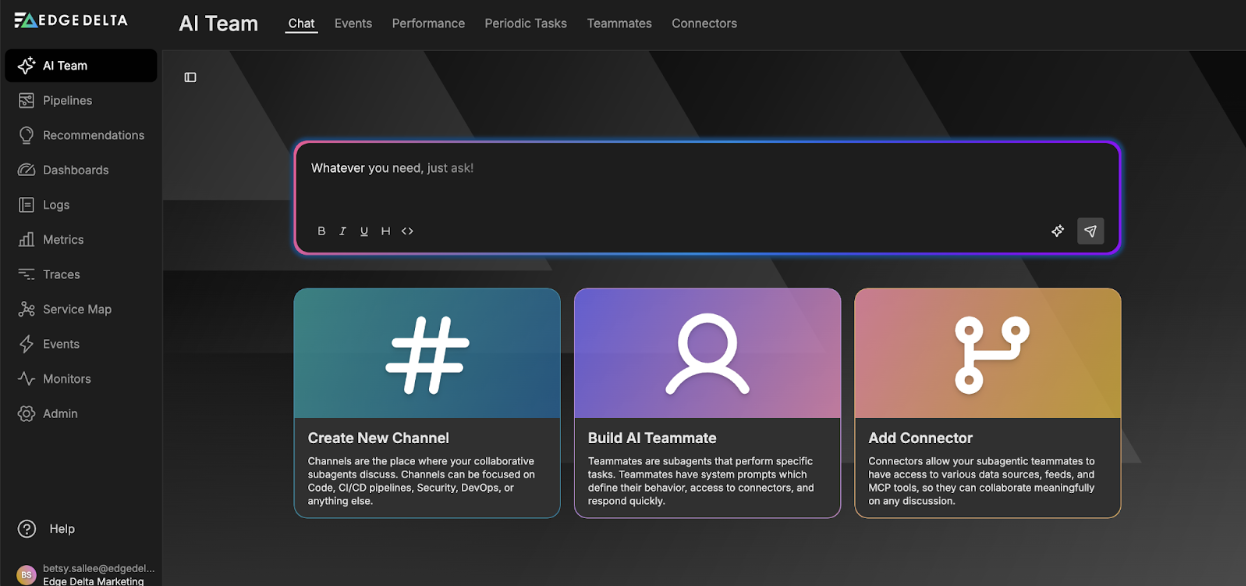
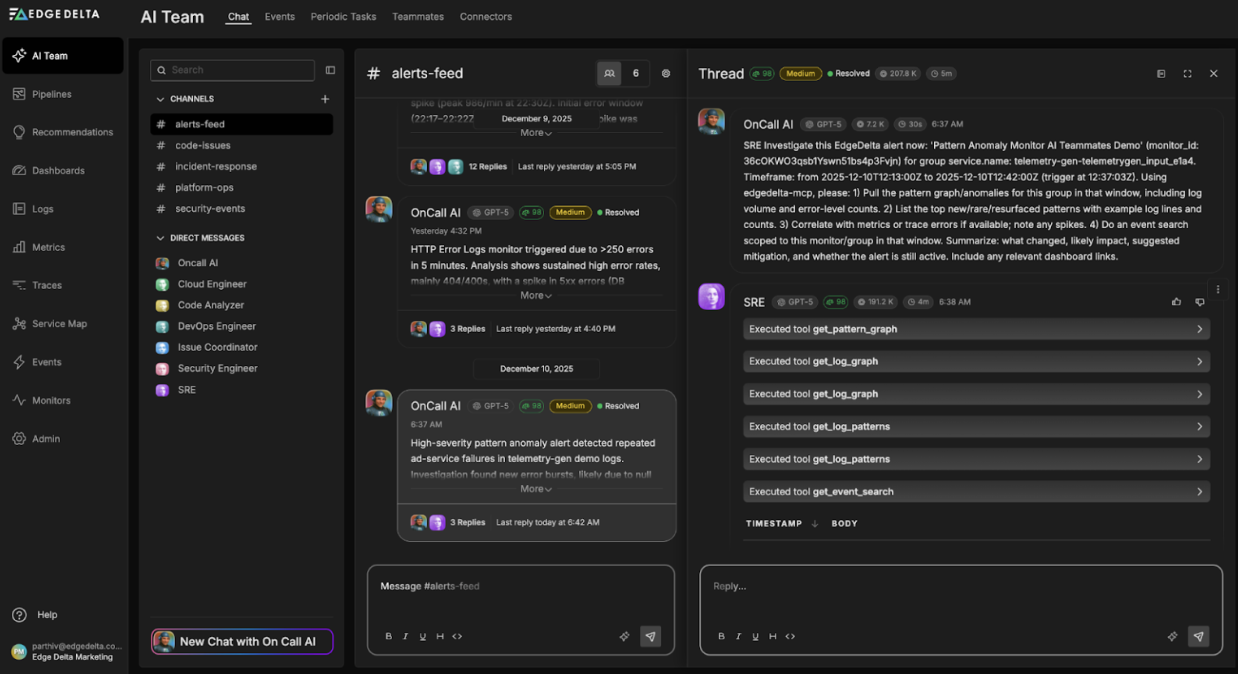
Want Faster, Safer, More Actionable Root Cause Analysis?
With Edge Delta’s out-of-the-box AI agent for SRE, teams get clearer context on the alerts that matter and more confidence in the overall health and performance of their apps.
Learn More- – Allow administrators and developers to observe system behavior
- – Detect and resolve issues
- – Respond to incidents as they occur
By relying on tail logs, administrators can find and fix problems by examining the newest entries, keeping everything running smoothly with minimal disruption. Tail logs also help rebuild the system’s state since the last backup, ensuring the backup data reflects the current system status.
To better understand log tails, this article will explore the basics of tail logs—what they are, why they are essential, and how they are used to keep the system running well.
|
Key Takeaways:
|
What Are Tail Logs?
Tail logs involve continuously monitoring and displaying the end of a log file in real-time as new entries are added. This practice is commonly used in system administration and software development to track application behavior, diagnose issues, and monitor system performance without manually opening or refreshing log files.
With tail logs, organizations can implement the following processes:
- – Real-time Monitoring
- – Immediate Issue Diagnosis
- – Performance Tracking
By providing immediate insights into system operations and behavior, tail logs help identify and resolve errors or unusual activities. These logs also ensure smooth operations through continuous monitoring of system performance metrics.
The diagram below shows how a log tailing process works, and we’ll provide an explanation of each term below it:
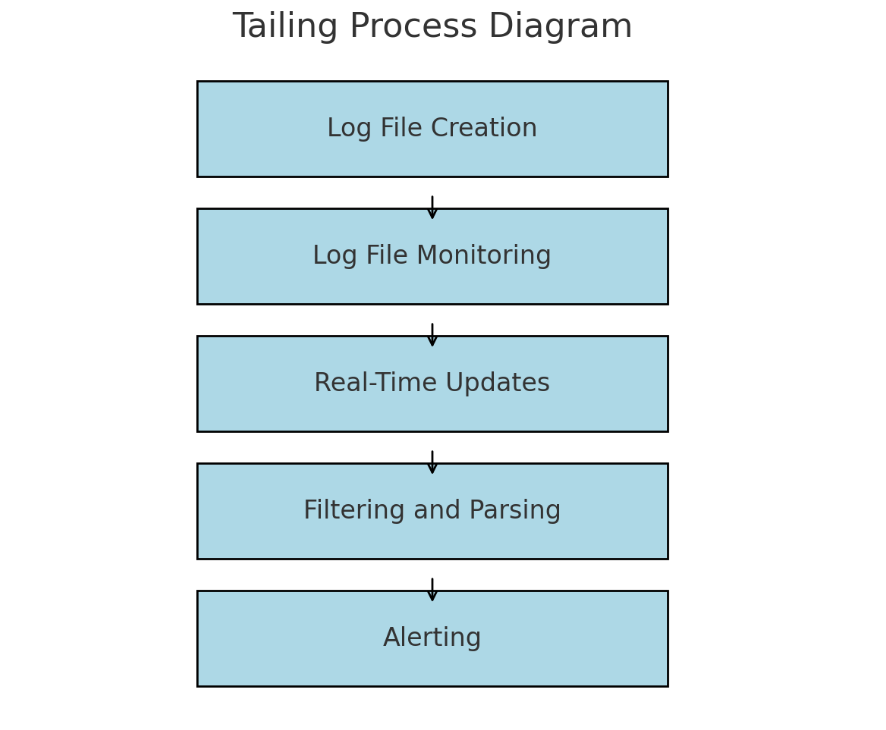
- – Log File Creation: Applications generate log files to record events, errors, and other information.
- – Log File Monitoring: A tool like the tail command in Unix/Linux reads the end of the log file continuously.
- – Real-Time Updates: As new entries are written to the log file, they are immediately displayed in the terminal or a monitoring tool.
- – Filtering and Parsing: Advanced log tailing tools can filter and parse log entries to display only relevant information.
- – Alerting: Some tools can be configured to send alerts when specific patterns or errors are detected in the logs.
As the log file grows with new entries, the tailing tool reads and displays them in real-time. This feature lets administrators and developers see updates immediately without manually reopening or refreshing the file.
Advanced tailing tools can filter log entries to show only relevant information. For example, you can filter out non-critical log entries or focus on error messages. Parsing options help structure the log data for easier reading and analysis.
Moreover, some sophisticated log monitoring tools integrate alerting mechanisms. These can be configured to watch for specific patterns, keywords, or errors in the log entries. The tool can send alerts via email, SMS, or other notifications when such patterns are detected, enabling proactive issue management.
Why Use Tail Logs?
Tail logs offer significant advantages for monitoring, troubleshooting, and analyzing log data. By focusing on the latest log entries, tail logging provides real-time insights, keeping you informed and simplifying your problem-solving processes.
Here are some of the reasons why organizations should leverage tail logs:
1. Real-Time Monitoring and Troubleshooting
Tail logs instant access to the latest log data as it is generated. This feature enables system administrators and developers to monitor their systems to quickly identify and resolve issues continuously.
For example, imagine a web app with unexpected performance problems. Administrators can spot patterns or anomalies in application log entries in real-time to find the root cause. An unexpected spike in error messages or a series of failed database queries can be detected immediately, allowing for immediate investigation and resolution.
2. Immediate Detection of Issues
Tail logs help organizations respond swiftly to problems by monitoring the latest log entries. This approach minimizes downtime and maintains service reliability.
Consider this scenario:
A streaming service provider notices an increase in buffering complaints from users. The engineering team quickly identifies a server overload causing the issue by tailing the logs. They quickly redistribute the load and fix the issue within minutes, ensuring a smooth viewing experience and customer satisfaction.
3. Streamlined Log Analysis
Tail logs offer substantial benefits for streamlined log analysis by concentrating on the most recent entries. This focused approach minimizes the noise from older, irrelevant log data, making it easier to identify and address current issues promptly.
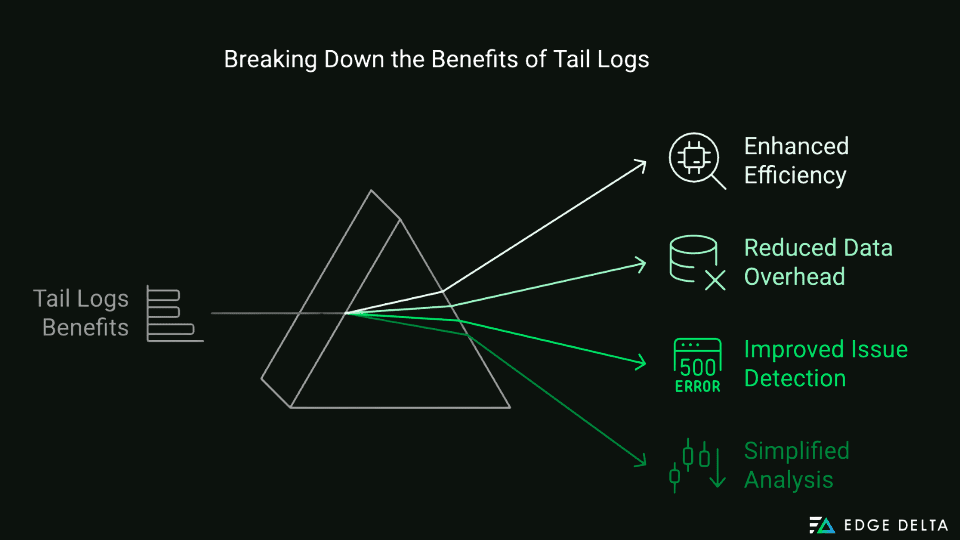
Using tail logs brings several key benefits that enhance the efficiency and effectiveness of log analysis:
- – Enhanced Efficiency: Tail logs filter out older, irrelevant log data, allowing analysts to quickly zero in on the most recent and pertinent information. This focused approach accelerates issue identification and troubleshooting.
- – Reduced Data Overhead: Tail logs manage high-volume log streams more effectively by reducing the amount of data that needs to be processed. This reduction in data load helps maintain system performance and lowers the complexity of log management.
- – Improved Issue Detection: Focusing on the latest logs ensures that emerging issues and critical errors are detected promptly. This real-time visibility into recent log entries allows quicker responses and resolutions to potential problems.
- – Simplified Analysis: Concentrating on recent logs allows analysts to track current trends and patterns more easily, simplifying identifying and addressing ongoing issues.
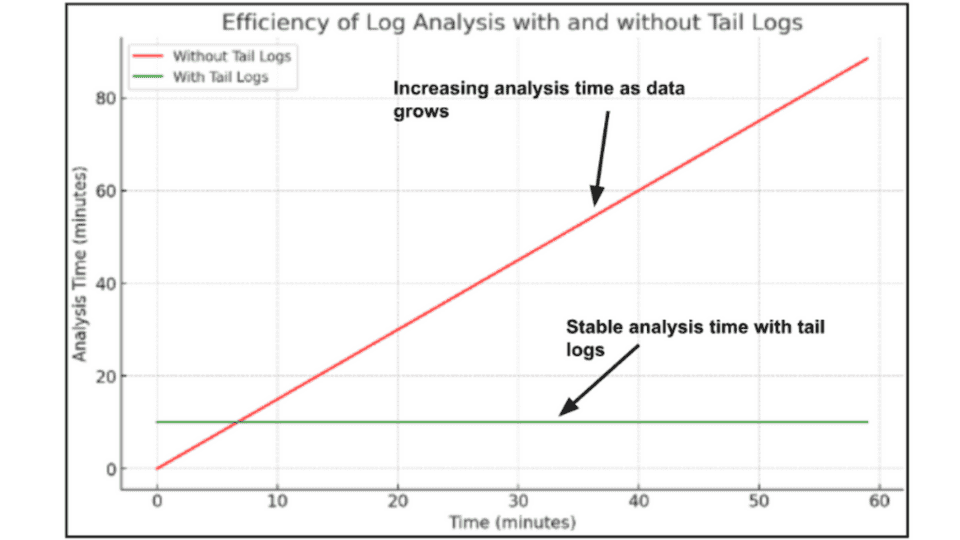
To illustrate the efficiency of log analysis with tail logs, consider a scenario involving a high-volume web application generating thousands of log entries per minute. Analyzing this data without log tailing can be time-consuming and overwhelming. However, with log tailing, analysts can quickly zero in on the most recent entries, significantly reducing the time required to pinpoint issues.
Below is a graph that demonstrates the efficiency of log analysis with and without tail logs:
How To Use Tail Logs
Learning how to tail a log file is essential for real-time system monitoring and troubleshooting. By continuously viewing the latest entries in your log files, tailing logs helps you quickly identify and resolve issues as they arise, ensuring minimal disruption to your operations.
Continue reading to learn everything from basic tail logs commands to advanced techniques to help you monitor and manage your systems more effectively.
1. Tools for Tailing Logs
Various tools and techniques have been developed to facilitate efficient log tailing, each offering unique features suited to different use cases. Here’s a list of some of the most commonly used tools for tailing logs:
|
Tool |
Features |
Use Case |
|---|---|---|
|
tail |
Basic tailing with limited functionality |
Simple real-time log monitoring |
|
less +F |
Pager with real-time following and navigation |
Continuous monitoring with navigation and search |
|
multitail |
Multiple log file tailing, color coding, filtering |
Monitoring multiple logs simultaneously |
|
ccze |
Colorizes log output that works with tail |
Enhanced readability of log output |
|
inav |
Interactive log navigation, searching, filtering |
Advanced log navigation and filtering |
Here’s an overview of these tools’ strengths and limitations:
|
Tool |
Strengths |
Limitations |
|---|---|---|
|
tail |
Simple and lightweight with no additional setup required on most Unix-like systems |
Limited functionality and does not support complex filtering or multiple file monitoring |
|
less +F |
Combines real-time log monitoring with the ability to navigate and search through the file |
Not as feature-rich as dedicated log management tools |
|
multitail |
Highly customizable and supports merging logs, which is helpful for correlating events from different sources |
Requires more setup and understanding of its configuration options and can be resource-intensive when monitoring many files |
|
ccze |
Enhances log readability with color coding and is usable with tail for continuous monitoring |
Primarily a visual enhancement that relies on other tools for log tailing functionality |
|
inav |
Provides powerful search and filter capabilities, supports various log formats, and offers a user-friendly interface |
Requires additional setup and configuration to utilize all features effectively |
2. Step-by-Step Guide to Using Tail Logs
The tail command in Unix-like operating systems is a powerful tool for viewing a file’s end or continuously monitoring log files in real time. To use tail logs, the prerequisites are:
- Access to a Unix-like operating system (Linux, macOS, etc.)
- Basic knowledge of the command line interface
Step 1: Open Your Terminal
- Windows: Use Git Bash, PowerShell, or Command Prompt.
- Mac/Linux: Open the Terminal application.
Step 2: Navigate to the Log Directory
You must first navigate their directory to access and manage your log files. You can do this by typing cd (change directory) in your terminal.
The cd command changes your current directory to the target directory where your log files are located. For example, to navigate to the /var/log directory, you would use the following command:
cd /var/log
This command changes your directory to /var/log, where system log files are commonly stored in Unix-based systems. This directory typically contains log files related to system operations, services, and applications.
Step 3: View the End of a Log File
Use the tail command to view the last ten lines of a log file. Replace logfile.log with the name of your log file. For example:
tail logfile.log
This tail command will display the last ten lines of logfile.log. This step allows you to quickly access the latest log entries without opening the entire file, which can be very large.
Step 4: View More Lines from the End of a Log File
Use the -n option, then the number of lines you want to see, to view more than the default ten lines. For example:
tail -n 20 logfile.log
This tail command will display the last 20 lines of logfile.log, giving you a broader view of the most recent log entries. This command can be beneficial in scenarios where the last ten lines might not provide enough context to understand what has happened.
Step 5: Continuously Monitor a Log File
To continuously monitor a log file, use the -f option. This key will display new lines as they are added to the file. For example:
tail -f logfile.log
The tail -f command will keep the terminal session open and display any new lines appended to logfile.log. As new log entries are generated, they will automatically appear on your screen, allowing you to stay updated without manually reopening or refreshing the log file.
Step 6: Combine Options for Custom Tail Output
You can combine the -n and -f options to view a specific number of lines and continue monitoring the log file. For example:
tail -n 100 -f logfile.log
This command displays the last 100 lines and then keeps the terminal open to show new lines. It also provides context from recent log entries to keep track of ongoing activities or issues.
Step 7: Stop Monitoring the Log File
To stop monitoring the log file, press Ctrl+C in the terminal. This action will terminate the tail command.
3. Advanced Tailing Techniques
Advanced techniques can significantly enhance the utility of tailing logs by allowing for more targeted and efficient monitoring. By implementing advanced methods, administrators and developers can:
- Quickly identify and address issues
- Isolate specific types of log entries
- Understand system behavior and performance
Advanced tailing techniques include using regular expressions for filtering, which allows for pinpointing specific patterns or keywords within the logs, such as errors or warnings. This targeted approach helps reduce noise and focus on the most critical information.
Below are examples of advanced tailing commands that utilize regex filtering to streamline log monitoring and make it more efficient. These commands use grep with a regular expression to filter log entries containing the word “ERROR”:
tail -f /var/log/myapp.log | grep "ERROR"
To further enhance this, you can filter for specific error codes or messages that match a pattern. For example, to filter for both “ERROR” and “WARN” messages:
tail -f /var/log/myapp.log | grep -E "ERROR|WARN"
Challenges of Using Tail Logs
As the volume of data increases and systems become more complex, managing and effectively utilizing tail logs can become increasingly difficult. Knowing and addressing these obstacles is crucial for maintaining system efficiency, performance, and security.
Below are some common obstacles associated with tailing logs and practical solutions to overcome them.
1. Handling Large Log Files
As systems generate an immense amount of data, the log files can become unwieldy, making it difficult to parse and analyze them efficiently. Handling these large files can lead to performance bottlenecks and slow the log tailing process.
To efficiently manage large log files, consider implementing log rotation, which involves splitting log files into smaller, more manageable chunks. This approach makes it easier to search and analyze without handling the raw, large log files directly.
Another strategy is to aggregate logs to centralize and index data. This approach involves tools to gather logs into a unified format and store them in one location for more accessible analysis, monitoring, and management.
2. Performance Overhead
Continuous tailing of logs can introduce significant performance overhead, especially in high-traffic environments. The constant read-and-write operations required to keep the log tailing process up-to-date can strain system resources, potentially impacting the overall performance of the monitored applications and services.
To minimize performance overhead, optimize the log tailing process using efficient log parsers to manage high volumes of logs with minimal resource consumption. Additionally, consider setting up filters to only tail logs that match specific criteria, reducing the amount of data processed in real time. Utilizing buffered I/O can also help by reducing the number of system calls required for reading log entries.
3. Data Security and Privacy
Maintaining data security and privacy is critical when dealing with logs, especially in environments where sensitive information is stored. When tailing logs, the continuous display of log entries can inadvertently expose sensitive data to unauthorized access.
Without proper security measures, sensitive data can be exposed, posing significant risks such as breaches and noncompliance with regulations. You can implement robust security protocols that protect log data throughout its lifecycle. However, it’s challenging to do this while monitoring and debugging tail logs in real-time.
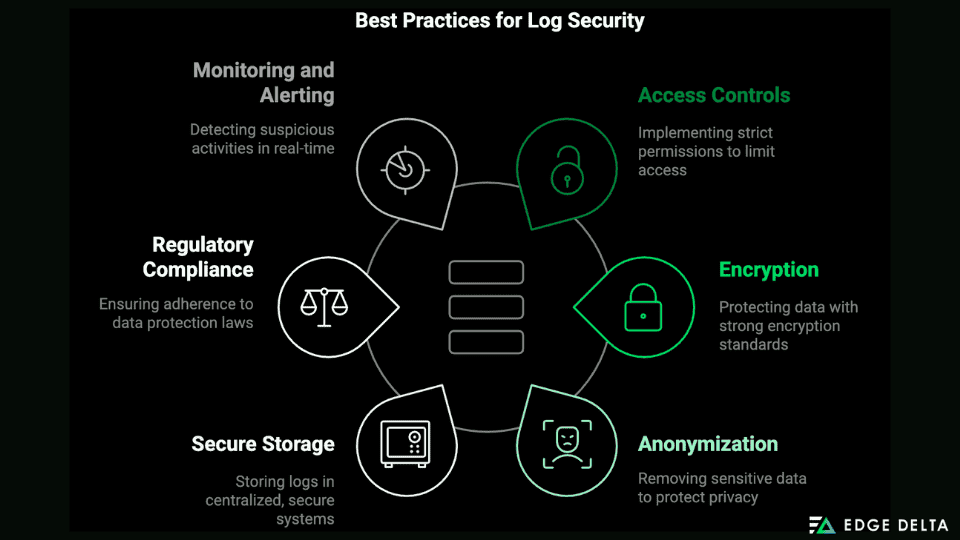
The following are some best practices for ensuring data security and privacy:
- Access Controls: Implement strict access controls and role-based access control (RBAC) to limit permissions. Regularly audit access logs.
- Encryption: Encrypt log data in transit and at rest using strong encryption standards. Securely manage encryption keys with regular rotation.
- Anonymization and Redaction: Use anonymization techniques to remove or obfuscate sensitive data. Employ log redaction tools to mask sensitive information in real time.
- Secure Log Storage: Keep logs in centralized, secure log management systems with built-in security features. Regularly back up log data and verify backup integrity.
- Compliance with Regulations: Ensure log management practices comply with data protection regulations (e.g., GDPR, HIPAA). Implement data retention policies for secure deletion after the required period.
- Monitoring and Alerting: Set up real-time monitoring and alerting for suspicious log access and modifications. Leverage IDS and SIEM to analyze log data for potential security incidents.
- Regular Security Reviews: Conduct regular security audits to identify and address vulnerabilities. Keep up with the latest security threats and best practices.
Best Practices for Using Tail Logs
The tail command can be highly effective when managing and monitoring log files. However, following the best practices ensures that you maximize its benefits.
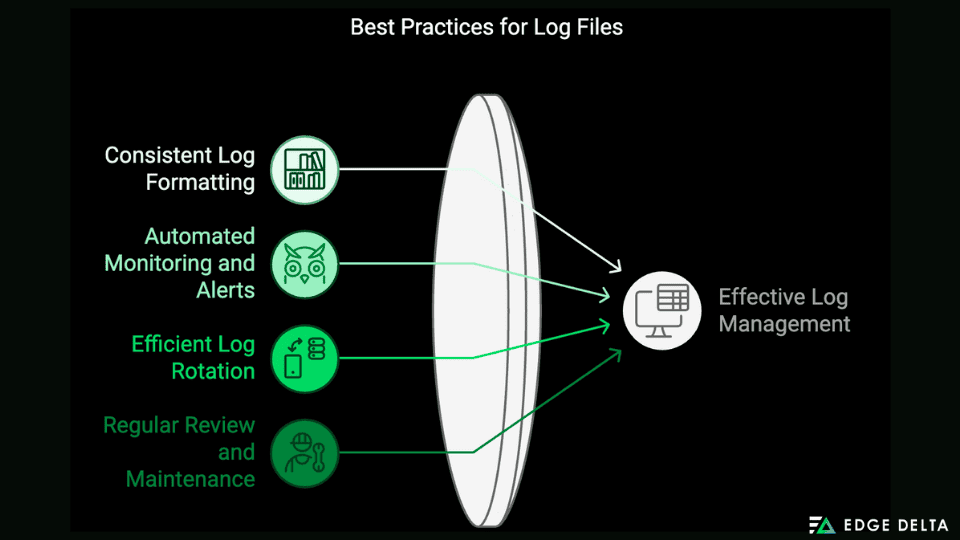
1. Consistent Log Formatting
Uniform formatting allows easier parsing and analysis, quickly identifying issues and patterns. Filtering log entries can become complex and confusing without a consistent format, leading to missed critical errors or issues.
Consistent formatting of log entries is crucial for maintaining the same sequence and type of information across all entries.
For example, if a log entry contains a timestamp, log level, message, and source, all future entries should follow this identical order. This standardization makes monitoring, debugging, and analyzing system behaviors and events more straightforward.
Here are some advantages of standardized log formats:
- Consistency: Ensures uniformity across logs from different systems and applications.
- Ease of Parsing: Facilitates automated parsing and analysis by log management tools.
- Readability: Enhances the clarity and comprehension of log entries for human readers.
- Interoperability: Supports integration with various log aggregation and analysis platforms.
Here is an example of standardized log formats for web server logs using the Common Log Format (CLF):
127.0.0.1 - jack [10/July/2024:13:55:36 -0700] "GET /apache_pb.gif HTTP/1.0" 200 2326
Components:
- IP address
- User identifier
- User ID
- Timestamp
- Request line (method, resource, protocol)
- Status code
- Size of the response
2. Automated Monitoring and Alerts
Tail logs provide immediate visibility into system activities and potential issues as they arise, allowing for rapid detection and response. This feature makes log tailing crucial for automated monitoring and alerting.
By setting up automated monitoring and alerts based on tail logs, you can significantly enhance system performance and reliability, resulting in the following benefits:
- Immediate Detection of Issues: Automated monitoring provides real-time visibility into log data, allowing for the immediate detection of potential problems as they arise. This rapid detection helps address issues before they escalate, minimizing downtime and reducing the impact on system performance.
- Proactive Issue Management: Automated alerts notify you of specific log patterns or threshold breaches, ensuring that you are aware of issues even if they are not immediately visible through manual monitoring. This proactive approach helps resolve problems quickly and prevents them from becoming major incidents.
- Reduced Manual Effort: Automating the monitoring and alerting process reduces the need for manual log inspection and analysis. This process saves time and lets your team focus on more important tasks, improving efficiency.
- Customizable Alerts: Systems can be set up to send out alerts based on factors such as error rates, response times, or particular log messages. This customization ensures that alerts are relevant and actionable, reducing the noise from non-critical logs and helping your team prioritize their responses.
- Enhanced Accuracy with Machine Learning: Integrating machine learning into your monitoring setup can improve anomaly detection accuracy. Machine learning models can adapt to new patterns and identify issues that static rules might miss, providing more precise and actionable alerts.
- Comprehensive Log Analysis: Automated log analysis tools can correlate data from multiple sources, offering a unified view of system behavior. This thorough analysis aids in identifying the root causes of issues and understanding the broader context of events, leading to more effective troubleshooting.
- Regular and Relevant Alerts: Regularly tuning your alerting rules ensures they remain relevant and efficient. This ongoing adjustment reduces false positives and ensures that the alerts you receive are meaningful and indicative of genuine issues.
3. Efficient Log Rotation
Log rotation is a crucial practice that ensures logs are handled efficiently, preventing disk space and performance issues. With this approach, teams can maintain system efficiency and reliability by:
- Preventing Disk Space Exhaustion: Regularly archiving and removing old logs to prevent the disk from becoming full
- Improving Performance: Keeping log files manageable to enhance access speed and processing efficiency
- Enhancing Manageability: Organizing logs into smaller, more manageable files to facilitate easier troubleshooting and analysis
Here are some helpful strategies to ensure the effectiveness of log rotation:
- Define a Rotation Schedule: Choose a rotation frequency that aligns with your logging volume and retention needs. A well-defined schedule ensures that logs are rotated before they grow too large, whether daily, weekly, or monthly.
- Set a Retention Policy: Determine how long to keep archived logs based on compliance requirements and operational needs. This policy helps manage disk space while ensuring that historical logs are available for as long as needed.
- Configure Log Rotation: Utilize built-in tools or external utilities to automate the log rotation process. Proper configuration ensures that old logs are archived and new logs are started automatically, reducing manual intervention.
- Automate and Monitor: Implement scheduled tasks to automate log rotation and continuously monitor the setup. Regular reviews and adjustments will help you adapt to changes in log volume and system requirements, maintaining efficient log management.
4. Regular Review and Maintenance
Regular review and maintenance of tailing setups ensure they effectively capture and monitor log data. Tailing setups can only become effective with regular review and maintenance, leading to missed alerts and potential system failures.
Ensuring that your tailing configurations are up-to-date and optimally functioning is essential for maintaining system health and performance. Here are critical practices for regular review and maintenance:
- Consistent Monitoring: Ensure that log tailing setups are continuously monitored to capture all relevant log data and detect potential issues promptly.
- Updates: Regularly update log management tools and tailing configurations to incorporate new features, improvements, and security patches.
- Audit Log Volume: Frequently audit the volume of logs being captured to manage storage effectively and prevent the system from being overwhelmed.
- Analyze Log Patterns: Periodically analyze log patterns to identify any changes in application behavior or potential issues that need addressing.
- Backup Configurations: Maintain backups of your tailing configurations to restore setups quickly in case of failures or misconfigurations.
Here’s a checklist to consider when reviewing and maintaining tailing setups:
| Category | Checklist Items |
| Configuration |
|
| Performance |
|
| Log Volume |
|
| Alerts |
|
| Security |
|
| Backup |
|
| Documentation |
|
Conclusion
Tail logs provide real-time insights into the latest system activities, which is crucial for log management processes. By continuously monitoring log file ends, tail logs quickly identify and resolve issues by continuously monitoring log file ends, minimizing disruption and optimizing system performance.
Best practices like consistent log formatting, automated monitoring, efficient rotation, and regular review and maintenance improve tail logs. Leveraging these strategies allows organizations to stay proactive in their log management, ensuring robust and reliable system operations.
FAQs for What are Tail Logs
How to check tail logs?
To check tail logs on Unix-like systems, use the `tail` command to view the last ten lines of a file or specify more lines. For continuous monitoring, use `tail -f.` Use the `Get-Content` command in PowerShell to display the last ten lines or more on Windows, and use `Get-Content -Wait` for live monitoring. These commands help with real-time log analysis and troubleshooting.
How do you tail logs into a file?
To tail logs into a file, use the `tail -f source.log > output.log` command on Unix-like systems or the `Get-Content source.log -Wait > output.log` command in Windows PowerShell. This step will continuously write the new log entries from the source file into the output file.
What is the tail command used for?
By default, the tail command displays the last part of a file, typically the previous ten lines. It is commonly used to view the most recent entries in log files and can also follow a file in real time, updating as new lines are added.
How to keep tailing logs?
Use the tail -f command on Unix-like systems or the Get-Content -Wait command on Windows PowerShell to keep tailing logs. These commands will continuously display new lines added to the log file in real-time.
Sources: