

In today’s digital landscape, organizations have rapidly adopted microservices architecture in their applications, and distributed tracing is a mechanism to observe the behavior of these services. Through distributed tracing, developers can improve visibility into service interactions, obtain faster debugging, and attain better performance optimization.
First, what is distributed tracing? At a high level, distributed tracing extends the concept of tracing to systems which are distributed across a number of services or components. Instead of traditional tracing, which tracks requests as they travel through a single monolithic system, distributed tracing tracks requests as they bounce around different services, which are most likely running on multiple different machines or containers.
The best-distributed tracing tools can help developers and businesses eliminate performance bottlenecks and recover from incidents faster. They also provide a central overview of how user requests are performed in different services.
Choosing the right distributed tracing tool for your application is critical. This guide will help you find the best-distributed tracing tool for your needs.
Key Takeaways
- Distributed tracing tools can upgrade your company and team’s response to performance issues and improve the end-user experience.
- Jaeger tracing is a powerful open-source tool that helps track and understand the flow of requests or transactions.
- Developers can quickly move from the trace to the logs for each request and get essential details using Datadog.
- There are many important factors to consider when choosing a distributed tracing tool, including its scalability and cost.
Tools for Distributed Tracing in Microservices
A great distributed tracing tool can upgrade your company and team’s response to performance issues, improving the end-user experience and providing several core functionalities, which typically include:
- Visualization: User interfaces that present trace data in an understandable format, often delivering features such as graphical representations of request flows, latency histograms, and filtering capabilities to assist users in exploring and analyzing traces.
- Trace propagation: Mechanisms to propagate trace context across service boundaries, guaranteeing that a single trace can be produced from multiple services involved in handling a request or transaction.
- Data collection: Elements or services that receive, process, and store the trace data generated by instrumented applications and services, often supporting various storage backends and data formats.
- Integration: Support for integrating with other monitoring, observability, and logging tools, allowing users to correlate trace data with other system metrics and logs for a complete understanding of system performance and behavior.
- Instrumentation: These are libraries or SDKs for various programming languages that enable applications and services to generate and report trace data, including information about requests, transactions, and events.
- Data processing: Mechanisms to aggregate, filter, and analyze trace data, enabling users to derive insights about the performance and behavior of their distributed systems.
- Alerting and notifications: Features that enable users to define thresholds, conditions, or patterns related to system performance and receive messages or trigger actions when these conditions are met, helping teams proactively identify and address issues.
- Standardization and interoperability: Support for standard trace formats, context propagation mechanisms, and APIs allows for easier integration and interoperability between various distributed tracing tools and compatibility with other observability and monitoring systems.
Discover five distributed tracing tools available on the market in the following section.
Jaeger: Best for Latency and Performance Optimization
Jaeger tracing is a powerful open-source tool Uber created and is now a Cloud Native Computing Foundation (CNCF) graduate project. This tool helps track and understand request and transaction flows across various services and components in a distributed system, enabling teams to identify latency issues, detect bottlenecks, and improve overall system reliability and performance.
Some of Jaeger’s key features include the following:
- Performance/latency optimization
- Distributed context propagation
- Service dependency analysis
- Distributed transaction monitoring
- Root cause analysis
Jaegar supports open-source, NoSQL trace storage backends, such as Elasticsearch, OpenSearch, and Cassandra. These backends allow users to see and filter the traces based on service duration and tags Note that Jaeger recommends Elasticsearch/OpenSearch over Cassandra.
The following details show how many companies are using Jaeger in their operation. Read on and learn the details.
Jaeger Use Case: Over 1,439 Enterprise Users
Over 1,439 companies use Jaeger in their operations. These companies are primarily in the finance, telecommunication, and technical sectors. These companies include:
- SingTel
- Freshworks Inc
- Absa
- SailPoint
- Wells Fargo
- American Express
Datadog APM: Best for In-depth Visibility
Datadog Application Performance Monitoring (APM) is an effective tool for modern applications that enables distributed tracing. It gathers, visualizes, and analyzes real-time traces, allowing developers to identify performance issues and optimize their applications. This tool supports various languages, frameworks, and libraries, making it a versatile solution for monitoring complex, distributed systems.
The critical features of Datadog APM, which provides distributed tracing capabilities, include:
- Up-to-date performance dashboards for web services, queues, and databases to monitor requests, errors, and latency
- Correlation of distributed tracing to browser sessions, logs, profiles, network, processes, and infrastructure metrics
- Can ingest 50 traces per second per APM host
- Service maps to understand service dependencies
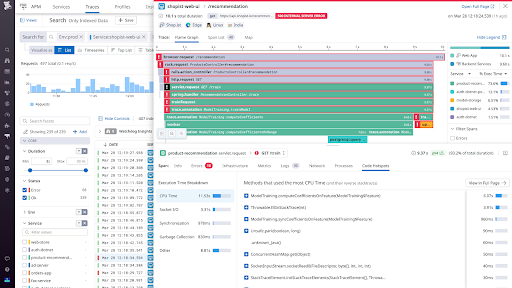
Image source: Datadog
Using Datadog, developers can quickly move from the trace to the logs for each request and get important details like infrastructure and runtime metrics. Additionally, it ensures end-to-end application monitoring across all platforms, including:
- Mobile app
- Web browsers
- Individual queries
Zipkin: Best for Troubleshooting Latency Data
Zipkin is a prominent open-source distributed tracing tool initially developed at Twitter. This tool gathers data needed to troubleshoot latency problems in service architectures. It is straightforward to set up with the Docker or Java command shown below.
// Docker
docker run -d -p 9411:9411 openzipkin/zipkin


// Java
curl -sSL https://zipkin.io/quickstart.sh | bash -s
java -jar zipkin.jar
// From Source
# get the latest source
git clone https://github.com/openzipkin/zipkin
cd zipkin
# Build the server and also make its dependencies
./mvnw -DskipTests --also-make -pl zipkin-server clean install
# Run the server
java -jar ./zipkin-server/target/zipkin-server-*exec.jarInitially, developers are required to install the tracing tool onto their services. For each request, Zipkin allocates a unique trace ID to assist the tool in identifying the request for a collection of services. This is required for data collection and lookup.
Some of the unique features of Zipkin involve the following:
- Supplies a web-based user interface for visualizing trace data.
- Users can filter traces based on service name, time range, etc.
- Provides visualizations like dependency graphs and flame graphs.
- Reinforce integrations with various tools like logging and metrics platforms.
Learn about the Zipkin usage in the following details.
Zipkin Use Case:128 Companies using in the US
Over 128 companies use Zipkin in their operations in the United States. It has become popular due to its advanced uses. Numerous industries have used this tool to improve efficiency and trace areas needing troubleshooting. These industries include:
Finance industry like JPMorgan Chase and Absa
Manufacturing industry like Lockheed Martin
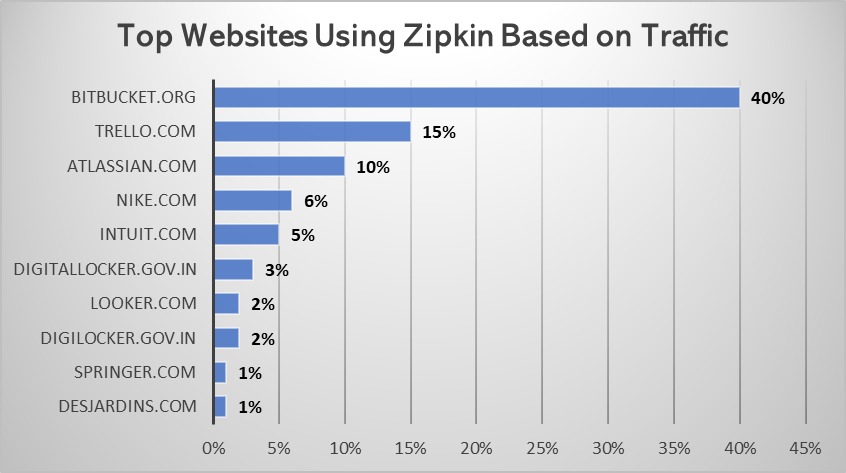
Several websites have already utilized Zipkin in their operations; here are the top websites using Zipkin based on traffic.
Now that you have learned about three prominent distributed tracing tools, learn about the next one, which is best for application performance monitoring.
New Relic: Best for Distributed Environments
New Relic is one of the pioneer platforms providing distributed tracing microservices. It goes beyond monitoring, offering real-time visualization and in-depth analysis of your system’s performance. Additionally, its “New Relic Edge service” specializes in distributed tracing and can observe 100% of an application’s traces.
Distributed tracing is one of New Relic’s primary offerings. It combines relevant data from various stacks of your technologies to reveal how your entire system functions. It is a fully managed cloud-native application, so you get on-demand scalability without additional infrastructure support.
New Relic’s most prominent features are:
- Distributed tracing and sampling options for a vast technology stack.
- Supports the industry-standard observability framework, OpenTelemetry.
- Sustains alerts & dashboards to diagnose errors before customers notice them.
- Delivers an easy setup where developers can install one agent to instrument the entire application code automatically.
- Discover how New Relic helped Forbes Media in the following section.
New Relic Use Case: Forbes Media Solves Problems Faster
Forbes Media runs on New Relic to manage the business’s digital side and ensure the availability and performance of its software stack.
Data Sessions: Forbes runs on New Relic to solve problems faster
The team started with New Relic APM and has grown to use infrastructure, browser, and log monitoring. With New Relic, the Forbes Media engineering team can solve problems faster.
Splunk: Best for Complex Networks
Splunk is an assertive and adaptable distributed tracing tool for monitoring and troubleshooting issues in distributed systems. Whether you’re tracking the performance of microservices or monitoring a complex network, leveraging Splunk can ensure that your systems run smoothly while minimizing downtime and optimizing overall performance.
This distributed tracing tool can gather all application data for a high-fidelity analysis. Additionally, it stores all trace data in Splunk Cloud’s offering.
Some of the primary features of the Splunk distributed tracing tool include the following:
- Uses an AI-driven service to identify microservices with errors.
- Provide end-to-end visibility across your applications.
- Can ingest multiple formats like JSON, XML, and unstructured data.
- Provides an attractive dashboard with charts, reports, pivots, etc.
- Indexes data to provide faster search and query capabilities.
Learn how Splunk helps a company increase its efficiency in the next section.
Splunk Use Case: DANA Builds Resilience and Resolves Incidents up to 90% Faster
Dana, a financial service offering security, infrastructure, and application performance monitoring to 135 million Indonesians, has become the largest e-wallet provider in the country. However, DANA’s monitoring system needed a dedicated tool for distributed tracing. The confined view across its hybrid infrastructure and application layers hindered service visibility.
Splunk’s full-fidelity data protection made it easier for Dana to increase business resilience by up to 90% through proactive, efficient troubleshooting and faster incident resolution. Additionally, it attained higher availability while minimizing customer downtime.
Now that you have learned about the five prominent disturbed tracing tools, discover the key factors to consider when choosing one for your organization.
5 Factors to Consider When Choosing Distributed Tracing Tools
In today’s digital landscape, ensuring application and infrastructure reliability, performance, and security is paramount. This is where observability comes into play—the ability to gain insights into a system’s internal state and behavior by investigating telemetry data and system output. It is a significant concept that requires in-depth understanding, specifically for DevOps, which involves:
- Rapid development
- Integration
- Delivery
Choosing the right observability tool is essential for identifying and addressing issues, optimizing performance, and enhancing user experience. However, choosing the right tool and making an informed decision can be challenging. If you need help with the same issue, here are some factors to consider when selecting the right data-tracing tool.
1. Ease of Integration
Assess how easily you can integrate with your existing infrastructure. A tool that can seamlessly integrate your stack technology can reduce complexity.
Developers and users can choose tools without proprietary query languages to empower their skills and expertise. When distributed tracing tools utilize common query languages or offer user-friendly interfaces, they reduce the learning curve and accelerate the onboarding process.
Tools prioritizing self-service capabilities also empower users to gain valuable information and troubleshoot issues without needing specialized, dedicated resources.
| Observability Tools | Ease of Integration | Reliance on Proprietary Query Languages | Prioritize Self-Service Capabilities |
|---|---|---|---|
| Jaeger | ✔️ | ✖️ | ✔️ |
| Datadog | ✔️ | ✖️ | ✔️ |
| Zipkin | ✔️ | ✔️ | ✔️ |
| New Relic | ✖️ | ✔️ | ✔️ |
| Splunk | ✔️ | ✔️ | ✔️ |
Among the five observability tools, New Relic has a steep learning curve for new users unfamiliar with APM tools. It also relies on proprietary query languages alongside Zipkin and Splunk.
2. Scalability
One significant factor is scalability, which encompasses performance and cost aspects. Performance scalability is essential because as systems increase data volume and complexity, the distributed tracing tools must keep pace without compromising speed and accuracy. The chosen distributed tracing tool should seamlessly handle the following without degrading performance:
- Increasing data sources
- Metrics
- Logs
Equally important is cost scalability, as organizations need to manage their budgets effectively. Observability tools must provide pricing models corresponding to their usage, preventing unexpected financial burdens as observability requirements expand. This logic proves that a robust observability solution must employ a balance that offers the flexibility to adapt to needs while remaining cost-effective. This guarantees that insights into system behavior remain accessible and affordable as an organization scales.
3. Cost
Cost is one crucial factor to consider when choosing observability tools. Open-source tools eliminate licensing fees, can be deployed within your cloud and network, and allow developers to administer resources more efficiently within your organization.
On the other hand, commercial observability tools often have user-friendly interfaces. They may better fit organizations with plentiful resources and budgets. These tools offer limited customization options and integrations, requiring skilled engineers to customize them per their requirements. More often than not, many of these tools must integrate seamlessly to the point where developers have issues intercepting data flowing through the system at various pathways.
Among the five introduced distributed tracing tools, Jaeger offers their features for free. The other providers enforce a fee that varies based on the volume of data you collect.
4. Data Residency
Data residency and compliance regulations are critical when selecting distributed tracing tools. Many countries and regions have strict rules and governance when handling sensitive data and storage, and adhering to these rules can result in legal and financial issues.
Distributed tracing tools must adhere to these rules and regulations, so choosing tools with data residency compliance features, such as the ability to specify data storage and encryption, is essential. Additionally, distributed tracing solutions that offer flexible data residency options allow organizations to navigate changing compliance requirements as they extend their operations.
5. Vendor Lock-in
Vendor lock-in is an important factor to consider when choosing a distributed tracing tool. This occurs when a company relies heavily on its proprietary technologies, making it difficult to migrate to alternative solutions in the future.
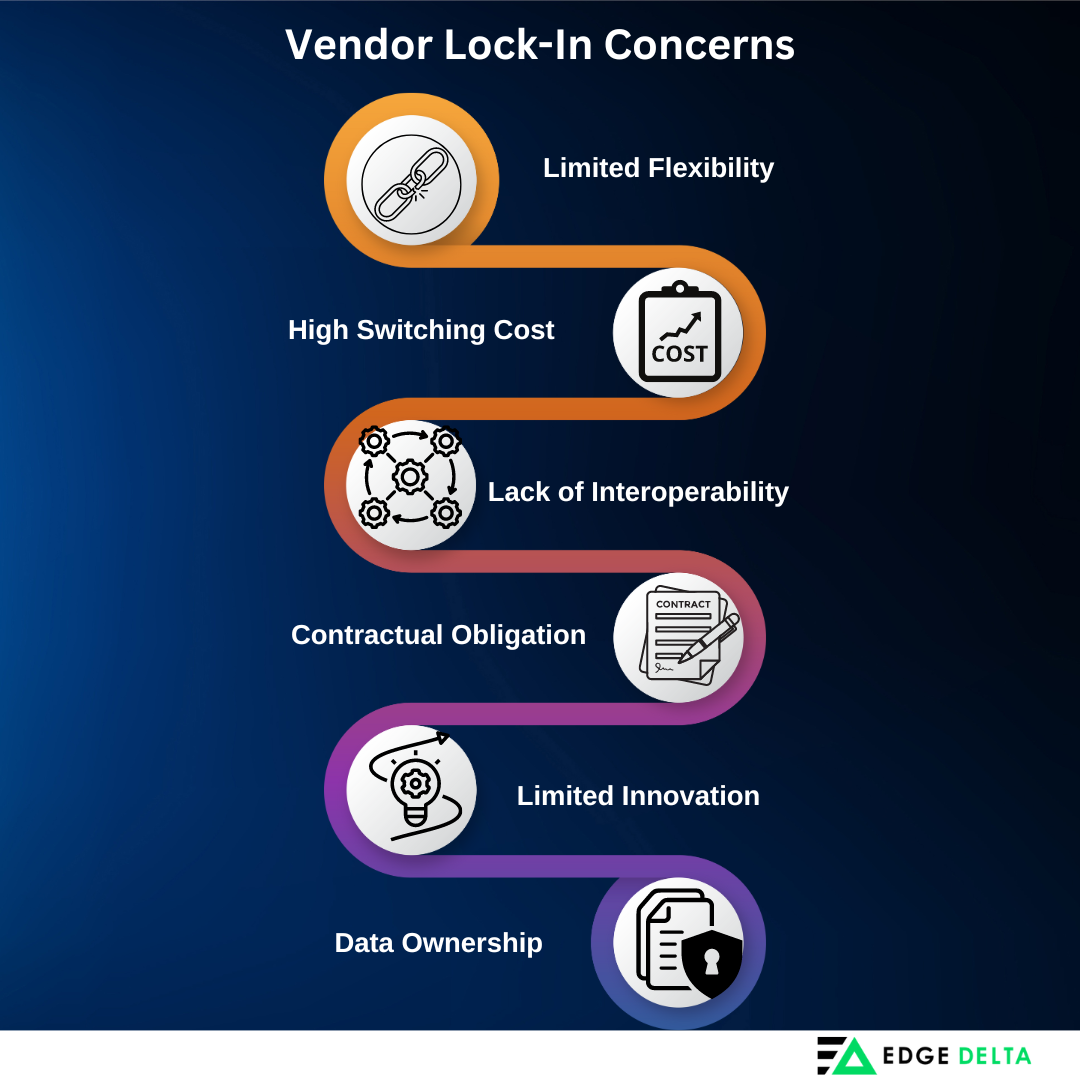
Vendor lock-in can be problematic, specifically for commercial observability tools offering unique integrations and features. Although applying a distributed tracing tool can provide immediate results, it can limit your organization’s pricing and contract renewal flexibility. To mitigate the risks of vendor lock-in, adhering to data formats and open standards is a must-do to enable seamless data interoperability and portability with another system.
Wrap Up
Distributed tracing has become crucial for developing teams working in distributed microservice architectures, ensuring that problems are identified and resolved when they occur.
When choosing a distributed tracing tool, prioritize what best suits your business’s unique needs. This generally involves carefully considering and evaluating the requirements, including the infrastructure’s scale, the applications’ complexity, and the overall goals.
FAQ on Top Distributed Tools
Which tech tool is commonly used for distributed tracing in data observability platforms?
Jaeger and Zipkin are widely used for distributed tracing.
What are the real-time applications of distributed tracing systems?
Distributed systems are widely used in real-life applications such as online banking, social networking, and cloud computing. Online banking is a prime example of a distributed system.
What is the most common example of a distributed system?
The most common example of a distributed system is Peer-to-peer networks, which evolved into e-mail and the Internet.

